Figure 1a illustrates the generation of ultrahigh order wave-mixing photons resulting from the superposition of an intense fundamental field with a cycle-averaged intensity of \({I}_{1}\approx 1\times {10}^{13}\,{{{{\rm{W}}}}/{{{\rm{cm}}}}}^{2}\) and a weak second-harmonic field with an intensity of \({I}_{2}\approx 1\times {10}^{12}\,{{{{\rm{W}}}}/{{{\rm{cm}}}}}^{2}\). This phenomenon occurs when the two fields are arranged at the crossing angle of \(\theta \approx 18\,{{{\rm{mrad}}}}\) and time zero, for details see Supplementary Information (SI), Section 1.1. A similar experimental arrangement has been previously discussed in the context of ultrahigh wave-mixing measurements in the gas phase45. Compared to conventional collinear pump-probe geometry, this noncollinear configuration offers several advantages, including background-free measurements by avoiding two-photon sideband absorption and energy overlap under two-color field conditions, as well as the capability for momentum- and parity-resolved high-harmonic generation (HHG) spectral measurements.
Fig. 1: Spatiotemporally resolved ultrahigh-order wave mixing spectra.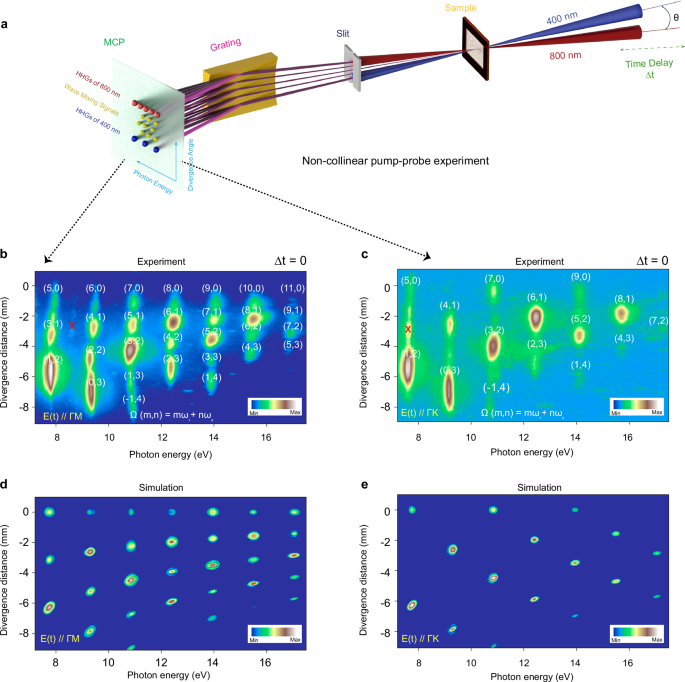
a Schematic representation: The \({\omega }_{1}\) beam is positioned in the horizontal plane, while \({\omega }_{2}\) the beam points downwards at an angle of θ ~ 18 mrad, forming a plane parallel to the entrance slit of the XUV spectrometer. b, c Ultra-high-order wave-mixing spectra generated from the superposition of an intense pump fundamental \({\omega }_{1}\) (800 nm) at zero time delay and the second harmonic weaker probe field (400 nm) in the α-quartz sample, with both pulses linearly polarized to the Γ-M (b) and Γ-K (c) directions of the Brillouin zone, respectively. The number inside the bracket \((m,n)\) represents the number of absorbed photons from the pump and probe pulses, respectively, i.e., \(\Omega (m,n)\propto (m{\omega }_{1}+n{\omega }_{2})\). d, e represent the noncollinear simulations considering inversion symmetry parallel to the two electric fields, either in the Γ-M (b) or Γ-K (c) directions of the Brillouin zone. The color bars are normalized to their maximum harmonic yields and presented on a logarithmic scale. The symbol × indicates the second-order diffraction signal.
Notably, owing to the slight inclination of the two pulses, as shown by the solid lines in Fig. 1a, not only their respective harmonics but also their combined wave-mixing frequencies are recorded. The α-quartz crystal, composed of silicon (Si) and oxygen (O) atoms, belongs to the trigonal crystal system, with space group P3121 for left-handed and P3221 for right-handed quartz, and lacks spatial inversion symmetry, leading to the emergence of significant Berry curvature responsible for the generation of even harmonics with polarization perpendicular to the driving field12. In the case of our noncollinear geometry, the inversion symmetry of the electric field cannot be perfectly broken. Yet the α-quartz crystal already has a broken inversion symmetry along the Γ-M direction of the Brillouin zone. As a result, as shown in Fig. 1b, we observe the emission of an even total number of photons, represented as \(m+n={{{\rm{even}}}}\), such as (\(m=2\), \(n=2\)), (4, 2), (6, 2), and (8, 2) mixing photons, deviating from the parity conservation law. To provide a similar observation, we recorded the ultrahigh wave-mixing spectrum in the Γ-K direction, as depicted in Fig. 1c. In this scenario, only an odd total number of mixing photons (\(m+n={{{\rm{odd}}}}\)) was observed, and all even total number of harmonics disappeared, indicating the presence of inversion symmetry along the Γ-K direction.
To understand the influence of the inversion symmetry on the ultrahigh-order wave-mixing spectra, we performed numerical simulations to solve the semiconductor Bloch equations (SBEs) by incorporating the noncollinear two-pulse interaction at temporal overlap with an angle of \(\theta \sim 18\,{{{\rm{mrad}}}}\) and a beam size around μ ~ 50 μm (see SI, Sec. 2). To directly compare with experimental results, we calculated the far field spatial-resolved spectrum \(I(\omega,x)\) using experimentally measured parameters as input to the non-collinear numerical simulations of SBEs (see SI, Sec. 2.2). The simulated results, as shown in Fig. 1d, e, considering the inversion symmetry of the crystal (i.e., the complex transition dipole moment), demonstrate perfect consistency with the experimental results.
The optical properties of α-quartz crystal are significantly influenced by the Coulomb interaction of electrons and holes46. This results in the existence of a fundamental exciton with a high binding energy of \({E}_{{{{\rm{ex}}}}}=1.2\,{{{\rm{eV}}}}\)23,46, which is self-trapped in the tetrahedral anion complex (SiO4)4− (see inset in Supplementary Fig. 6). According to the ab initio study47, the exciton localization length is up to 4.2 Å, which is comparable with the lattice constants, a = b = 4.9 Å and c = 5.4 Å48, implying that the fundamental exciton in α-quartz is of the Frenkel type49. Group-theoretical analysis of exciton energy spectrum gives the first excited and the second optically active states denoted as 1A1 and 2T2, respectively, where A1 and T2 are the irreducible representations of the tetrahedral symmetry group Td50.
Figure 2a illustrates the main mechanisms of HHG in solids, including intraband current densities \({\tilde{J}}_{i,{{{\bf{K}}}}}(\omega )\propto {\mathcal F} \,[{n}_{i,{{{\bf{K}}}}}(t){\nabla }_{{{{\bf{K}}}}}{E}_{i,{{{\bf{K}}}}}(t)]\) depending on instantaneous band populations and group velocities, and interband polarization densities \({\tilde{P}}_{ij,{{{\bf{K}}}}}(\omega )\propto {\mathcal F} \,[{{{{\bf{d}}}}}_{ij,{{{\bf{K}}}}}{\rho }_{ij,{{{\bf{K}}}}}(t)]\) depending on the transition dipole matrix elements18, where \({{{\bf{K}}}}\equiv {{{\bf{K}}}}(t)={{{\bf{k}}}}+{{{\bf{A}}}}(t)\) is the kinetic crystal momentum of carriers driven by the field, and \({{{\bf{A}}}}(t)=-{\int }_{{t}_{0}}^{t}{{{\rm{d}}}}t^{\prime} \,{{{\bf{F}}}}(t^{\prime} )\) is the vector potential. Hereafter, we omit the time argument of kinetic momentum, for brevity.
Fig. 2: AC Stark shift and dynamical Franz-Keldysh effect revealed by time-resolved non-collinear spectroscopy.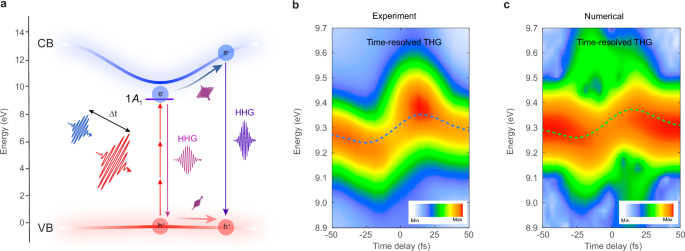
a The main mechanisms of HHG in solids involving interband polarization and intraband currents within a pump-probe geometry. Note that \(\Delta t > 0\) indicates that the pump pulse precedes the probe pulse. The pulse duration of the pump and probe is 25 and 28 fs, respectively. b, c The experimentally measured and numerically simulated time-resolved (0, 3) (third harmonic, H3) spectra of the probe pulse. The coloured dashed line in the measured and simulated spectra depicts the spectral shift of the third-harmonic energy \(\Delta {E}^{(0,3)}\). The laser pulses are polarized along the Γ-K direction of the Brillouin zone for both the measured and simulated spectra. The color bars are normalized to their maximum harmonic yields and presented on a logarithmic scale.
To investigate the dynamics of the coherent spectral response, a manifestation of AC Stark shift and dynamical Franz-Keldysh effect, we acquired integrated time-resolved harmonic spectra from the weaker probe field \({\omega }_{2}\) at the (0, 3) harmonic order. Figure 2b was acquired with the probe and pump pulse intensities set at 2 × 10¹¹ W/cm2 and 4 × 10¹² W/cm2, respectively. The trace exhibits a delay-dependent energy modulation of the spectrum profile, which varies as the delay \(\Delta t\) is tuned from negative to positive values. By performing the centroid analysis of the spectra in the energy domain, represented by the dashed blue lines, we observe a modulation depth (peak-to-peak) reaching up to ~114 meV. This indicates a significant variation in the central energy of the spectral response as the delay \(\Delta t\) is changed. We also captured the time-resolved spectra of the pump field, as depicted in Supplementary Fig. 2, where we observed an increase in the yields of the harmonics (7th to the 11th order) without any significant centroid energy shift. This behavior contrasts with the energy-modulated spectral profiles observed in harmonics generated from the probe field. Recent work has highlighted the enhanced efficiency of HHG through a similar two-color field in silica51. The noted distinction between the harmonics produced by the weaker probe and the intense pump field underscores the field strength-dependent dynamics and responses of the system during the HHG process.
To understand the delay-dependent harmonic centroid shifts of the probe pulse, we performed quantum numerical simulations to solve the noncollinear SBEs in the length gauge using a two-band model. Figure 2c depicts the time-resolved data traces of the H3 signal from the probe pulse, simulated with similar probe and pump pulse intensities as those of the experimental data in Fig. 2b using a dephasing time T2 = 3 fs. The numerical simulation successfully reproduces both the modulation of the harmonic centroid energy and the observed bleaching effect when the two pulses are close to overlapping. While higher-order contributions remain evident, they exhibit an opposite temporal evolution, resulting in a blueshift at negative delays and a redshift at positive delays. However, these effects are not experimentally observable due to the constrained signal-to-noise ratio of the measurements.
To confirm the excitation regime, we analyzed the pump intensity-dependent yields of the harmonics (Supplementary Fig. 3). The observed trend reveals that the power law fails to account for the behavior as pump intensity increases, suggesting the involvement of a non-perturbative regime in the current experimental settings. In a noncollinear geometry, the pure time-resolved HHG spectra of the probe can be interpreted as being dressed by the pump pulse, which modifies the electronic states and causes virtual transitions between them. This leads to significant modulations in the cycle-averaged energies and the yields of the HHG from the probe pulse. Therefore, the energy shift in the harmonic spectrum can be understood as the consequence of the perturbation of the Bloch and excitonic states by the charge carriers excited by the pump field. We found that under the influence of a pump pulse, the major contribution to the delay-dependent energy shift of exciton energy can be described within the second order of adiabatic perturbation theory (see SI, Sec. 3.1):
$${\Delta} {E}_{i}^{(2)}(\Delta t) \approx {\sum}_{{\mathbf{k}},\, j \ne i}{\left | {\Omega}_{{ij},{{{\mathbf{K}}}_1}}^{(0,1)}(\Delta t) \right|}^{2}{{\mathrm{Re}}} \left[\frac{\Delta \bar{n}_{ij,{{\mathbf{K}}}_1}(\Delta t)}{\Delta \bar{E}_{ij,{{\mathbf{K}}}_1}(\Delta t)+{{\mathrm{i}}}\gamma}\right]$$
(1)
Here, overline symbol means cycle averaging, indices i and j enumerate the excitonic states and electron-hole pairs in the Bloch bands, \({{{{\bf{K}}}}}_{1}\) is the kinetic crystal momentum of the carriers in the pump field, \({\Omega }_{ij,{{{{\bf{K}}}}}_{1}}^{(0,1)}(\Delta t)={{{{\bf{F}}}}}_{0,1}(\Delta t)\cdot {\bar{{{{\bf{d}}}}}}_{ij,{{{{\bf{K}}}}}_{1}}(\Delta t)\) is the envelope Rabi energy, \({{{{\bf{F}}}}}_{0,1}(\Delta t)\) is the pump pulse envelope multiplied by the unit vector in its polarization direction, \(\Delta \bar{E}_{ij,{{\mathbf{K}}}_1}(\Delta t)=\bar{E}_{i,{{\mathbf{K}}}_1}(\Delta t) – \bar{E}_{j,{{\mathbf{K}}}_1}(\Delta t)\) is the difference between the cycle-averaged instantaneous exciton energies, \(\gamma=1/{T}_{2}\) is the dephasing rate due to carrier-phonon and carrier-carrier interactions beyond the TDHF approximation, \(\Delta {\bar{n}}_{ij,{{{{\bf{K}}}}}_{1}}(\Delta t)={\bar{n}}_{i,{{{{\bf{K}}}}}_{1}}(\Delta t)-{\bar{n}}_{j,{{{{\bf{K}}}}}_{1}}(\Delta t)\) is the difference between the cycle-averaged populations, which can be found by transforming the conduction (c) and valence (v) band populations in the electronic representation as \(n_{i,{{\mathbf{K}}}_{1}}(\Delta t) = {\sum}_{c , v , {{\mathbf{k}}}’} \left| {\mathcal {A}}_{cv{{\mathbf{k}}}’}^{(i,{{\mathbf{K}}}_1)} \right|^2 n_{c,{{\mathbf{k}}}’}(\Delta t)\left[1 – n_{v,{{\mathbf{k}}}’}(\Delta t)\right]\), \({\mathcal {A}}_{cv{{\mathbf{k}}}}^{(i,{{\mathbf{K}}}_1)}\) are the coefficients of exciton state expansion obtained via solution of the Bethe-Salpeter equation, see Eqs. (3) and (4) in SI, \({{\bf{d}}}_{{ij} {,}{{{\bf{K}}}_{1}}}(\Delta t)=\langle i,{{{\bf{K}}}_{1}}|{{\rm{i}}}{\nabla }_{{{\bf{K}}}_{1}}|\, j,{{{\bf{K}}}_{1}} \rangle\) is the transition matrix element. For excitonic states, it can be obtained via similar transformation of interband matrix elements.
We investigated the influence of the dephasing time \({T}_{2}\) on the energy shift, as shown in Supplementary Fig. 9. The centroid energy shift persists even at an extremely short dephasing time of 0.5 fs, which confirms its population dependence and robustness to decoherence. This may also offer a method for a measurement of the dephasing time \({T}_{2}\) in such a complex system. To better describe the dynamics of the energy shifts in the presence of electron-electron interaction, we derived an analytic expression similar to Eq. (1). For the field-dressed excitonic states (see SI Section 3.2), the single-particle energies and optical matrix elements are replaced with the excitonic ones.
In the absence of an electric dressing field, the energy bands and the lowest excitonic 1A1 state are illustrated in Fig. 3a. As shown in Fig. 3b, before excitation of the charge carriers to excitonic and Bloch band states, the redshift appears due to excitonic Stark effect. After the excitation, the harmonics exhibit a blueshift due to the ponderomotive effect of carriers and virtual transitions from the lowest 1A1 state to higher excitonic or Bloch states. The instantaneous energy shift of the exciton, driven by the strong pump field, is given by the following expression:
$$\Delta E_{1A_1}^{(2)}(\Delta t) \approx \Delta E_{1A_1}^{(+)}(\Delta t)+\Delta E_{1A_1}^{(-)}(\Delta t)$$
(2)
Fig. 3: Light-driven carrier energy shifts from self-energy perspective.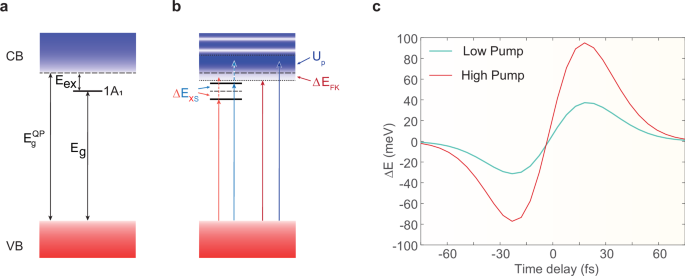
a Energy bands and the excitonic 1A1 state in the absence of an electric field. b Field-induced renormalization of excitonic and Bloch states. Charge carrier transitions in the presence of a strong, non-resonant electric field result in population-dependent excitonic energy shift (ΔEXS) due to the Stark effect, band edge shift (ΔEFK), and density of state oscillations due to dynamical Franz-Keldysh effect, as well as the ponderomotive effect (Up) within the continuum of Bloch states. The colors (red and blue) of the arrows correspond to the energy shifts. c An analytic result for the delay-dependent electron energy shifts derived from the dynamics described in the panel. In negative time delays, when the carriers are in the ground state, the redshift is caused by the excitonic AC Stark and dynamical Franz-Keldysh effects. For positive time delays, the field-induced virtual transitions between the excitonic and Bloch states as well as the ponderomotive effect, contribute to the excited carrier energies and induce a blueshift. The light blue and red lines represent the low and high pump conditions, respectively.
Here, the first term
$$\Delta E_{1A_1}^{(+)}(\Delta t)= \int_{{\mathrm{BZ}}} \frac{{{\mathrm{d}}}^3 k}{(2\pi)^3} \left\{ \left| {\Omega}_{1A_1\,2T_2,{{\mathbf{K}}}_1}^{(0,1)}(\Delta t) \right|^2 {{\mathrm{Re}}} \left[ \frac{ \Delta {\bar{n}}_{1A_1\,2T_2,{{\mathbf{K}}}_1}(\Delta t) } { \Delta {\bar{E}}_{1A_1\,2T_2,{{\mathbf{K}}}_1}(\Delta t)+{{\mathrm{i}}} \gamma }\right] \right. \\ + \left. \left| {\Omega}_{{1A}_{1} \, {{\mathrm{cv}}},{{\mathbf{K}}}_{1}}^{(0,1)}(\Delta t) \right|^2 {{\mathrm{Re}}} \left[ \frac{ \Delta {\bar{n}}_{1A_1\,{{\mathrm{cv}}},{{\mathbf{K}}}_1}(\Delta t) } { \Delta {\bar{E}}_{1A_1\,{{\mathrm{cv}}},{{\mathbf{K}}}_1}(\Delta t)+{{\mathrm{i}}} \gamma }\right] \right\}$$
(3)
describes the blue shift due to virtual transitions between the lowest 1A1, the next optically active exciton state 2T2 (first term in braces) and the Bloch states (second term in braces).
The second term
$$\Delta E_{1A_1}^{(-)}(\Delta t)=\displaystyle\int_{{\mathrm{BZ}}} \frac{{\mathrm{d}}^{3}k}{(2\pi)^3}\,{\left|{\Omega}_{1A_1\,0,{\mathbf {K}}_1}^{(0,1)}(\Delta t)\right|}^{2} {{\mathrm{Re}}}\left[\frac{\Delta {\bar {n}}_{1A_1\,0,{{\mathbf{K}}}_1}(\Delta t)}{\Delta {\bar {E}}_{1A_1\,0,{\mathbf {K}}_1}(\Delta t)+{\mathrm {i}}\gamma }\right]$$
(4)
accounts for the red shift in the delay-dependent H3 spectra due to the excitonic AC Stark effect, which dominates at negative delays, when the charge carriers are primarily in the ground state.
According to the Eq. (2), the results obtained, as illustrated in Fig. 3c, qualitatively reproduces the features of both the experimental data and numerical calculations, except the negative time delays with an increase of intensity. As before the time overlaps, i.e., \(\Delta t , the pump dressing field leads to a dominance of excitonic states. On the other hand, a similar crossover of strong-field effects exists on the single-particle level with band states. There is the dynamical Franz–Keldysh effect reducing the bandgap and modifying the density of states (see Fig. 3b). When \(\Delta t > 0\), a significant number of carriers can be excited to the 1A1 excitonic state and to the conduction band, by exciton dissociation or via direct interband transitions.
The charge carriers excited to the Bloch bands could receive further energy from the laser field via the ponderomotive effect, which results in a blue shift given by expression2 generalized to the TDHF approximation:
$${{U}^\frown}_{{{\mathrm{p}}},{{\mathbf{k}}}}(t)=\frac{1}{T_{0,1}}\int_{t – T_{0,1}/2}^{t+T_{0,1}/2} \Delta {{E}^\frown}_{{{\mathrm{cv}}},{{\mathbf{K}}}_1} (t_1)\,{{\mathrm{d}}} t_1 – \Delta {{E}^\frown}_{{{\mathrm{cv}}},{{\mathbf{k}}}},$$
(5)
where energies of electron-hole pairs are renormalized by the Coulomb interaction
$$\Delta {{E}^\frown}_{{{\mathrm{cv}}},{{\mathbf{K}}}_1}(t_1)={{E}^\frown}_{{{\mathrm{c}}},{{\mathbf{K}}}_1}(t_1) – {{E}^\frown}_{{{\mathrm{v}}},{{\mathbf{K}}}_1}(t_1),\quad{{E}^\frown}_{i,{{\mathbf{K}}}_1}(t_1)=E_{i,{{\mathbf{K}}}_1} – {\sum}_{{{\mathbf{q}}} \ne {{\mathbf{K}}}_1} V_{|{{\mathbf{K}}}_1 – {{\mathbf{q}}}|} \, n_{i,{{\mathbf{q}}}}(t)$$
(6)
To quantitatively assess the impact of energy shifts, we conducted experiments with the intensity of the probe pulse held constant at 2 × 10¹¹ W/cm2. We recorded the time-resolved harmonic spectra while varying the pump intensities in the range of approximately \(7.6\times {10}^{11}\) to \(4.8\times {10}^{12}\,{{{{\rm{W}}}}/{{{\rm{cm}}}}}^{2}\). Both the pump and probe pulses were polarized along the Γ-M direction.
As shown in Fig. 4a, the integrated energy shifts exhibit significant modulations in the time-delayed H3 spectra of the probe, as observed through power-scaling measurements. These results align well with the quantum simulations (Fig. 4b) and analytical results (Fig. 4c) based on the calculated delay-dependent electron density variations. We observed that, under moderate pump amplitudes, the blue and red shifts of the harmonic centroid energy exhibit symmetric growth. However, as the pump intensity increases, the centroid energy shift displays a squeezed asymmetric profile, with the blue shift being larger than the red shift. This anisotropy can be understood as a consequence of asymmetry between the coefficients of perturbative expansion for transitions from the ground state and the first excited state. They are given by the ratios of the squared modulus of the transition matrix element divided by the energy difference of the virtual transition. The higher the pump field intensity, the more significant the asymmetry between the red and blue shifts. Additionally, subtle temporal behavior is observed in the analytical spectra, which is symmetric about zero-time delay. In contrast, the harmonic centroid shift reverses negative delays in the other two cases, a discrepancy that can be attributed to higher-order effects.
Fig. 4: Pump-pulse-dependent carrier energy shift.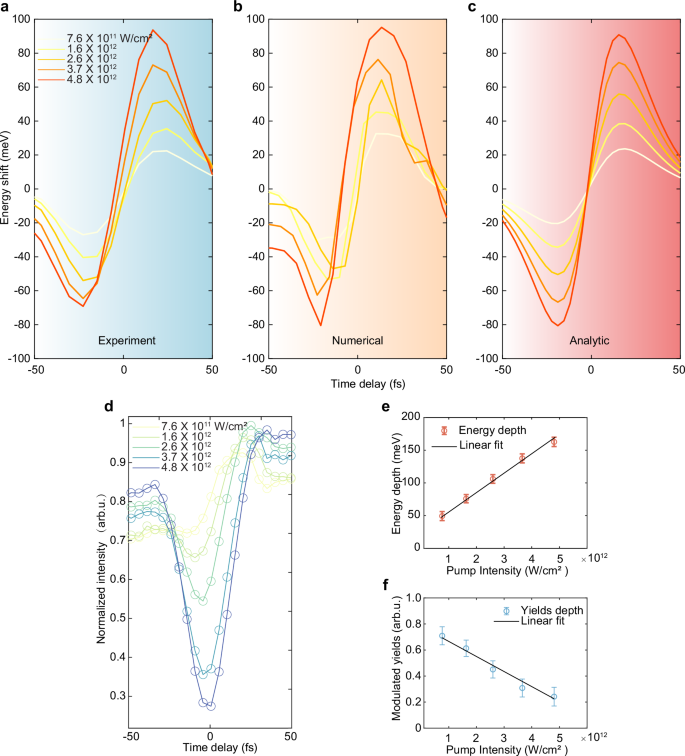
a Integrated time-delayed central energy shift in the H3 spectra of the probe obtained through intensity-scaling measurements when both pump and probe pulses are polarized along the Γ-M direction, respectively. The estimated peak intensity of the pump ranges from 7.6 × 10¹¹ to 4.8 × 10¹² W/cm2, while the probe intensity is 2 × 10¹¹ W/cm2. b, c Intensity-dependent numerical simulation and analytic solution when using similar parameters in the experimental setting. d Integrated time-delayed intensity modulations under different pump intensities. e Variation of the extracted energy modulation depth (peak-redshift to peak-blueshift) with the pump intensity, along with fits following the linear trend (solid black line). f Extracted modulation yields (spectral intensity) around zero delay under different pump intensities, with its linear fit shown as a solid black line. The error bars represent statistical uncertainties based on five measurements under identical experimental conditions.
The modulation intensity depth, represented by the peak-to-peak variation after intensity normalization, is extracted and presented in Fig. 4d. The experimental results agree well with our model as shown in Fig. 4e, which employs the fitting model \(\Delta E\propto {I}_{1}\), indicating the feasibility of achieving continuous manipulation of electron energy by varying the instantaneous driving field intensity. Considering that the influence of the pump field operates within the nonperturbative regime, the observed bleaching effect demonstrates a linear scaling, as depicted in Fig. 4f. Our findings establish a foundation for dynamically tuning carrier energies on fs timescales, which can be applied in spectral-based all-optical switches and sensing within quantum systems.
In summary, we demonstrate that noncollinear harmonic spectroscopy offers a powerful and versatile platform for dynamically controlling carrier motion via tailored light fields. By unraveling the interplay among key strong-field phenomena—the AC Stark effect, dynamical Franz–Keldysh, field-induced coherent coupling of exciton and Bloch states, and ponderomotive effect—we establish a robust framework for studying the dynamics of carrier energies and many-body effects to explore how variations in external conditions influence these interactions. The ability to induce redshifts and blueshifts of carrier energies within a single pump-probe scan highlights the essential role of both adiabatic and nonadiabatic processes in the driven and open quantum system. This experimental approach can be generalized to other systems, such as wide-bandgap two-dimensional (2D) materials, such as nitrides52, transition metal dichalcogenides (TMDs)53, which exhibit optical properties similar to those of α-quartz crystal and are characterized by strong excitonic effects. HHG has been successfully demonstrated in 2D materials16,17, making such experiments feasible for further exploration of electron-electron correlations. Due to a smaller band gap, one can conduct these experiments using mid-infrared or THz pulses. Noncollinear harmonic spectroscopy deepens our understanding of light-induced phenomena in quantum materials and lays the groundwork for engineering next-generation optoelectronic and nanophotonic devices. By harnessing strong light-matter interactions, our work opens new frontiers in exploring non-equilibrium phases of matter and designing quantum materials with bespoke functionalities, advancing the broader fields of ultrafast science, modern photonics, and quantum technology.