Sample characteristics
Sociodemographics of the sample (n = 6265) approximately reflected the US population makeup. Sixty percent of respondents had at least some college education (60.1%) and nearly half reported income exceeding $50,000 (45%). Nearly all had some form of health insurance (91.8%) and one in three reported they were worried or very worried about the cost of healthcare (35.7%). Compared to urban responders, rural responders were older (44–75+ age group 61.4% vs 51.9%), male (50.3% vs 47.3%), less educated (at least some college 54% vs 61.6%), with lower income (> $50,000 37.7% vs 46.8%), non-minority (White 77.6% vs 50.3%) and identified as Republicans (27.6% vs 38.5%). Fewer rural respondents had private health insurance (26.4% vs 32.9%). They more often reported worry about the cost of healthcare (37.6 vs 35.2). (Table 1).
Table 1 Sample characteristics overall and by geographic location.Messengers for health information
Respondents identified their doctor as the most trusted source of health information (76.2%). This was followed by their own research (36.7%), local/state health departments (32%), the US CDC (31.9%), and friends or family (22.2%). Fewer than 10% of respondents considered local community organizations, places of worship, professional organizations, or employers as credible sources. Trusted sources were consistent among both urban and rural respondents (Fig. 1).
Fig. 1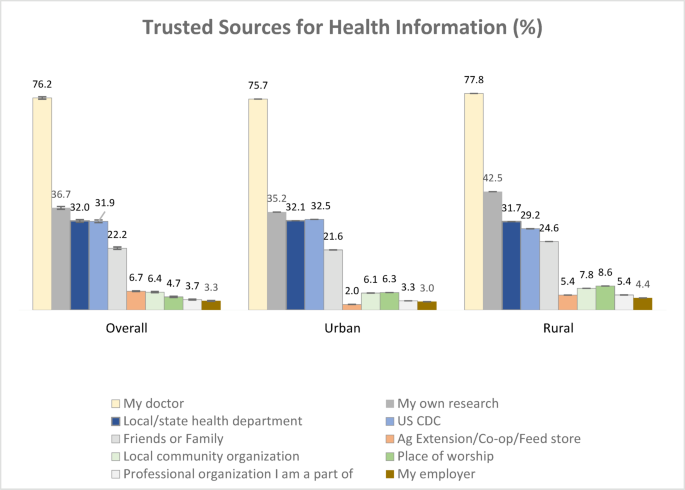
Trusted sources for health information overall and by geographic location. Bars represent standard error of percent. N = 10,000 overall; 5000 urban; 5000 rural.
Nationally, trust in one’s doctor as a messenger of health information was statistically significantly higher among respondents aged 35 and older compared to those aged 18–24, and among respondents with an income greater than $50,000 compared to those earning less. Trust in one’s doctor was significantly lower among Hispanics and Blacks compared to Whites, and among respondents who do not identify as Democrats. Urban trends mirrored national trends, with additional consistently lower trust in one’s doctor among all minorities. Rural trends were also similar; however, trust in one’s doctor for health information was statistically significantly higher among adults older than 45 and also lower among Asian Americans. Income did not reach statistical significance.
Conducting personal research for health information was associated with ages 25–44 and 55–74 compared to ages 18–24, higher education levels compared to high school or less, and political affiliations other than Democrat. It was significantly lower among Blacks, compared to Whites. Urban trends mirrored national trends. Among rural respondents, conducting personal research for health information was also significantly lower among Blacks and higher only in the age group 55–74, those with some college education or more, Independents, and those with no stated political affiliation.
Trust in local and state health departments as messengers of health information generally increased with age but was significantly lower among respondents aged 25–44 and higher among those 75+ compared to responders aged 18–24. Trust was significantly higher among those with higher education levels compared to high school or less, and among Asian/Pacific Islanders compared to Whites, but lower among political affiliations other than Democrat. Urban trends mirrored national trends, except there was no difference in early ages. Among rural respondents, trust in local and state health departments was significantly higher only among respondents aged 65–74 and with a postgraduate degree, and significantly lower among other/multi-racial ethnicities and political affiliations other than Democrat.
Trust in the CDC was significantly associated with higher education levels and higher income. It was significantly lower among Hispanics and Blacks compared to Whites, and among political affiliations other than Democrat. Urban trends mirrored national trends, except there was no difference by ethnicity. Among rural respondents, trust in the CDC was associated with higher education levels but not income. Like trust in local and state health departments, trust in the CDC was significantly higher among respondents aged 65–74, and significantly lower among other/multi-racial ethnicities and political affiliations other than Democrat.
Trusting friends and family for health information significantly decreased with age. It was more common among Asian/Pacific Islanders compared to Whites, and Republicans compared to Democrats. Urban trends mirrored national trends, except there was no difference by political affiliation. Among rural respondents, reliance on friends and family for health information also decreased with higher education levels. The age pattern did not follow a linear trend (Table 2).
Table 2 Adjusted associations between sociodemographics and messengers for health information.Listened to for vaccine advice
Respondents identified their doctor as the most trusted source of advice for vaccines (53.0%), followed by CDC (21.7%), other sources (12.2%), local or state health departments (8.7%) and social media (4.4%). Vaccine advice sources were consistent among both urban and rural respondents (Fig. 2). Most common primary source of news was local television news (25.4%) and national television news (23.6%), followed by social media (16.6%). Sources of primary news were similar among the urban and rural respondents (local news 25.5% and 24.9%, national news 23.4% and 24.4%, social media 16.9% and 16.2%, respectively) (Fig. 3).
Fig. 2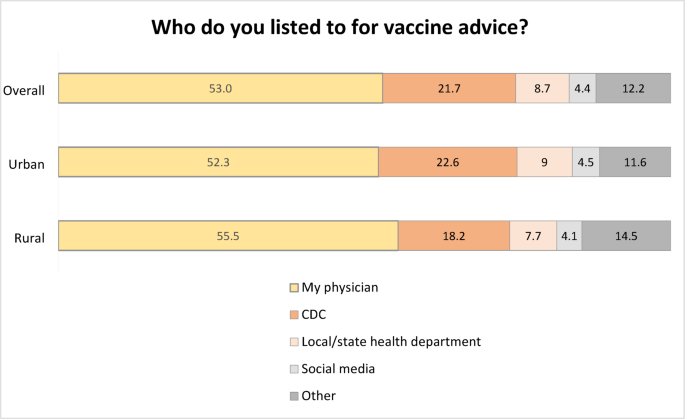
Vaccine advice sources overall and by geographic location. Standard errors: Overall my physician .5, CDC .4, Local/state health department .3, Social media .2, other .3; Urban my physician .6, CDC .5, Local/state health department .4, Social media .3, other .4; Rural my physician .8, CDC .6, Local/state health department .5, Social media .4, other .6. N = 10,000 overall; 5000 urban; 5000 rural.
Fig. 3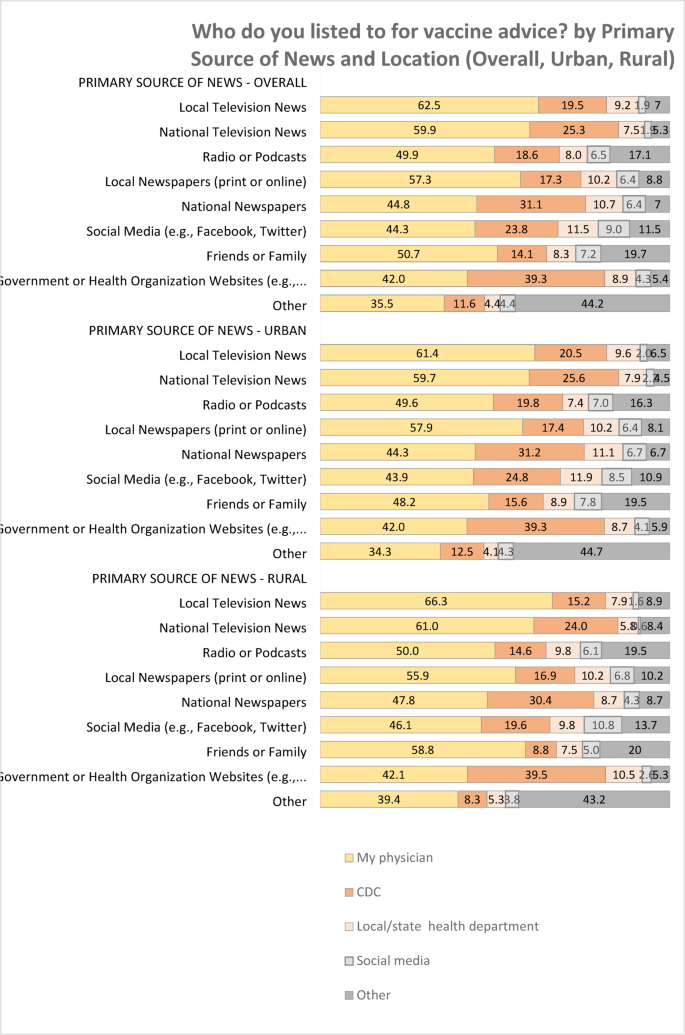
Source of vaccine advice by primary source of news. N = 10,000 overall; 5000 urban; 5000 rural.
Nationally, using one’s doctor for vaccine advice vs. Others increased significantly with age and was higher among females compared to males and Republicans and Independents compared to Democrats. It was significantly lower among respondents with a college degree compared to those with high school of less, among Hispanics, Blacks, Asian/Pacific Islanders compared to Whites, and among rural responders compared to urban responders. Using one’s doctor for vaccine advice was also significantly lower among respondents without health insurance and those with health insurance other than Medicare or Medicaid compared to those with private health insurance. It was higher among those who somewhat worry about the cost of health care compared to those who indicated no worry at all. Urban trends mirrored national trends, with no difference between Hispanics compared to Whites. Rural trends were also similar, with no difference between Blacks compared to Whites and Independents compared to Democrats.
In contrast, listening to local health departments or the CDC vs. others for vaccine advice decreased significantly with age and was lower among females compared to males, and among political affiliations other than Democrat. It was significantly higher among respondents with a college degree compared to those with a high school education or less, and among Hispanics, Blacks, and Asian/Pacific Islanders compared to Whites. Listening to local health departments or the CDC for vaccine advice was also significantly lower among respondents on Medicare and those with health insurance other than Medicare or Medicaid compared to those with private health insurance. It was higher among those who were somewhat or very worried about the cost of healthcare compared to those who indicated no worry at all. Urban trends mirrored national trends. Rural trends were also similar, except there was no difference between Blacks and Asian/Pacific Islanders compared to Whites, and respondents on Medicare compared to those with private insurance (Fig. 4).
Fig. 4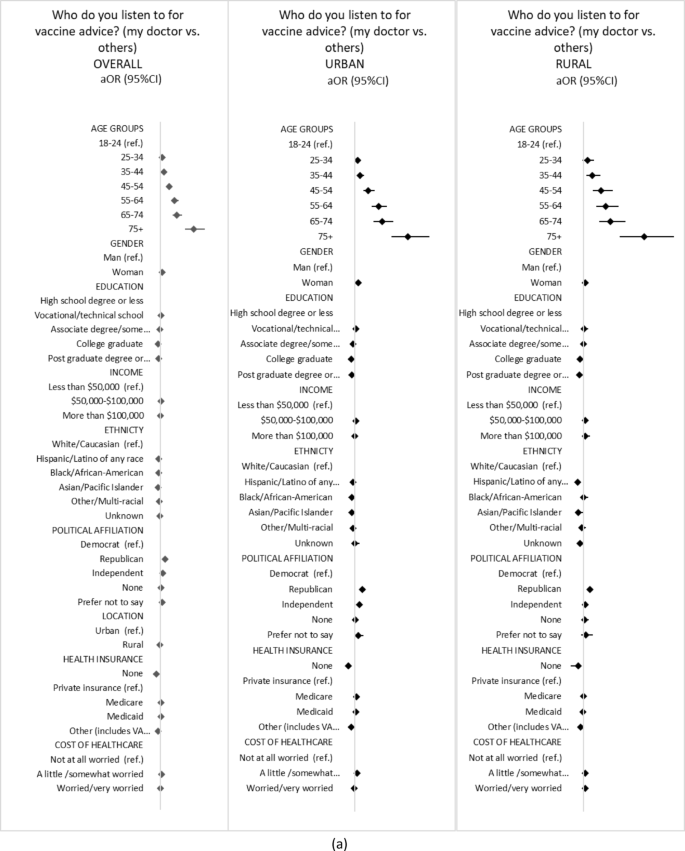
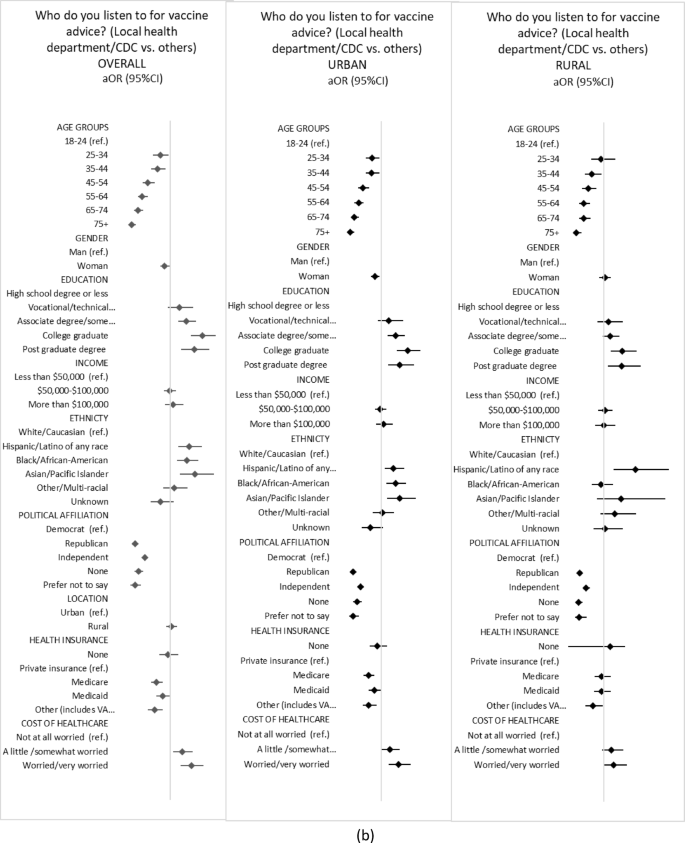
Adjusted associations between sociodemographics and sources of advice for vaccine. Panel (a) My doctor vs. others Panel (b) Local health department/CDC vs. others. Adjusted odds ratios (aOR) and 95%CI from weighted logistic regressions. Vertical line represents 1. Private insurance is private insurance bought on the open market or provided by an employer.