Deep genome sequencing reveals spatial genetic heterogeneity with multiple unique clones in both early and late stage placentas
We included six pregnancies at different stages of placental development: early second trimester, i.e., GA 14–16 (cases 1–2), mid-late second trimester, i.e., GA 18–22 (cases 3–5), and term placenta, i.e., GA 37 (case 6). For each placenta, we collected post-gestational placental biopsies from four different sites (quadrants) alongside fetal tissue, prenatal CVS or AF samples, and parental blood samples. Detailed characteristics of all the included cases are provided in Table 1. Deep genome sequencing was performed on placental and fetal samples with a mean coverage of 146× (range: 99–213×), allowing the genome-wide PZV analysis (see “Online Methods”). Parental samples were included for the identification of de novo germline SSVs (Supplementary Table 1).
Table 1 Characteristics of cases and samples included in the study
We identified PZVs and chromosomal changes detected solely in placental biopsies and not in the fetuses. The key characteristic observed was that all placental biopsies (24 of 24), irrespective of gestational age (GA), had private clonal expansions, with each sample containing unique clusters of PZVs. These individual clones composed 14–62% of the total cell populations in a given biopsy (Fig. 1). Each clone was defined by a distinct cluster of PZVs identified solely in placental biopsies. Clonal expansion refers to the fraction of the total number of sampled cells in a biopsy specimen carrying a specific clone. All PZVs that defined a unique cluster had similar variant allele frequencies (VAF), showing a close relationship, thus defining a separate private clone for that sample, which was not shared across other placental samples (Supplementary Fig. 1). Figure 1 visually summarizes these finding by displaying the proportion of cells in each biopsy represented by the largest clonal expansion, emphasizing the extent of spatial genetic heterogeneity across different placentas. Supplementary Fig. 1 further supports this by presenting VAF jitter plots, illustrating the distinct clusters of PZVs within each sample. This visualization seeks to aid in understanding the heterogeneity and nature of private clonal expansions, which likely arise due to postzygotic events early in placental development. In this study, we defined clones by the clusters of PZVs, which included at least 10 PZVs. Each placental biopsy carried at least one exclusive clone, which was not detected in any other biopsy from the same case (Fig. 2B). For instance, in case 1, which was from the early second trimester, a total of six unique clones were identified in the placenta biopsies, each consisting of 12–125 PZVs (Fig. 2A). In each of the four placental biopsies, a unique clone was identified, which was found exclusively in that corresponding biopsy. The specific cell clones accounted for 13–31% of the total cell population. Similar patterns were consistently observed in the other cases included in the study, both in second and third-trimester placentas. Unique clones comprising >10% of the total number of cells were detected in all biopsies, without exception. From a clinical perspective, it is important to note that the vast majority of these PZVs are in non-coding regions of the genome. While each case contained a total of 254–998 PZVs (Fig. 2B), only 4–11 of these were in the coding regions (Supplementary Table 2). To independently confirm the presence of postzygotic variants identified in the genome analysis, we performed deep targeted sequencing on the P3 biopsy from Case 2, verifying the presence of private clones in placental tissue by identification of identically somatic variant clusters (Supplementary Fig. 5). In addition, CVS samples from Cases 1–3 were also sequenced independently in a clinical diagnostic setting. We consistently identified the same somatic variant clusters in both the research and clinical datasets, providing further independent support for the authenticity of the identified variants (Supplementary Fig. 6).
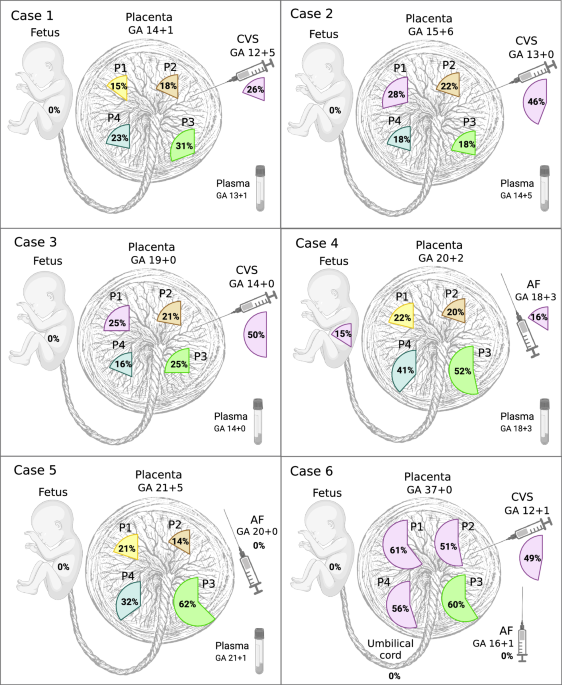
Fig. 1: Dominant clonal expansions of postzygotic small sequence variants (PZVs) were identified in various samples for each case.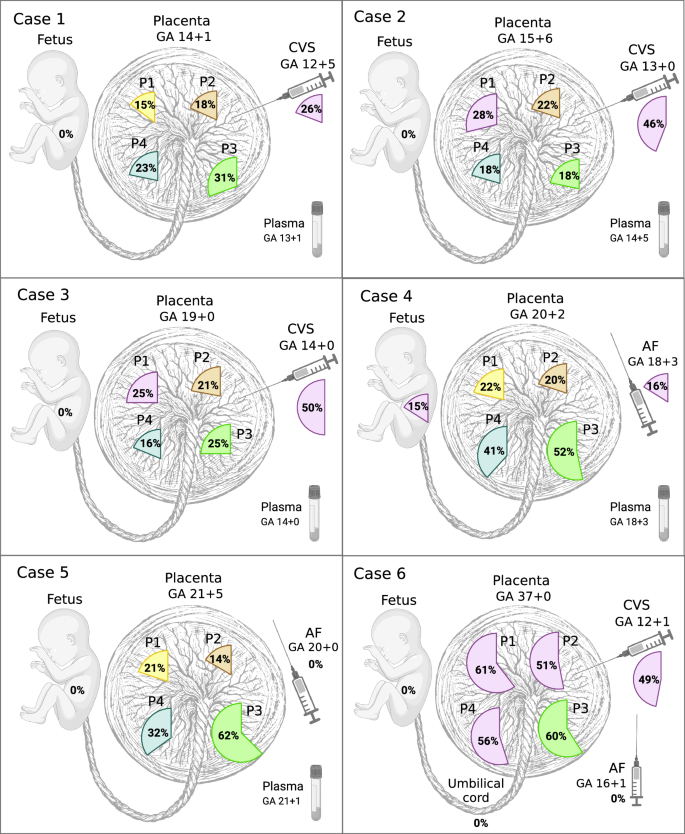
The percentages indicate the fraction of cells within the largest private clone in each sample. AF amniotic fluid, CVS chorionic villus sample, GA gestational age (in weeks), P1–P4 placental biopsies from different quadrants, UC umbilical cord blood. Created in BioRender. Larsen, M. (2025) https://BioRender.com/d8vsj1x.
Fig. 2: Spatial distribution and clonal structure of postzygotic variants across fetal and placental tissues.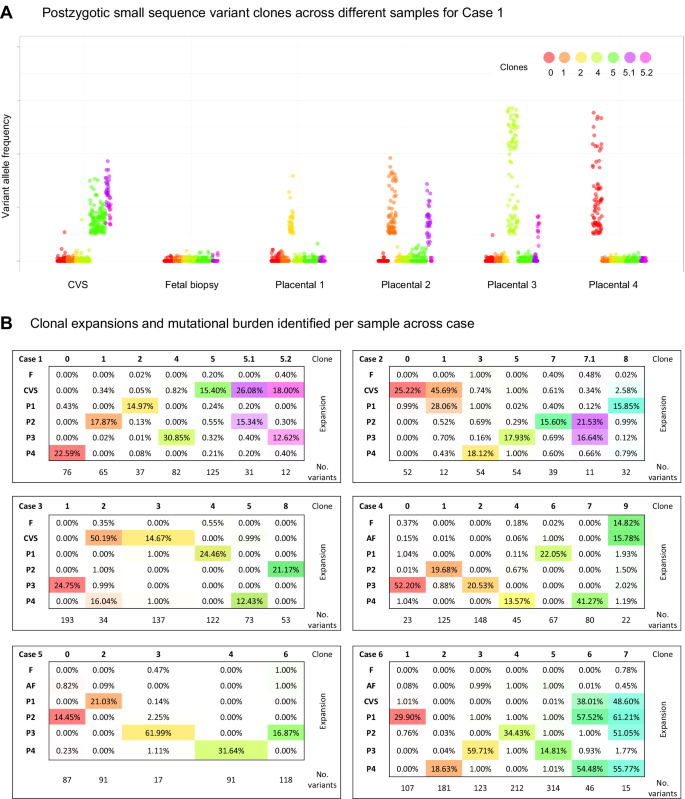
A Variant Allele Frequency (VAF) jitter plot for case 1, depicting postzygotic small sequence variant (PZV) clones across different samples. All cases are shown in Supplementary Fig. 1. B Clonal expansions across samples are defined by clusters of PZVs. The table shows the percentage of cells containing each clone, and the lower rows indicate the number of PZVs defining each clone. In case 1, each placental sample harbors a unique private clone. In cases 2 and 3, some placental samples and CVS share overlapping clones, while case 4 reveals potential confined fetal PZVs, detected at low fractions in fetal tissue and amniotic fluid samples. Source data are provided as a Source data file. AF amniotic fluid, CVS chorionic villus sampling, F fetal tissue, P1–P4 placental biopsies.
Extensive sub-clonal branching is a common feature of placental development
A subset of placental biopsies contained two or more clones (Figs. 2 and 3). In the second trimester, developing placentas (cases 1–5), we observed two different clones in 9 out of 20 biopsies (45%), whereas in the term placenta (case 6), we observed three clones in three out of four biopsies and two clones in the fourth sample. We refer to the largest observed clonal expansion as the dominant clone, hypothesizing that smaller subclones evolved from the main clone that subsequently accumulated additional PZVs (Fig. 3). For cases 1–5, we can only speculate that one clone is dominant and has given rise to a subclone. However, without further data to confirm the origin of these clones, it remains plausible that they represent two distinct clones, each carrying a unique set of variants. For case 6, we can decipher the evolution based on the clonal expansion sizes per sample—the sum of the cell fractions of clones 6 and 7 is above 100% for P1 and P4 placental biopsies in this case (Fig. 2B). Thus, we are more certain that there is a dominant clone 6, and a subclone derived from it carrying PZVs from both 6 and 7 clusters. The presence of multiple PZV clusters demonstrates the coexistence of multiple clones. Although the results allow us to illustrate the dynamic clonal architecture and speculate on the development of the placenta, the data from this study do not allow us to definitively determine whether they are subclones arising from the dominant clone or distinct clones that had evolved in parallel and were coincidentally sampled together.
Fig. 3: Schematic representation of clonal evolution in placental biopsies for each case. Each drop-like insert illustrates the largest clonal expansion per biopsy, while subsequent clonal expansions are depicted relative to their size.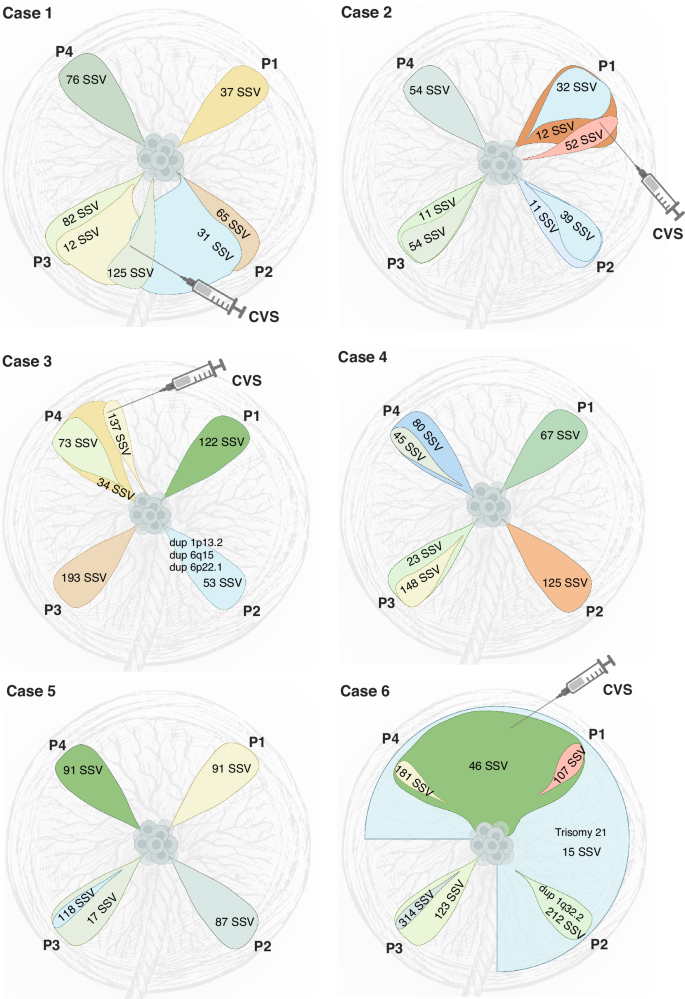
The number of postzygotic small sequence variants (PZVs) per clone, indicating the mutational burden, is annotated on each clone. Postzygotic copy number variants (CNVs) are included in their respective clones. The figure illustrates clonal overlaps between biopsies and offers predictions for CVS sampling locations, while highlighting the mutagenesis and clonal evolution occurring in the developing placenta. Created in BioRender. Larsen, M. (2025) https://BioRender.com/s5sgar7.
Expansion of early clones across larger parts of the term placenta
While each placental biopsy contained at least one unique private clone, in the case of the term placenta (case 6), several biopsies additionally exhibited shared clones (Fig. 3). These shared clones demonstrated their expansion across larger parts of the placenta. In particular, biopsies from the term placenta (case 6) revealed that two clones were shared between multiple samples, showcasing the variability and complexity of clonal expansion across the placenta. One of the clones (clone 6) was observed in two out of four, and the other one (clone 7) was present in three out of four quadrant placental biopsies (Fig. 2B). Notably, both these clones were detected in CVS samples taken in the first trimester but were not identified in the AF analysis.
Clonal compositions reveal the approximate CVS sampling site
In four of the six cases, we obtained CVS biopsies during the first trimester, which allowed us to compare the genetic heterogeneity of CVS and placental biopsies. In all cases, we identified postzygotic clones in the CVS sample. In cases 2, 3, and 6, two distinct clones were identified in each CVS sample, whereas in case 1, three unique cell clones were detected (Fig. 2B). In all cases, at least one of the clones from CVS was shared with a corresponding placental biopsy, suggesting a specific quadrant of the placenta from which the CVS sample most likely originated (Fig. 3 and Supplementary Fig. 1). Thus, the clonal composition of CVS samples revealed the approximate sampling sites within the placenta. This showcases the likely presence of additional clones in the placentas to those we could detect by four random quadrant placental biopsies. Given that our study only included one biopsy from each quadrant of the placenta per case, it is conceivable that the specific sites from which CVS were taken did not uniformly match our quadrant biopsy sites.
Postzygotic copy number variants less common in the developing placenta
Postzygotic copy number variants (CNVs) were called in all placental biopsies. In two of the six cases, we detected postzygotic CNVs that were not found in fetal or parental samples. In total, CNVs were detected in only 3 out of 35 clones identified (8.6%) (Fig. 3). In case 3, three CNVs were observed in one of the placental biopsies (P2)—a 187 kb duplication (1p13.2), a 173 kb duplication (6q15), and a 103 kb duplication (6p22.1)—that were not present in other placental biopsies or the fetus (Supplementary Fig. 2). All CNVs were detected at mosaic levels of 40–50%, most likely originating from clone 7 found in the P2 biopsy. In case 6, three out of four placental biopsies (P1, P2, and P4) showed aneuploidy of chromosome 21 at 50–60% mosaic level. Mosaic trisomy 21 was also detected in the CVS (at 50% mosaic level), but was not observed in the AF or the umbilical cord blood (Supplementary Fig. 2). The trisomy most likely originated from clone 7, which was exclusively found in the three placental biopsies and the CVS sample (Fig. 3). Furthermore, in one of these placental biopsies (P2), a 292 kb duplication (1q32.2, at 50% mosaic level) was detected, corresponding to the clone unique to that biopsy (clone 2) (Supplementary Fig. 2).
Clonal expansions and mutational burden increase with gestational age
Our findings indicate that the size of clonal expansions in the placenta increases with the GA. For example, this is illustrated in Fig. 1 by the largest clonal expansions (51–61%) observed in the term placenta (case 6) and the smallest expansions (15–31%) in the placental biopsies taken after the termination of pregnancy in the early second trimester (case 1). We noticed great variability in clonal expansion size and mutational burden, which mainly seems to be related to the specific pregnancy and the individual sample. Mutational burden depicts the total number of PZVs detected in a clone, while a clonal expansion refers to the clonal cell fraction of the whole sample. Interestingly, in two out of four cases that underwent CVS procedure during pregnancy, the CVS samples exhibited larger clonal expansions than in matched placental biopsies (cases 2 and 3). In another one of those four cases (case 1), we observed a higher than the anticipated mutational burden in the CVS analysis (Fig. 2B). To minimize the effect of outliers or sample-to-sample variability, we assessed the mean largest clonal expansion and the mean mutational burden of four quadrant placental biopsies per case (Fig. 4A, B). This approach revealed a strong correlation between the sizes of clonal expansion and the GA (R = 0.861) (Fig. 4A). The same tendencies were observed for mutational burden, which demonstrated an increase with advancing pregnancy (Fig. 4B).
Fig. 4: Analysis of clonal expansions, mutational burden, and mutational signatures across gestational ages and sample types.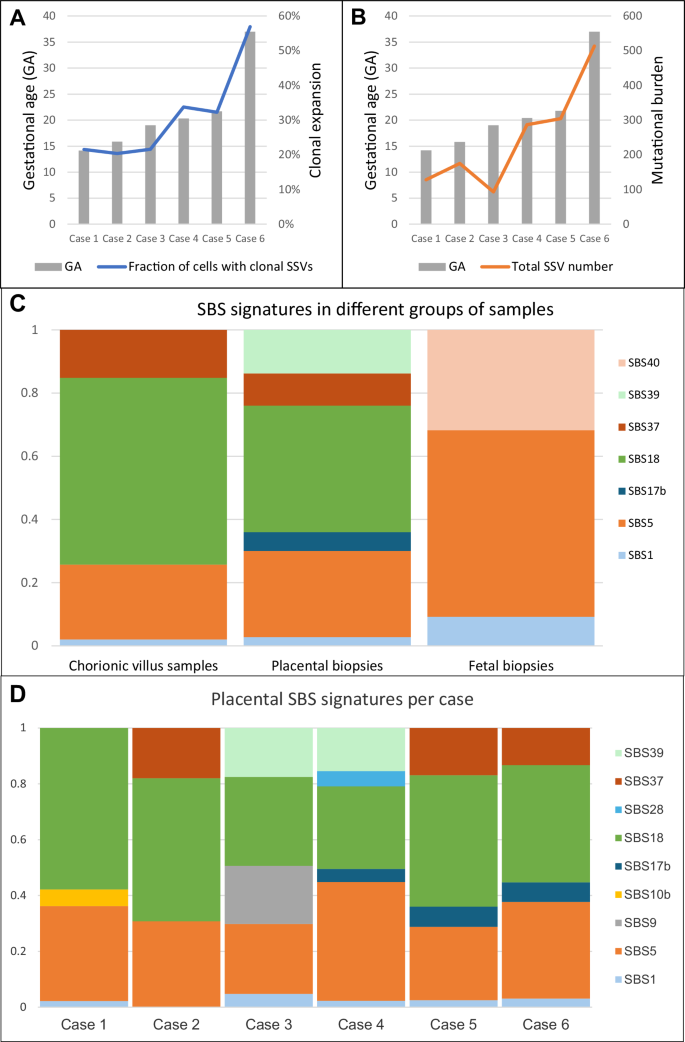
A The mean fraction of the largest clonal expansions observed across placental biopsies in each case, plotted by gestational age (GA). Larger clonal expansions were observed at later gestational ages, suggesting overall enlargement of clonal expansions over time. B The mean mutational burden across placental biopsies in each case, plotted by gestational age. Mutational burden is defined by the total number of postzygotic variants (PZVs) per sample. A positive correlation is observed between advancing gestational age and mutational burden, indicating continuous acquisition of new mutations as the placenta grows and develops. C Distribution of single-base substitution (SBS) signatures across different sample types, including chorionic villus samples (CVS), postgestational placental biopsies and fetal tissue. CVS and placental biopsies include only PZVs, while fetal tissues (amniotic fluid or umbilical cord blood) include germline de novo variants. Notably, SBS18, linked to oxidative stress, was more pronounced in placental tissues, while germline-associated signatures, such as SBS1 and SBS5, dominated fetal samples. D Distribution of SBS mutational signatures across different cases. This analysis highlights the variability and similarities in mutational processes among the cases shaping placental genetic landscapes. Source data are provided as a Source data file.
Characteristics of fetal de novo germline variants
The number of fetal de novo germline SSVs found in the fetal tissue ranged from 52 to 72 SSV per case across the whole genome. Fetal de novo germline SSVs refer to variants present in the fetus but absent from parental samples. Specifically in the coding region, germline SSVs ranged from zero to two per case (Supplementary Table 1). For instance, out of the 54 germline SSVs across the genome in case 1, 58 in case 3, and 60 in case 4, only one SSV per case was detected in the coding region. Case 2 had a total of 72 germline SSVs with two in the coding region, and case 5 had no SSVs observed in the coding region. In case 6, de novo germline SSVs were excluded to facilitate PZV analysis due to the absence of a paternal sample for this case. Regarding the pathogenicity of the variants in the coding region, only one clinically relevant de novo germline SSV was identified in the investigated pregnancies. This heterozygous variant was an indel in the NR2F2 gene identified in case 2 (Table 1) and has been reported to the patient as part of the clinical workflow8. Across all cases, de novo germline SSVs, including the clinically relevant indel in case 2, were consistently detected in each placental biopsy, as well as in the available CVS samples.
No genetic differences observed between amniotic fluid and the fetus
For cases in which an AF sample was analyzed (cases 4–6), we did not observe any genetic differences between the fetus and the corresponding AF sample (Fig. 1). Interestingly, one minor private clone (clone 9) in case 4 was exclusively observed in the fetus and AF. It consisted of 22 PZVs and was observed in around 15% of the cells in both fetal and AF samples. This clone was not detected in any of the placental biopsies, hinting at the mosaicism confined to the fetus (Fig. 2B). It should be noted that in this study, the minor clonal expansions that were observed in less than 10% of the cells per sample (i.e., low mosaic level), were excluded from our analysis. We set the lower detection limit for reliable detection of clonal events; however, clinically relevant low-frequency clones with
Mutational processes in early and late placenta
Mutational signatures of single-base substitutions (SBS) were developed during cancer studies; they represent mutational processes in different cancerous and noncancerous tissues9. We identified mutational signatures from the postzygotic substitution variants found in placental biopsies and CVS samples to explore the underlying mutational processes in the early and late placentas. Additionally, we characterized the mutational signatures of fetal de novo germline SSVs that occurred in gametes to explore potential differences in the mutational processes when compared to placental PZVs. The SBS signatures, SBS1 and SBS5, which are commonly found in noncancerous human tissues and reflect natural endogenous processes10, were detected throughout all the samples: CVS, quadrant placental biopsies, and fetal samples (Fig. 4C). The fractions of SBS1 and SBS5 signatures are substantially higher among the de novo germline SSVs found in the fetal sample group (i.e., AF, Achilles tendon or umbilical cord), accounting for 9.2% and 59.02% of substitutions, respectively, compared to CVS or placental biopsies, where they appear at lower fractions (2.04% and 23.72% in CVS; 2.78% and 27.28% in placental biopsies, respectively). Since variants from SBS1 and SBS5 signatures are reported to be acquired with age9, they are commonly observed in all healthy human tissues. SBS18 was discovered to be the most prominent signature across all included cases and demonstrated high prevalence in both CVS (59.1%) and placental biopsies (40.06%). SBS18 has previously been reported as a hallmark of the term placentas7. However, SBS18 was not identified in the de novo germline SSVs detected in the fetus. Additionally, the SBS37 signature, which has no reported etiology, was observed in both CVS and placental biopsies. In contrast, the SBS39 signature, also of unknown origin, was detected only in quadrant placental biopsies. Notably, neither SBS37 nor SBS39 signatures have previously been reported in placental tissues. Additionally, SBS40, another signature of unknown etiology9, was exclusively observed in fetal samples and not present in any placental samples. When analyzing placental biopsies from each case separately, we observed additional case-specific SBS signatures of low frequency (Fig. 4D).
Placental postzygotic variants in cell-free DNA from maternal plasma
As prenatal analysis based on cfDNA is advancing, we were inclined to examine whether PZVs from placental biopsies are detectable in cfDNA from maternal plasma. We had previously performed deep whole-exome sequencing of cfDNA extracted from maternal plasma samples11 from the pregnancies involved in this study, enabling direct comparison of PZVs found in the exome region in placental samples with maternal plasma taken during pregnancies. Among the coding PZVs identified in placental biopsies, only a single variant from case 5 was detected in the maternal plasma sample (Supplementary Table 2). The other PZVs were not called in maternal plasma. Weak signals below the noise level were observed for a few of these placental PZVs. It is uncertain whether this represents true findings or sequencing artifacts, as these variants were only present in 1–2 reads. However, this data suggests that placental PZVs may not be present at readily detectable levels in maternal plasma even when using advanced deep sequencing methods. While all coding fetal de novo germline SSVs were accurately detected in maternal plasma, as we reported previously11.