Study design and data sources
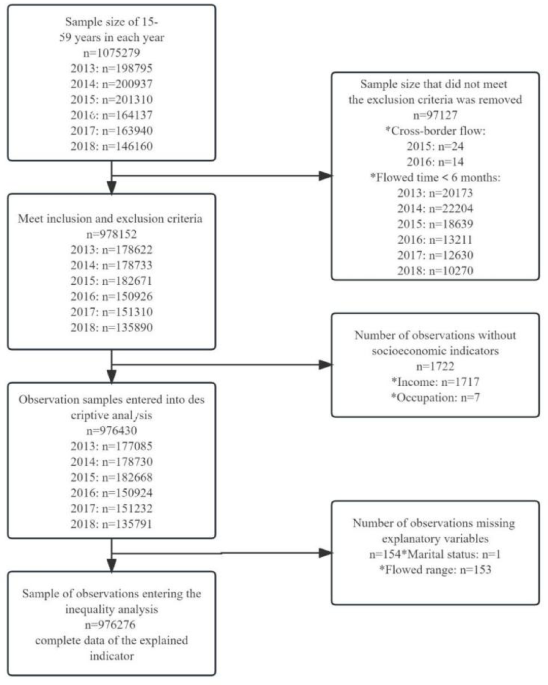
Six rounds (2013–2018) of the China Migrants Dynamic Survey (CMDS: https://www.chinaldrk.org.cn/wjw/#/home) were used in this study. The CMDS is an annual, national cross-sectional survey conducted by the National Health Commission of the People’s Republic of China, covering 31 provinces (districts and cities) and the Xinjiang Production and Construction Corps in China using a stratified, multi-stage, and proportionate-to-size (PPS) method for sampling. The study focuses on the status and access of migrants to health insurance and EPHSs in China. The respondents were internal migrants aged 15–59 years, who have lived outside their registered place of residence (county or city) for at least 1 months. Figure 1 presents data cleaning procedure of the sample. In total, 1,075,279 respondents completed the survey in six rounds of CMDS. As we focus on internal migration, cross-border migration was excluded from the analysis. And because the EPHSs cover population who reside in current place for at least 6 months, migrants with migration duration of less than 6 months were also excluded from the analysis. After excluding cross-border migration and within 6 months of migration duration, 978,152 respondents were included. Excluding 1722 respondents without reporting socio-economic status, there were 976,430 respondents included in descriptive analysis. After excluding 154 respondents who did not report marital status or migration scope, 976,276 respondents were included in equity analysis. All methods were carried out in accordance with relevant guidelines and regulations. We confirm that the informed consent was obtained from all subjects and/or their legal guardians.
Fig. 1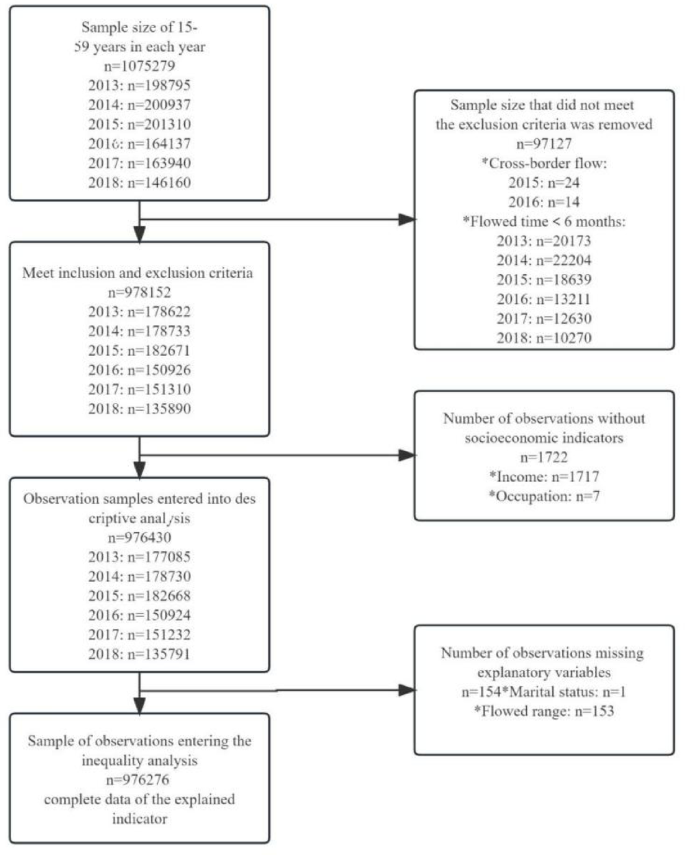
Data cleaning procedure of the sample.
Measurements
Following the WHO and World Bank framework14 we measured UHC progress from two dimensions: coverage of essential health services and financial protection due to health-care costs. We chose two fundamental health services focused on prevention which targeted the whole population : the standardized health record establishment proportion (SHREP) and the standardized health education intervention coverage (SHEIC). The financial protection was measured using two indicators due to the essence of protecting population under health insurance coverage and reducing cost sharing: the basic medical insurance enrollment proportion (BMIEP) and the hospitalization reimbursement rate (HRB) (Table 1).
Table 1 Definition of key indicators.SES index generation
To analyze equity in UHC, we generate a socio-economic indicator (SES). The concept of SES refers to an individual’s relative material and social standing compared to others15. Using a single indicator to measure socioeconomic status may not adequately reflect an individual’s complex socioeconomic circumstances or situation. Integrating various socioeconomic factors into a single index provides valuable insights to a comprehensive socioeconomic gradient of inequities in UHC. In this study, SES was quantified by combining income condition, educational level, and occupation status. Income condition was measured using per capita monthly household income, calculated as follows:
Average Indexed Monthly Earnings (AIME) = individual’s per capita monthly income/national per capita monthly income.
The data for “national per capita monthly income” were obtained from the Statistical Yearbook16 published by the National Bureau of Statistics of China.
Actual per capita monthly household income = total monthly household income/number of household members.
Subsequently, the AIME was divided into six equal categories numerically, ranked from 1 to 6 representing the lowest to highest income groups.
Education was categorized into six levels: illiteracy = 1, primary school = 2, junior high school = 3, senior high school or technical secondary school = 4, junior college = 5, and undergraduate or above = 6.
According to the occupation classification from China’s State Statistics Bureau, the 8 general categories of occupation were consistently used throughout 1999 to 2022, which was classification used in the CMDS questionnaire. Our study used the occupational reputation developed by a previous study based on the 8 general categories17. Occupations were then rated on a 5-level scale: domestic helpers/agriculture/no fixed job/unemployed = 1, employees/self-employed = 2, middle class (employers) = 3, white-collar workers = 4, leaders = 5.
To create a composite SES index, Principal Components Analysis (PCA) was utilized. This method has been validated as a robust approach for describing SES differentiation within a population18. Factor scores were computed by weighting the raw responses with the factor loadings of the PCA. Bartlett’s Test of Sphericity showed: χ²3 = 225046.177, p 0.6), indicating that the data are suitable for factor analysis. The PCA extracts common factor variance percentage of 52.653%. Higher scores indicate higher levels of SES.
Statistical analysis
We did statistical analyses in STATA software 17.0. Descriptive analysis of basic demographic characteristics and UHC indicators were conducted.
Measuring socioeconomic-related UHC inequalities
Traditional measurement of inequalities, like the conventional concentration index (CI) has two drawbacks as below. Firstly, for bounded variables, the CI may depend on the mean of the health variable, making comparisons of populations with different mean health levels problematic19. Therefore, it is not suitable for tracking longitudinal inequalities with different mean health levels. Secondly, the CI does not satisfy the “mirror property”, that is, inequalities in health do not “mirror” those in ill-health20.
Wagstaff21 and Erreygers19 proposed different correction mechanisms to deal with these problems. In this study, we focused on Erreygers’ Index (EI) since it is the only one that measures quasi-absolute inequalities, i.e., it is insensitive to any feasible equal addition to the health variable. The Wagstaff Index (WI) measures relative differences and hence, it is possible that it gives larger inequalities than the Erreygers index when prevalence is low, as is the case for the prevalence in some unhealthy lifestyles. Thus, the EI and WI together could complement each other and provide better measures for longitudinal data to measure changes of inequalities over time.
The EI and WI can be written as.
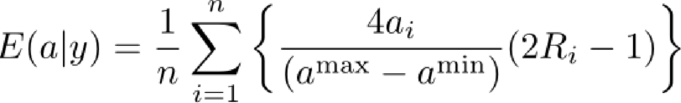
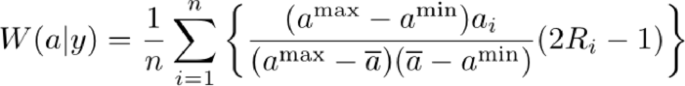
where ai is the range of bounded variables, ai∈[amin, amax]. Ri is the relative rank of the ith individual in the socioeconomic status distribution. Bounded variable can be retransformed into an indicator of the proportional deviation from the minimum value: bi. This lies on the range [0, 1] and records only “real” changes in the underlying attribute, not “nominal” ones due to the choice of measurement scale. Under this transformation, the Erreygers and Wagstaff indices simplify, respectively, to.
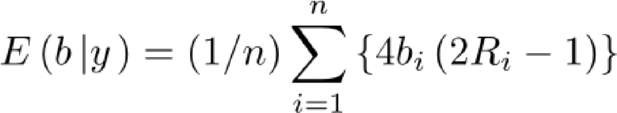
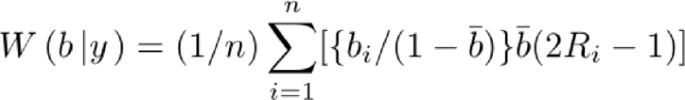
The range of both the Wagstaff Index (WI) and Erreygers Index (EI) is −1 to + 1. When the value falls within the range of [−1,0) or (0,1], it indicates the presence of inequalities in UHC that favors either low or high socioeconomic status (SES) groups. If the value is negative (−1
Decomposition of risk factors of inequalities in UHC
The process of the Recentered Influence Function (RIF)- Ordinary Least Squares (OLS) method is to use the recentered influence function (RIF) estimates of the UHC inequality index to find the relationship between the RIF and the explanatory variables and establish the regression function between the UHC inequality index and the explanatory variables to achieve causal recognition. The method is mainly divided into two steps. The first step is to estimate the RIF value of the WI and EI, and the second step is to use the RIF estimation value of the health inequality index as the explanatory variable and various factors X as explanatory variables to implement the OLS regression process22.