
_0.jpg)
“Seasonal forecasts for El Niño and La Niña and their associated impacts on our weather are an important climate intelligence tool. They translate into millions of dollars of economic savings for key sectors like agriculture, energy, health and transport and have saved thousands of lives when used to guide preparedness and response actions,” said WMO Secretary-General Celeste Saulo.
La Niña refers to the periodic large-scale cooling of the ocean surface temperatures in the central and eastern equatorial Pacific Ocean, coupled with changes in the tropical atmospheric circulation, including changes in winds, pressure and rainfall patterns. Typically, La Niña brings climate impacts that are the opposite of El Niño, especially in tropical regions.
However, naturally occurring climate events such as La Niña and El Niño are taking place in the broader context of human-induced climate change, which is increasing global temperatures, exacerbating extreme weather, and impacting seasonal rainfall and temperature patterns.
While the El Niño-Southern Oscillation (ENSO) is a key driver of global climate patterns, it is not the only factor shaping the Earth’s climate. To provide a more comprehensive climate outlook, WMO also issues regular Global Seasonal Climate Updates (GSCU). These updates take into account the influence of key climate variability patterns, such as the North Atlantic Oscillation, the Arctic Oscillation and the Indian Ocean Dipole. The updates also monitor the global and regional anomalies of surface temperature and precipitation and their evolution over the upcoming season. The global updates inform more tailored and localized outlooks issued by WMO regional centres and national members.
The latest Update says that for September to November, temperatures are expected to be above normal in much of the Northern hemisphere and large parts of the southern hemisphere.
Rainfall predictions resemble conditions typically observed during a moderate La Niña.
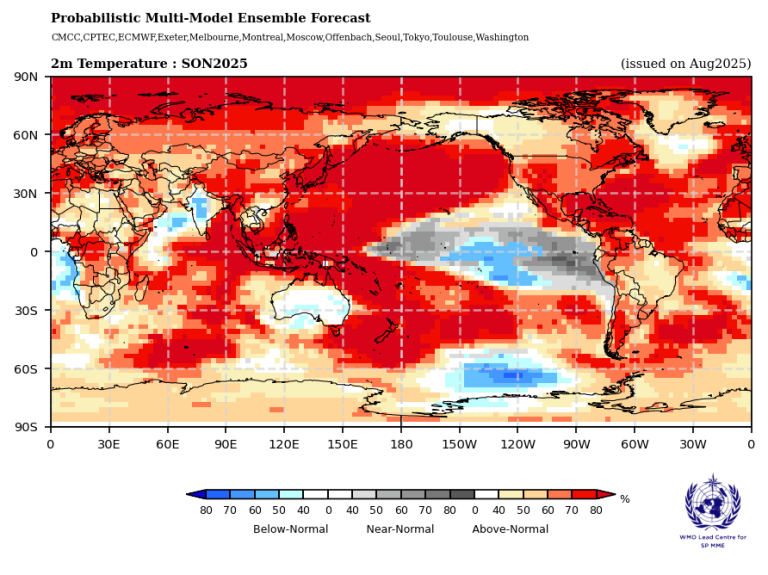
Figure 1. Probabilistic forecasts of surface air temperature for the season September-November 2025. The tercile category with the highest forecast probability is indicated by shaded areas. The most likely category for below-normal, above-normal, and near-normal is depicted in blue, red, and grey shadings respectively for temperature, and orange, green and grey shadings respectively for rainfall. White areas indicate equal chances for all categories in both cases. The baseline period is 1993–2009.
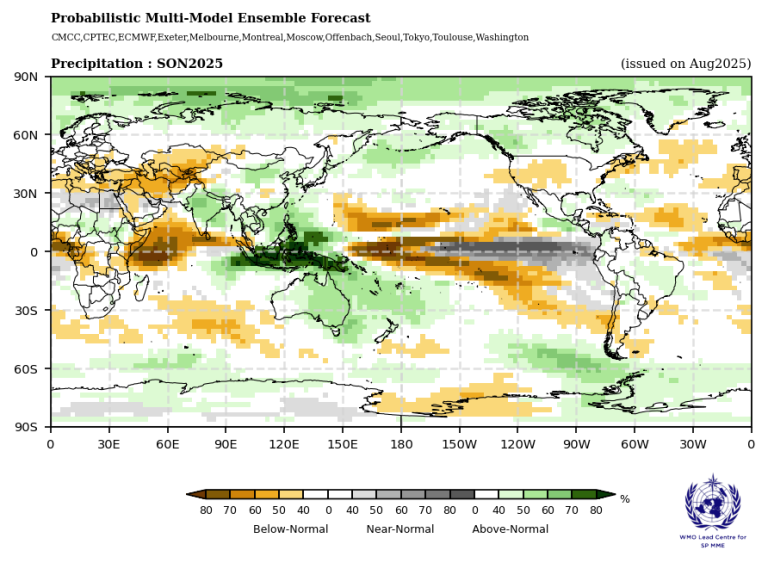
Figure 1. Probabilistic forecasts of rainfall for the season September-November 2025. The tercile category with the highest forecast probability is indicated by shaded areas. The most likely category for below-normal, above-normal, and near-normal is depicted in blue, red, and grey shadings respectively for temperature, and orange, green and grey shadings respectively for rainfall. White areas indicate equal chances for all categories in both cases. The baseline period is 1993–2009.