Note: Arrests through June 10. Location data was unavailable for some arrests, so some state totals may be undercounts. Numbers are rounded.
Immigration arrests have increased nationwide and more than doubled in 38 states in the months since President Trump took office, new data shows. Many states have seen even larger surges in enforcement activity in the last few weeks, after Mr. Trump’s top immigration adviser, Stephen Miller, demanded that agents make every effort to increase arrests.
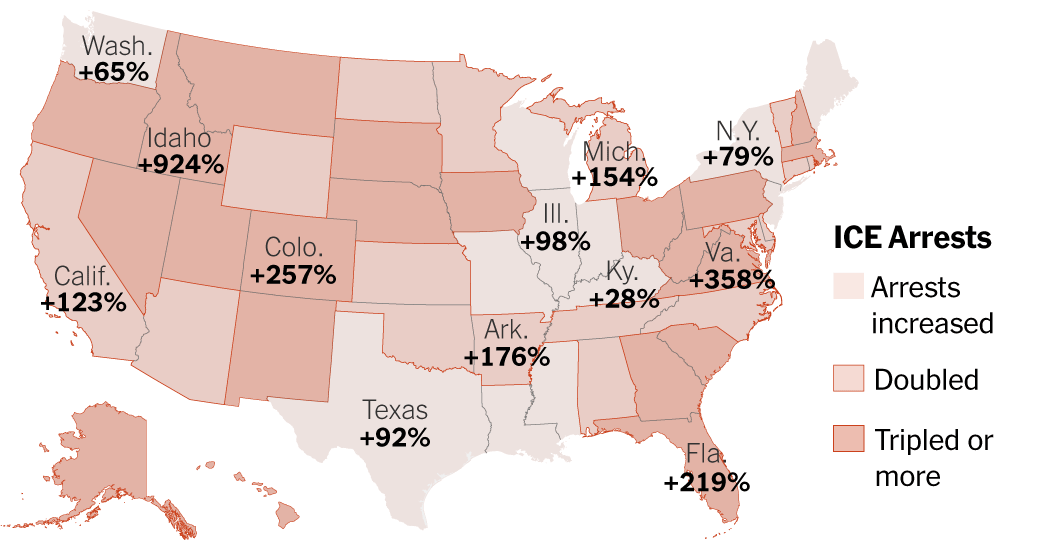
Immigration arrests increased in every state
Note: The map shows the change in daily average arrests from Jan. 20, when President Trump took office, through June 10, compared with the average daily rate in all of 2024.
Most of the arrests have occurred in states with large immigrant populations, including Florida and Texas, which also saw relatively high immigration enforcement under President Biden. Immigration and Customs Enforcement has arrested more than 20,000 people in Texas since Jan. 20, even as border crossings have slowed significantly. The agency’s Miami field office, which covers Florida and Puerto Rico, has also arrested more than 11,000 people.
Other states with large immigrant populations, like New Jersey and New York, have seen relatively modest increases compared with the previous administration. Some of the sharpest increases in arrests have come in states across the South and the West that are friendly to Mr. Trump’s immigration policies.
The data offers the clearest look yet at the pattern and pace of immigration enforcement activities in the United States under Mr. Trump. It was obtained through a Freedom of Information Act lawsuit by the Deportation Data Project at the law school at the University of California, Berkeley, and covers immigration arrests by ICE’s Enforcement and Removal Operations division.
It shows that immigration agents immediately went to work in January to pursue Mr. Trump’s goal of deporting millions of unauthorized immigrants. Since the beginning of his term, ICE has more than doubled its daily immigration arrest rate, averaging 666 immigration arrests per day, compared with fewer than 300 per day in 2024.
94,609 arrests since Jan. 20
Note: The chart shows the seven-day rolling average of the number of daily administrative arrests by ICE Enforcement and Removal Operations.
As the crackdown reaches new heights, it has been met with protests across the country, including tense clashes between protesters, local law enforcement and federal agents in Los Angeles earlier this month.
But the arrest rate may still not be high enough for Mr. Miller, the White House deputy chief of staff and the driving force behind much of the administration’s immigration policy. At a meeting on May 21 with leaders of ICE field offices, Mr. Miller set a target of 3,000 arrests per day. Arrests began to climb, and, in the first 10 days of June, the latest period the data covers, ICE made an average of more than 1,100 immigration arrests per day.
To reach that target, ICE has been pursuing more aggressive tactics like detaining immigrants at their routine check-ins, as well as at immigration court hearings. Many of those arrested in court have subsequently been fast-tracked for expedited removal, a quicker deportation process that denies them the chance to defend themselves in court.
At the end of 2024, about 5 percent of arrestees were processed through expedited removal. That shot up to 15 percent in June after the Trump administration stripped legal protections from many recently arrived migrants.
Immigration arrests by state
The pace of arrests has increased in every state compared with 2024. In 21 states and the District of Columbia, the pace has more than tripled.
Idaho, where the data shows ICE made 77 arrests last year, saw the biggest change. Since Jan. 20, ICE has made more than 300 arrests there, more than two per day on average.
Alabama, Arkansas, Mississippi and West Virginia have seen the fastest increase in ICE enforcement relative to the size of their immigrant populations. ICE has arrested more than 4,000 people in those states combined, compared with around 2,500 in the same span in 2024.
See how immigration enforcement has changed in each state:
142 avg. daily arrests since Jan. 20
64 avg. daily arrests since Jan. 20
41 avg. daily arrests since Jan. 20
23 avg. daily arrests since Jan. 20
20 avg. daily arrests since Jan. 20
20 avg. daily arrests since Jan. 20
20 avg. daily arrests since Jan. 20
19 avg. daily arrests since Jan. 20
18 avg. daily arrests since Jan. 20
16 avg. daily arrests since Jan. 20
13 avg. daily arrests since Jan. 20
12 avg. daily arrests since Jan. 20
11 avg. daily arrests since Jan. 20
11 avg. daily arrests since Jan. 20
11 avg. daily arrests since Jan. 20
11 avg. daily arrests since Jan. 20
9.7 avg. daily arrests since Jan. 20
9.7 avg. daily arrests since Jan. 20
9.6 avg. daily arrests since Jan. 20
9.3 avg. daily arrests since Jan. 20
8.3 avg. daily arrests since Jan. 20
7.9 avg. daily arrests since Jan. 20
7.0 avg. daily arrests since Jan. 20
6.7 avg. daily arrests since Jan. 20
6.7 avg. daily arrests since Jan. 20
6.6 avg. daily arrests since Jan. 20
6.6 avg. daily arrests since Jan. 20
5.7 avg. daily arrests since Jan. 20
5.2 avg. daily arrests since Jan. 20
5.2 avg. daily arrests since Jan. 20
4.4 avg. daily arrests since Jan. 20
4.3 avg. daily arrests since Jan. 20
3.0 avg. daily arrests since Jan. 20
3.0 avg. daily arrests since Jan. 20
2.4 avg. daily arrests since Jan. 20
2.1 avg. daily arrests since Jan. 20
1.7 avg. daily arrests since Jan. 20
1.7 avg. daily arrests since Jan. 20
1.7 avg. daily arrests since Jan. 20
1.6 avg. daily arrests since Jan. 20
1.2 avg. daily arrests since Jan. 20
1.1 avg. daily arrests since Jan. 20
0.8 avg. daily arrests since Jan. 20
0.8 avg. daily arrests since Jan. 20
0.7 avg. daily arrests since Jan. 20
0.6 avg. daily arrests since Jan. 20
0.5 avg. daily arrests since Jan. 20
0.3 avg. daily arrests since Jan. 20
0.2 avg. daily arrests since Jan. 20
0.2 avg. daily arrests since Jan. 20
0.1 avg. daily arrests since Jan. 20
About the data
Data for this article comes from the Deportation Data Project at the law school at the University of California, Berkeley, a repository of immigration enforcement data.
The data covers administrative arrests — arrests in which ICE is seeking to deport rather than criminally prosecute the arrestee — that were conducted by the agency’s Enforcement and Removal Operations division through June 10. It does not include criminal arrests, arrests by ICE’s Homeland Security Investigations division or arrests by Customs and Border Protection.
The data was filtered to remove likely duplicates and data that appeared to be invalid.
In some cases, data on the arrest location was not available. Where possible, the state where the arrest occurred was inferred from the ICE field office that conducted the arrest. For about 11 percent of the arrests, the location could not be identified and they are not included in the state totals.