Molecular identification of Trichoderma spp.PCR amplification, sequencing, and sequence analysis
Partial sequences of the translation elongation factor 1-alpha (tef1) gene, specifically including the fourth intron, and the second largest subunit of RNA polymerase II (rpb2) were successfully amplified using PCR and subsequently sequenced to enable accurate species identification of the Trichoderma isolates. Sequence analysis revealed that the isolates belonged to three species: Trichoderma harzianum, T. asperellum, and T. longibrachiatum. All obtained gene sequences were submitted to the NCBI GenBank database, and the corresponding accession numbers are listed in Table 3. Among the identified isolates, T. harzianum was the most predominant (23 isolates), followed by T. asperellum (6 isolates), and T. longibrachiatum (2 isolates).
Table 3 Molecular identification of Trichoderma isolates based on Tef1 and RPB2 gene sequencesPhylogenetic analysis
Sequences of both tef1 and rpb2 genes were aligned with reference sequences obtained from the NCBI database and used to construct phylogenetic trees. For the tef1 dataset, reference sequences of T. harzianum (OP026354), T. longibrachiatum (OP948263), and T. asperellum (MN329691) were used. For the rpb2 dataset, reference sequences included T. harzianum (OQ026376), T. longibrachiatum (OP410935), and T. asperellum (PP068268).
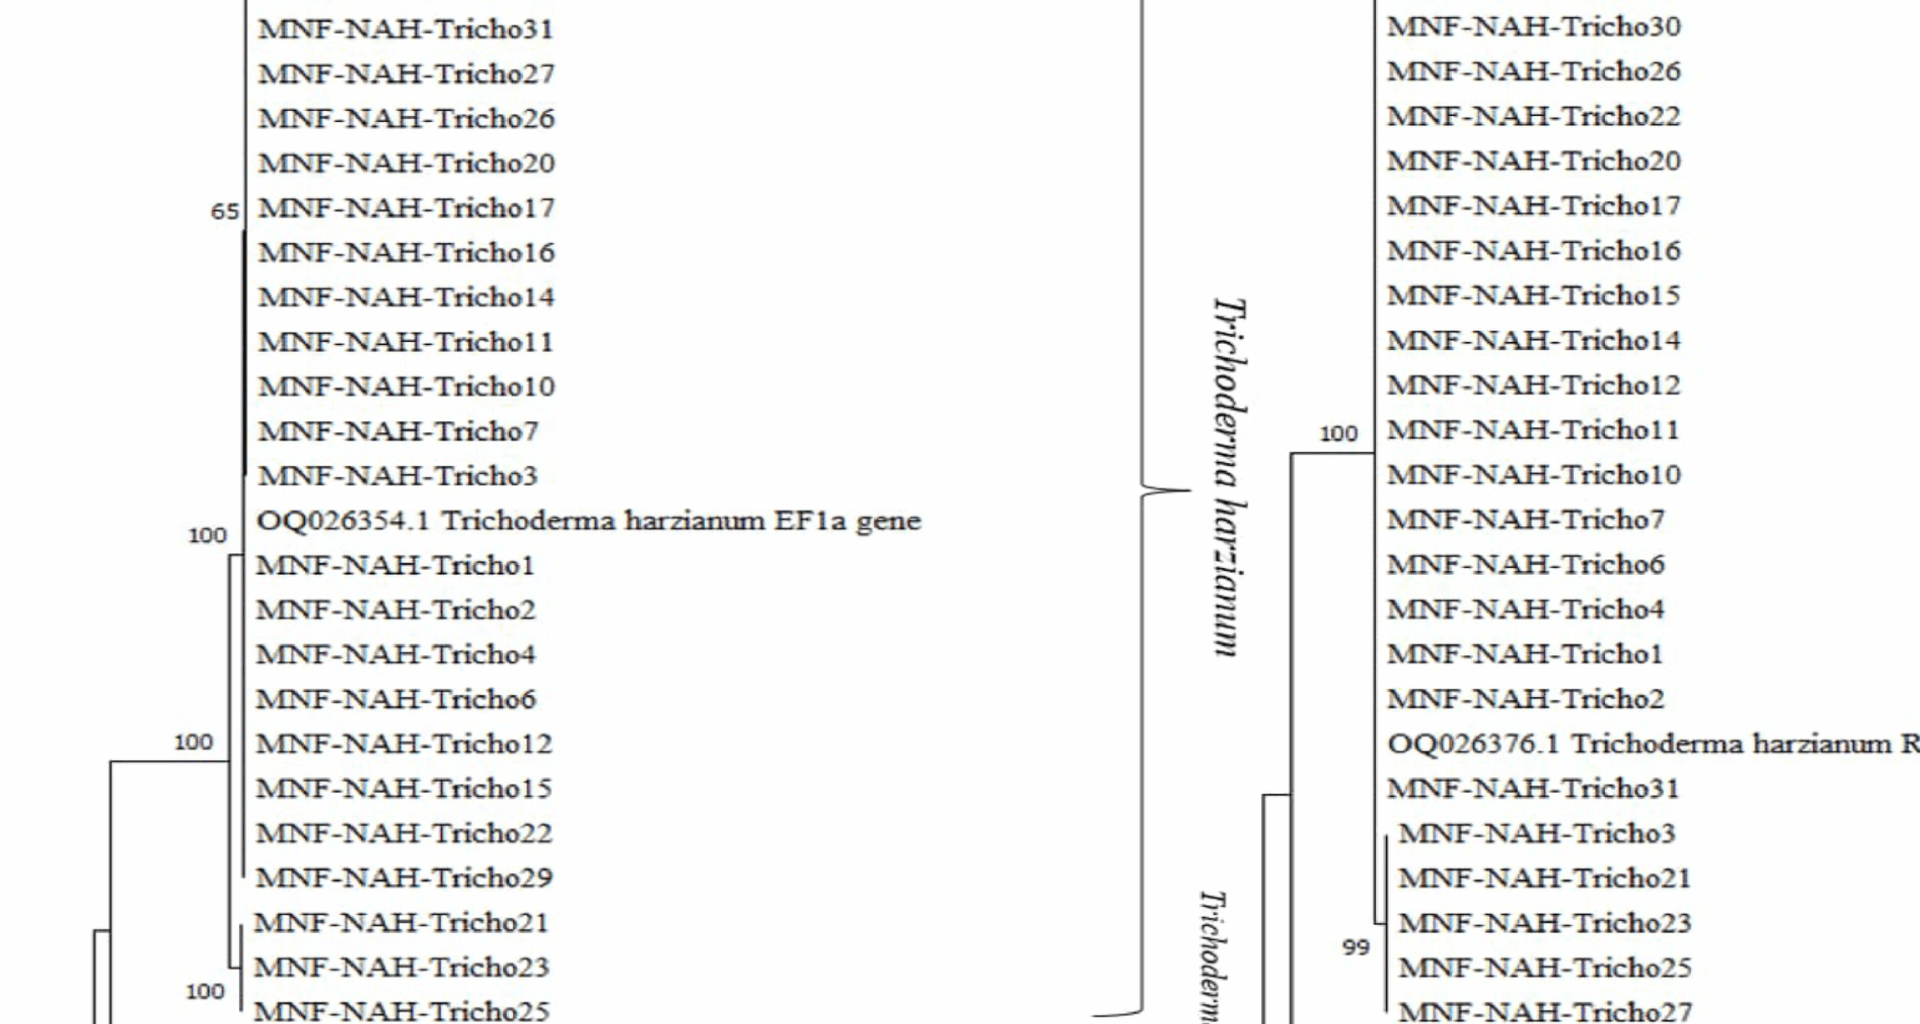
Figure 1 illustrates the phylogenetic relationships among the isolates. Bootstrap values were shown at each node to indicate statistical support. The initial trees for heuristic searches were constructed automatically using the Neighbor-Joining and BioNJ algorithms, based on pairwise distances estimated via the [27]. The final topology was selected based on the highest log-likelihood score.
The phylogenetic trees for both tef1 and rpb2 genes revealed that the isolates clustered into three well-supported, distinct clades, each corresponding to one of the three identified Trichoderma species.
Fig. 1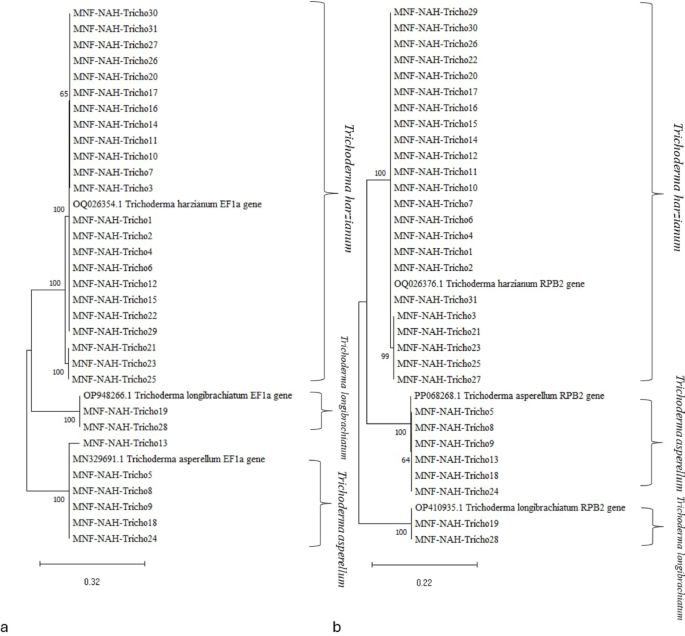
Phylogenetic trees showing the genetic diversity among 31 Trichoderma isolates based on DNA sequences of (a) translation elongation factor 1-alpha (tef1-α) and (b) RNA polymerase II second largest subunit (rpb2). Reference strains in each phylogram are denoted by their GenBank accession numbers. Bootstrap support values1,000 replicates) are presented next to the corresponding nodes
Biocontrol evaluation of Trichoderma sppQualitative chitinase activity
The chitinolytic potential of the Trichoderma isolates was evaluated using a detection medium containing bromocresol purple (BCP) dye at pH 4.7. After three days of incubation on colloidal chitin agar, the development of purple zones around the fungal colonies indicated enzymatic degradation of chitin and a subsequent localized increase in pH due to the release of N-acetylglucosamine. The size of these purple zones was measured as an indicator of qualitative chitinase activity (Fig. 2).
Fig. 2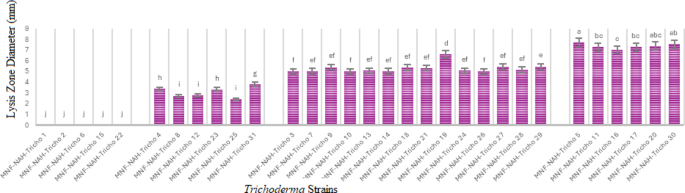
Qualitative chitinase activity: diameter of lysis purple-colored zone of Trichoderma strains on solid media. Superscript values indicate Duncan’s grouping means with the same letter are not significantly different. The data are presented as the mean ± standard error
Isolates exhibited varying levels of chitinolytic activity; high activity; MNF-NAH-Tricho5, -11, -16, -17, -20, and − 30; moderate activity; MNF-NAH-Tricho3, -7, -9, -10, -13, -14, -18, -19, -21, -24, -26, -27, -28, and − 29; Low activity; MNF-NAH-Tricho4, -8, -12, -23, -25, and − 31 and no detectable activity; MNF-NAH-Tricho1, -2, -6, -15, and − 22. These results indicate significant variation in chitinase production among the tested isolates.
Quantitative chitinase activity
To further assess chitinase production, quantitative assays were conducted by measuring the release of reducing sugars from colloidal chitin substrates. The concentration of N-acetylglucosamine (NAGA) released was determined using a standard calibration curve. Chitinase activity was expressed in terms of the amount of NAGA produced per milliliter.
All Trichoderma isolates exhibited measurable chitinolytic activity, although the levels varied substantially. The most active strains included MNF-NAH-Tricho5, MNF-NAH-Tricho30, MNF-NAH-Tricho7, MNF-NAH-Tricho24, MNF-NAH-Tricho26, MNF-NAH-Tricho27 and MNF-NAH-Tricho29. In contrast, MNF-NAH-Tricho16 and MNF-NAH-Tricho22 exhibited the lowest enzymatic activity (Fig. 3). The remaining isolates demonstrated intermediate activity levels.
Fig. 3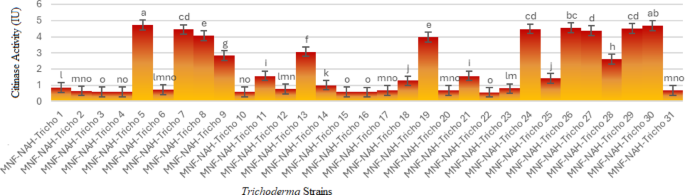
Quantitative chitinase activity: Superscript letters indicate Duncan’s grouping means with the same letter are not significantly different. The data are presented as the mean ± standard error
In vitro entomopathogenicity assay
Three highly active Trichoderma isolates MNF-NAH-Tricho5 (T. asperellum), MNF-NAH-Tricho30 (T. harzianum), and MNF-NAH-Tricho19 (T. longibrachiatum) were selected to evaluate their entomopathogenic potential against the cotton leafworm (Spodoptera littoralis). Two modes of application were tested: topical application and oral ingestion, using both spore suspensions and culture filtrates.
Larval mortality was monitored daily for 10 consecutive days. Visual symptoms of infection were observed under a stereomicroscope. Figure 4b and c illustrate parasitic interactions caused by Tricho5 and Tricho30 on days 5 and 6 post-treatment, respectively, while Fig. 4d and e describe hyphal colonization on larval bodies.
Fig. 4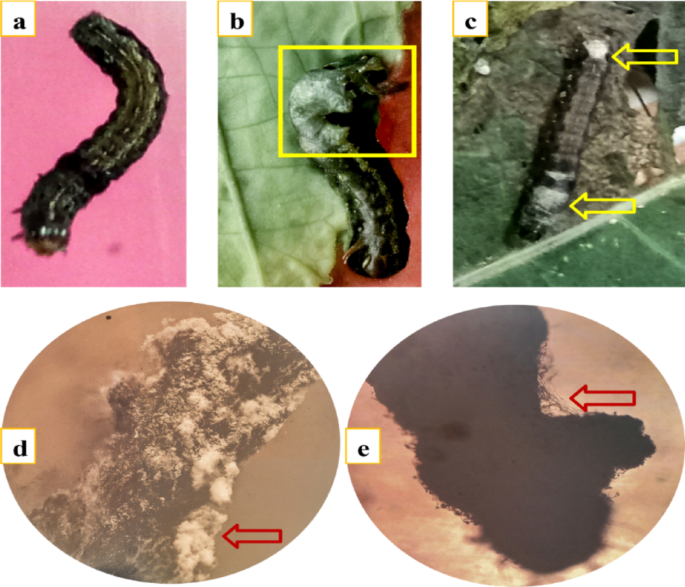
Parasitic effect of Trichoderma spp. on Spodoptera littoralis larvae. (a) Healthy, untreated larva; (b) colonization of larval body by Trichoderma asperellum (MNF-NAH-Tricho5), highlighted within the yellow box; (c) growth of Trichoderma harzianum (MNF-NAH-Tricho30) on the larval surface, indicated by yellow arrows; (d, e) stereomicroscope images showing extensive overgrowth of Trichoderma spp. on the larval body
A heatmap in Fig. 5 presents a comparative analysis of application methods, revealing that higher treatment concentrations generally resulted in increased mortality. Among treatments, the oral application of spore suspensions was the most effective. Figure 6 summarizes the 10-day average mortality rates, confirming that oral treatments outperformed topical applications, and spore suspensions were more effective than culture filtrates.
Fig. 5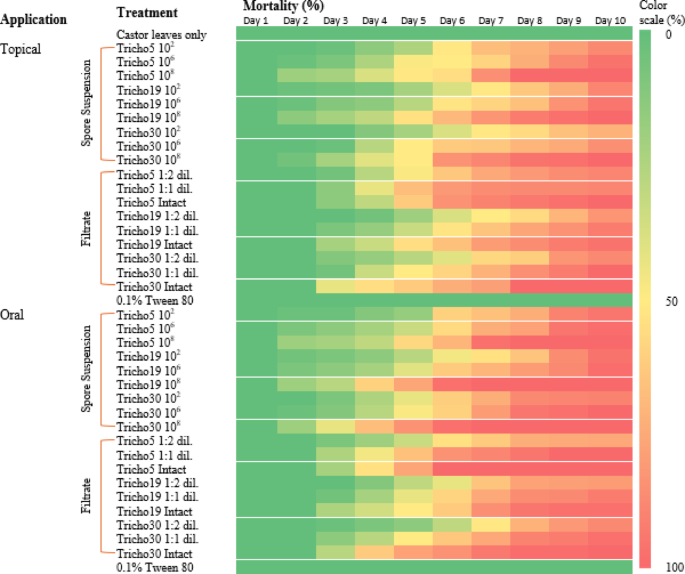
Heatmap illustrates the mortality percentage of cotton leafworm (S. littoralis) larvae induced by different Trichoderma spp. over ten consecutive days of post-treatment. Two application methods were compared. Color intensity corresponds to mortality rate, with higher intensity indicating increased larval mortality
Fig. 6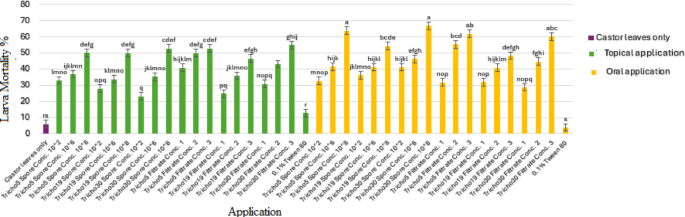
Average mortality percentage of cotton leafworm larvae (Spodoptera littoralis) induced by Trichoderma spp. using two different application methods over ten days post-treatment. Values represent the mean values of three replicates ± standard error (SE). According to Duncan’s multiple range test (P
Genetic improvement via interspecific protoplast fusion
To enhance biocontrol efficacy, two highly chitinolytic strains; MNF-NAH-Tricho5 (T. asperellum) and MNF-NAH-Tricho30 (T. harzianum) were selected for genetic improvement through interspecific protoplast fusion. The fusion process was conducted using an antifungal resistance-based selection strategy to distinguish parental strains from successful fusants.
Selection of antifungal markers
Each parent strain was tested for sensitivity to four antifungal agents Itraconazole, Fluconazole, Terbinafine, and Nystatin using concentration range. The tested concentration ranges were as follows: Nystatin (10–250 µg/mL), Terbinafine (8–250 µg/mL), Fluconazole (1–150 µg/mL), and Itraconazole (1–150 µg/mL).The minimum inhibitory concentrations (MICs) were determined as the lowest concentrations that completely inhibited fungal growth. MNF-NAH-Tricho5 was found to tolerate Nystatin up to 150 µg/ml, with complete growth inhibition at 200 µg/ml. Conversely, MNF-NAH-Tricho30 was susceptible to Terbinafine at concentrations ≥ 100 µg/ml. Based on these results, Terbinafine (150 µg/ml) and Nystatin (200 µg/ml) were selected as selective markers for MNF-NAH-Tricho5 and MNF-NAH-Tricho30, respectively.
Protoplast isolation and fusion
Protoplasts were generated from actively growing mycelia using a lytic enzyme mixture. Cell wall digestion initiated within one hour of incubation, and complete protoplast release occurred by three hours. The number of viable protoplasts was estimated at; 1.58 × 10⁶ protoplasts/ml for MNF-NAH-Tricho5; 1.79 × 10⁶ protoplasts/ml for MNF-NAH-Tricho30. Protoplast regeneration was conducted on PDA supplemented with Terbinafine and Nystatin, respectively. Viability assessments showed; MNF-NAH-Tricho5 79.8% viability on Terbinafine and MNF-NAH-Tricho30 82.5% viability on Nystatin (Table 4). The fusion of protoplasts was carried out using polyethylene glycol (PEG 6000) via a soft rolling method. The resulting fusants were initially selected on a medium containing 2% colloidal chitin and both antifungal markers. A total of 22 fusants were recovered.
Table 4 Number and viability of released protoplasts of Trichoderma strains grown on PDA medium supplemented with antifungal agentsFusant stabilization and designation
The fusants were sub-cultured for five successive generations on selective medium to assess genetic stability. Twenty stable fusants were obtained and designated as Fus1 through Fus20. Figure 7 demonstrates the major steps in protoplast isolation and fusion, while Fig. 8 presents the performance and resulting fusants.
Fig. 7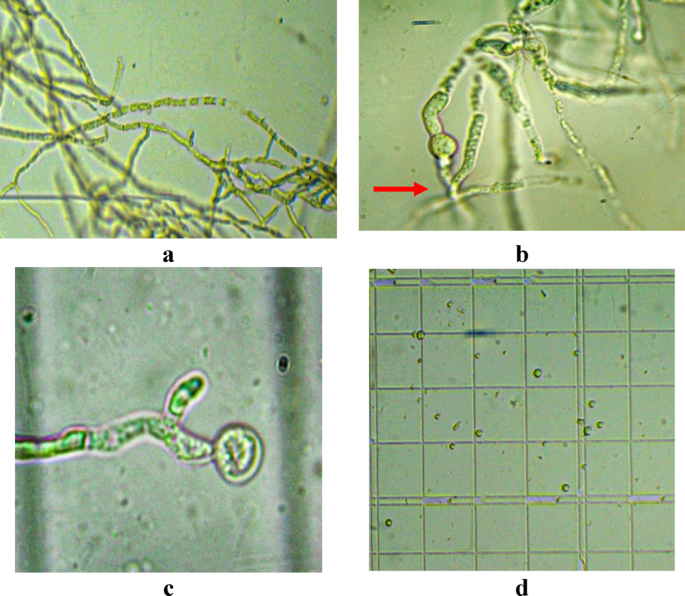
Protoplast isolation steps: a Lysis of cell wall, b Cell protoplast, c Protoplast release, d Free protoplasts
Fig. 8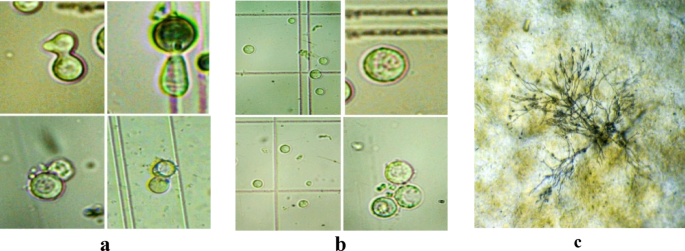
Protoplast fusion process. a fusion of protoplast, b fused protoplasts, and c germination of fused protoplast after 48 h of incubation on selection medium
Evaluation of fusantsChitinase activity in parental and fused Trichoderma strains
Both qualitative and quantitative analyses were performed to evaluate the chitinolytic potential of the 20 genetically stable fusants in comparison with their parental strains (T. asperellum MNF-NAH-Tricho5 and T. harzianum MNF-NAH-Tricho30). Table 5 summarizes the qualitative and quantitative results.
Table 5 Qualitative (lysis zone diameter) and quantitative assays (Units/ml) of total chitinase activity for fusants and their parental strains MNF-NAH-Tricho5 (P5) and MNF-NAH-Tricho30 (P30)
In the qualitative assay, all fusants except Fus2 and Fus9 exhibited increased chitinase activity relative to the parents. Among them, Fus7 showed the most extensive colloidal chitin degradation after three days of incubation, with improvement rates of 176.5% and 162.8% compared to MNF-NAH-Tricho5 (P5) and MNF-NAH-Tricho30 (P30), respectively. Fus8 and Fus3 also displayed substantial enhancements, with improvement rates of; Fus8 175.9% over P5 and 162.2% over P30 and Fus3 172% over P5 and 158.6% over P30. Conversely, Fus10 demonstrated chitinolytic activity similar to that of the parental strains.
Quantitative assays further supported these findings. Chitinase activity was expressed in units/ml based on N-acetylglucosamine (NAGA) release; Fus3 exhibited the highest activity at 5.14 units/ml, corresponding to an increase of 110.52% over P5 and 112.45% over P30. Fus8 followed closely, with activity improvements of 109.7% over P5 and 111.58% over P30. Fus7 showed enhancements of 107.27% and 109.15% compared to P5 and P30, respectively. Fus9 showed significantly reduced activity, indicating possible loss of function. Overall, fusants exhibited greater enhancement percentages in the qualitative assay, suggesting differences in sensitivity or detection thresholds between the two methods.
Entomopathogenic potential of parental and fused strainsIn vitro evaluation
To evaluate insecticidal potential, the top three chitinase-producing fusants (Fus3, Fus7, and Fus8) were tested against Spodoptera littoralis larvae in an oral bioassay. Each fusant, along with its respective parental strain and the previously tested MNF-NAH-Tricho19 (control), was applied to castor leaves and offered to larvae.
The fusants exhibited a faster onset of larval suppression compared to their parental strains. As shown in the heat map of Fig. 9, growth inhibition became evident by the third day post-treatment, with Fus8 showing early activity within 48 h, followed by Fus7. Peak larval mortality occurred between days 6–10 for most treatments, except for Fus8, which reached peak mortality on day 5. The chemical pesticide used as a positive control induced larval death as early as 24 h post-treatment. Figure 10 illustrates the mean mortality rates over the 10-day period; Fus8 achieved the highest mortality among the Trichoderma strains (approx. 74%), second only to chemical control. Fus3 and Fus7 recorded average mortalities of 61% and 64%, respectively. All fusants outperformed their parental strains in larval control efficacy.
Fig. 9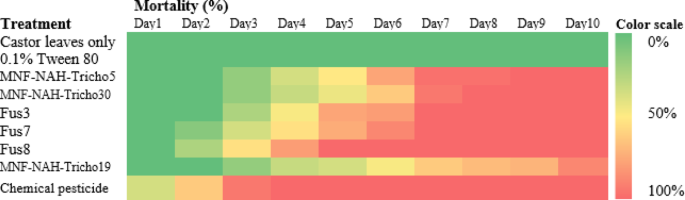
Heatmap of cotton leafworm larval mortality percentage induced by three selected fusants and their parental strains comparing between them by oral application method for ten consecutive days post treatment under laboratory conditions. MNF-NAH-Tricho19 and chemical pesticide were used as control. The color intensity representing application effect of Trichoderma strains on s. littoralis mortality, as the higher intensity color indicated the higher mortality percentage
Fig. 10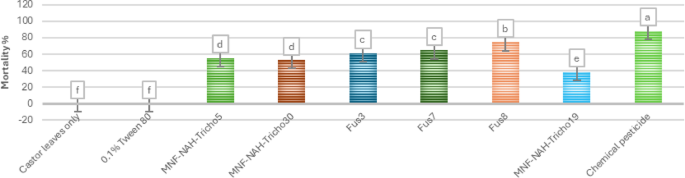
Average mortality percentages of cotton leafworm larva induced by three selected fusants and their parents of ten days after treatment. MNF-NAH-Tricho19 and chemical pesticide were used as control. Values are the means of three replicates. According to Duncan’s test (P
In vivo evaluation (Greenhouse Trial)
A greenhouse experiment was conducted to assess the efficacy of the selected fusants on cabbage plants infested with S. littoralis. The larvae were monitored for ten days following treatment.
As expected, the chemical pesticide produced the most rapid and pronounced larval suppression. However, the fusants also showed significantly improved performance relative to their parental strains; Fus8 triggered a noticeable decline in larval population within 72 h. Fus7 and Fus3 showed significant reductions by the fourth and fifth days, respectively. Figure 11 heatmap presents a heatmap of larval mortality over time, while Fig. 12 summarizes the average mortality across treatments; Fus8 again achieved the highest mortality among the biological treatments (about 62%), followed by Fus7 (42%) and Fus3 (41%). In contrast, the parental strains MNF-NAH-Tricho5 and MNF-NAH-Tricho30 induced only 31% and 33% mortality, respectively.
Fig. 11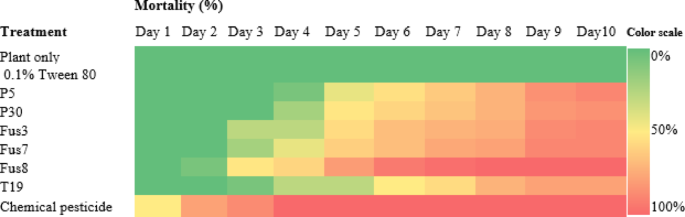
Heatmap of cotton leafworm larval mortality percentage induced by three selected fusants and their parental strains comparing between them by oral application method for ten consecutive days post treatment on cabbage plants under greenhouse conditions. MNF-NAH-Tricho19 and chemical pesticide were used as control. The color intensity representing application effect of Trichoderma strains on s. littoralis mortality, as the higher intensity color indicated the higher mortality percentage
Fig. 12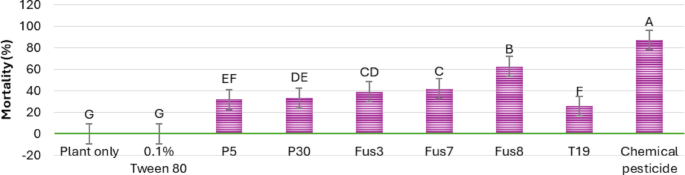
Average mortality percentages of cotton leafworm larva induced by three selected fusants and their parents of ten days after treatment. MNF-NAH-Tricho19 and chemical pesticide were used as control. Values are the means of three replicates. According to Duncan’s test (P
To assess indirect effects, an antifeedant assay was conducted. As shown in Fig. 13, Fus8-treated plants exhibited the highest antifeedant index (39%), indicating strong feeding deterrence. Other fusants and parent strains ranged from 28 to 32%. Figure 14 documents larval feeding damage, typically starting from lower leaves and progressing upward. Fus8-treated plants exhibited visibly enhanced vigor and reduced foliar damage (Fig. 14d), contrasting with the untreated control (Fig. 14a). This suggests a potential plant growth-promoting effect in addition to pest suppression.
Fig. 13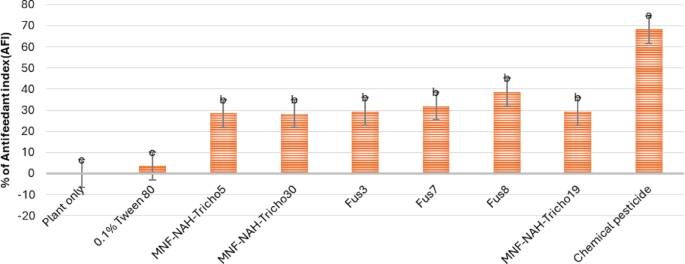
Antifeedant indexes of S. littoralis third-instar larvae exposed to various treatments of Trichoderma spore suspensions on cabbage ten days after treatment. MNF-NAH-Tricho19 and chemical pesticide were used as control. Values are the means of three replicates. According to Duncan’s test (P
Fig. 14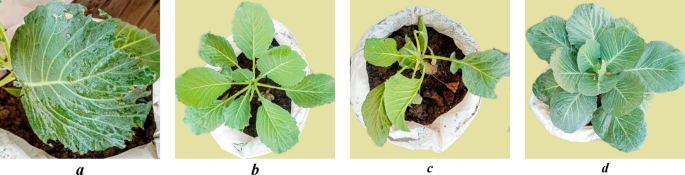
Cabbage treated with Trichoderma by oral application, a disease symptoms of cotton leafworm on cabbage leaves, b untreated cabbage plant, c infected cabbage plant with S. littoralis, and d treated cabbage plant with Fus8 and infected