
There are tons of estimates for how many houses America needs to build.
The U.S.Chamber of Commerce says we need 4.5 million. No, it’s 7.1 million, says the National Low Income Housing Coalition. Experts from the American Enterprise Institute (AEI) Housing Center guess it’s somewhere in between: 6 million homes.
These estimates aren’t just all over the place numbers-wise. They’re also geographically unspecific. If you’re lucky, an analyst might break down the nation’s housing needs by state. (Does PA need more homes than Jersey? What about Montana?) But they rarely break down needs by city, where the largest shortfalls tend to be. Nor do they look at what kinds of residences a particular municipality might be lacking. Does a city need more rentals? More high rises? What neighborhoods should these homes be in? This level of detail isn’t overly nitty-gritty. If you want to reverse the housing shortage, it’s essential.
“It’s one thing to know that the city needs X thousand housing units for people to own or Y thousand for people to rent, but it’s still another thing to know where,” says Ira Goldstein, senior advisor of policy solutions at the Reinvestment Fund, a community development financial institution based in Philly and Atlanta. “To be a really effective vehicle of public policy, it needs to have some spatial reference.”
A new tool might offer a solution. This year, the Philly-based analytics platform PolicyMap teamed up with Moody’s Analytics, the Reinvestment Fund and the nonprofit Urban Institute to create a census-tract level analysis of housing scarcity in 350 U.S. cities. The team working on H.O.M.E. (Housing Opportunities Made Easy), Mayor Cherelle Parker’s signature policy, began using the tool this summer.
It’s not just for public officials though. Anyone can log on to see where and what kinds of homes Philly needs. Developers can go online p to determine where and what kinds of projects to invest in. Ordinary citizens can check the annually updated map, see if the City is making progress and hold them accountable if they fail to reach their goals (and, even just to look for neighborhoods that might have housing in your price range).
Measuring the housing gap, tract-by-tract
PolicyMap is a public benefit corporation that collects private and public data from more than 170 sources and uses it to create maps to drive policy decisions. When their team created its housing shortage maps, they knew two things: They wanted to consider neighborhood-level shortages, and they wanted to use publicly available data, so the findings could be updated and replicable.
They determined census tracts would be the best approximation, though they don’t quite match what Philadelphians think of as neighborhoods (Fishtown contains parts of about three census tracts, for instance). But they are about the same geographic size. For data, they turned to the American Community Survey, a nationwide Census Bureau project that continually collects social, economic, housing and demographic data.
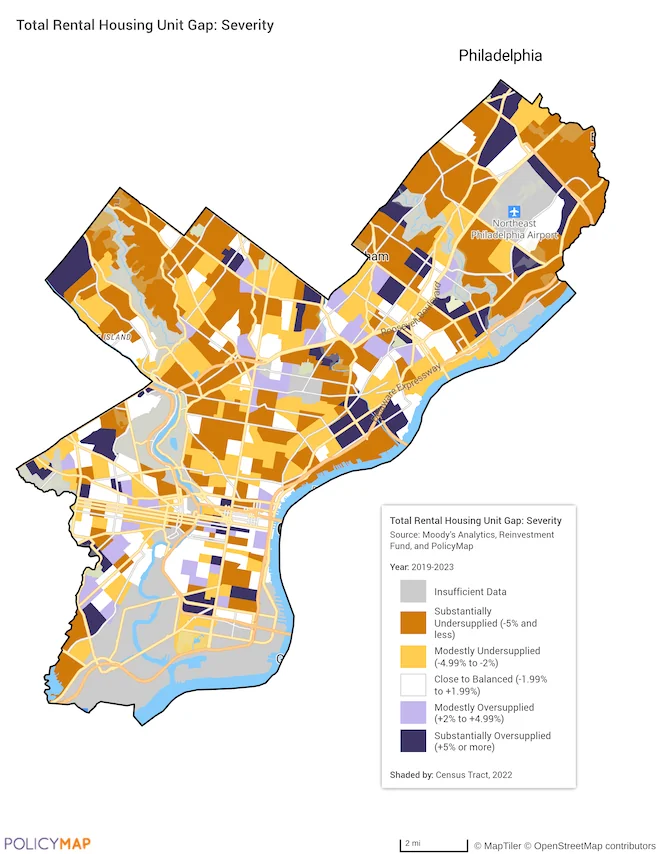 Total rental housing unit gap map, based on severity.
Once they determined those two things, “it was an easy lift … for us to load it and allow people to visualize it on maps,” says PolicyMap founder and CEO Maggie McCullough. “That’s very much in the wheelhouse of what PolicyMap does.”
There are two maps, one for rental units and one for owner-occupied units. Each map breaks down housing supply into five categories: substantially oversupplied, modestly oversupplied, close to balanced, modestly undersupplied and substantially undersupplied. Oversupplied means there is too much of a particular type of housing; undersupplied, too little. Grey indicates areas where there’s not enough data (some of Southwest Philly near the airport is grey). The rest is checkered in orange and purple, for undersupplied and oversupplied, respectively. It kind of makes Philly look like Memorial Stadium on game day at Clemson.
“I’m hoping that this kind of measurement can become more commonplace,” McCullough says. “This is a really good tool for figuring out where places really need more renter housing or more owner housing and which places are overbuilt, and they don’t need anything more right now.”
Where does Philly need housing?
One thing that surprised the team is that nationwide, “the need is much greater for renter units than it is for homeowner units,” says McCullough. That holds true in Philly too. The maps show that across areas where there are shortages, we need about 11,025 more rental units and 6,327 more owner units. Across areas that are oversupplied, we have an excess of 3,966 rental units and 1,515 owner units.
“A lot of the public discourse around the housing shortage conjures the image of, we need more single-family homes,” Goldstein says. “This analysis — whether or not you look at it at the county level, the state level, the national level, or down to the census tract level — emphasizes that a disproportionate share of the need is for rental housing.” (Rental housing in Philadelphia tends to mean apartments and, less frequently, rowhomes.)
A quick glance at the housing shortage maps and PHDC’s Land Management map show some overlap between available properties and high housing needs. Northeast and Northwest Philadelphia, for example, have a modest need for homes for purchase and a substantial need for rentals.
Many of the overages are in wealthy neighborhoods. Many shortages — particularly those for workforce housing, that which supports middle-income Philadelphians — are particularly pronounced around parts of the city like Brewerytown, Point Breeze and Fishtown that have been rapidly gentrifying. “Those places were starting to see a fair amount of construction, but it was not necessarily construction that was pointed at the economics of the people who lived there at that moment. It was construction that was really designed for people who are of higher income,” Goldstein says.
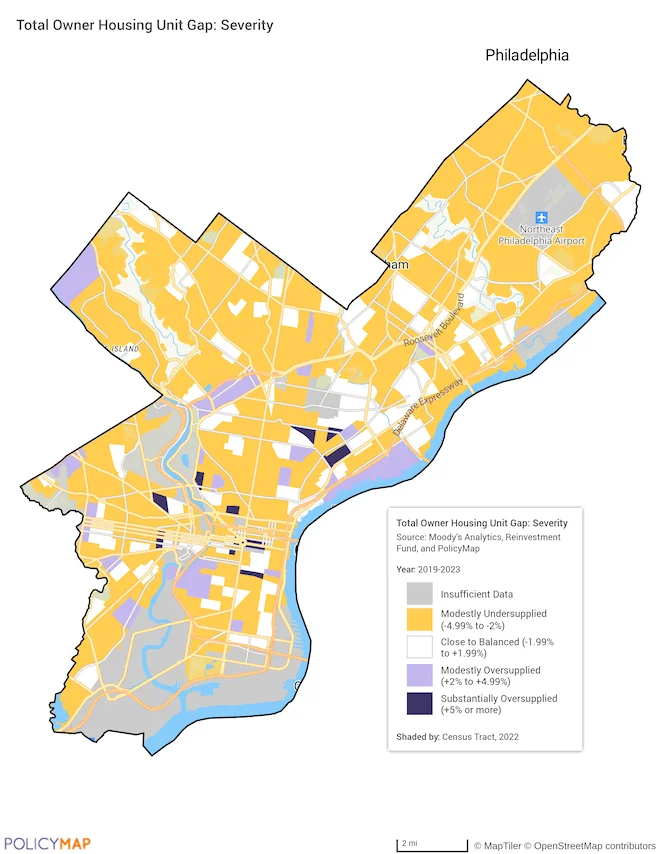 Total owner housing unit gap map, based on severity.
The Mayor’s housing plan defines workforce housing units as those that are affordable to people making $53,750 to $85,950 annually. Deeply affordable units are for those who earn less than $32,250 per year; affordable for earners between $32,250 and $53,750; workforce plus for $85,950 to $129,000; anything above that is market rate.
If a middle income earner can find only affordable or market rate units available for purchase or rent, they could end up occupying a low-cost unit that could have otherwise gone to someone with a lower income. But more likely they’ll end up housing cost-burdened — spending more than 30 percent of their income on rent. People could move to find more affordable housing — often what’s happening now in these gentrifying neighborhoods — but that frequently results in residential segregation and it can displace people from their long-standing communities.
“It’s important to address the full continuum to really address the housing crisis,” says Angela D. Brooks, the City’s new chief housing and urban development officer. “If you just pick one tier, it can bleed over to another.” Goldstein approached Brooks and the team working on H.O.M.E. about using Moody’s, Reinvestment Fund and PolicyMap’s data to set goals for the housing plan, which calls for building 13,500 new units and preserving 16,500.
“When I was in Chicago, I was living in a naturally [occuring] affordable housing unit. I could have afforded more, but I was like, why would I pay that much for rent?” Brooks says, “If you have somebody like me sitting in that unit, I’m a cog in the wheel. It was a very humbling reminder to myself about why we really have to address the full housing continuum.”
Driving policy
Using data to drive housing policy isn’t new. The Kenney administration used a mix of American Communities Survey data, building permitting data from the Department of Licenses and Inspections (L&I) and PolicyMap, Assessment of Fair Housing data and other sources to craft its 2018 housing plan, which set goals for how many housing units the City wanted to build or preserve, but did not set specific goals for specific neighborhoods.
H.O.M.E. is still in its early implementation phase, but the City is considering how it can help them foster more targeted development based on the needs of specific neighborhoods. They used the data from Moody’s, PolicyMap and the Reinvestment Fund to set the unit goals for how many rental vs. owned homes to build and at what income levels. The maps helped Brooks visualize where there are gaps in Philly’s housing ecosystem.
The next step is to compare findings to recently-issued building permits and certificates of occupancy to see if new development projects are addressing any of the gaps, since they use data from 2023. Then, the City can determine what gaps they want to address with their own projects and incentive programs. They also plan to compare the maps to City-owned land parcels to determine where they should be building, what kinds of units those areas need and where they should acquire land for building projects. Over the years, they plan to use refreshed data from the maps to track progress and make adjustments to their efforts — so that they can achieve the goals outlined in H.O.M.E.
“I call [it] a living, breathing document. We don’t want it to be a plan that sits on a shelf like, I shall not be moved,” Brooks says.
Such thinking is in line with the map’s creators’ intentions. But already housing advocates worry H.O.M.E. isn’t doing enough for deeply affordable housing (the City has other plans that tackle this as well). Others are concerned that the City has been revising its targets for creating more housing through H.O.M.E. and that the plan could be hampered by inflation, federal cuts and labor shortages.
Here, the maps can also help. As the maps are accessible to not just city officials, developers can use them to plan their own projects. Housing advocates monitor them to make sure the City is actually meeting its goals. And if you’re looking for a home in your price range? Well, you might want to log on to see the best neighborhoods to start your search.
![]() MORE ON SOLVING PHILADELPHIA’S HOUSING SHORTAGE
MORE ON SOLVING PHILADELPHIA’S HOUSING SHORTAGE