The votes for the seasonal MLB awards are due before the first pitches in the Wild Card series on Tuesday. That makes sense because the Most Valuable Player and Cy Young awards are regular season awards, rewarding players for their excellence that they put together over six months.
But then the playoffs start. And it certainly seems like a regular occurrence to find that the consensus best hitters and pitchers in the game go on to struggle in October. Is it true? Do the eventual award winners have a hard time in the playoffs?
Thanks to STATS Perform, we were able to accrue the postseason results for the last 20 years worth of Cy Young and MVP winners, and it looks like our eyes are not failing us. There’s a large gap between regular-season excellence at the very top and their postseason numbers. A stark one if you sum it up this way:
Cy Youngs and MVPs in the playoffs
Reg. Season
0.323
0.408
0.597
Postseason
0.247
0.356
0.451
CY Youngs
ERA
K%
BB%
Reg. Season
2.51
27.8%
5.1%
Postseason
4.23
28.1%
8.2%
Oh no, we’ve uncovered a new hex. The Curse of the Cy, The Malediction of the MVP. Book it: the best players will be terrible this postseason. Enjoy them while they last because in three days they’ll all turn into pumpkins in time for Halloween.
Obviously that’s being facetious, but these numbers still exist. Why? Let’s run through some potential reasons.
Unclutch
A “lack of the clutch gene” can’t be the answer. Could a hitter really run all through the regular season and demolish the opposition and then shrink under the biggest lights?
The research on “clutch” is fairly conclusive, at least the way it’s been done so far. If you define clutch as how a hitter does in late-and-close situations versus how they do in other situations, it’s not a skill that hitters repeat from year to year. Check out the 2024 leaders in the Clutch statistic on FanGraphs and how they fared in 2025:
There is pretty much no relationship year to year, and even over a five-year timeframe the list doesn’t seem to make a ton of sense intuitively.
Then there’s just the sheer volume of Hall of Famers who weren’t good in the postseason: Vladimir Guerrero Sr., Craig Biggio, Jackie Robinson, Mike Piazza, Phil Rizzuto, Joe Morgan, Wade Boggs, Joe DiMaggio and Gil Hodges were all below-average hitters in the postseason, not to mention the many more who didn’t live up to their regular season numbers. Won’t be me telling Mike Schmidt he was unclutch.
Fatigue
If you’re going to win the Cy Young or the MVP, you’re going to have to play most of the season. The Cy Young winners in our sample averaged 194 regular-season innings, and while that’s skewed a little by bigger starter workloads earlier this century, it’s also a number that fewer than 10 pitchers will surpass this season. It’s certainly possible that even a young Justin Verlander in 2011 was fatigued after throwing a career-high 251 innings before he went and put up an ERA over five in the playoffs that year.
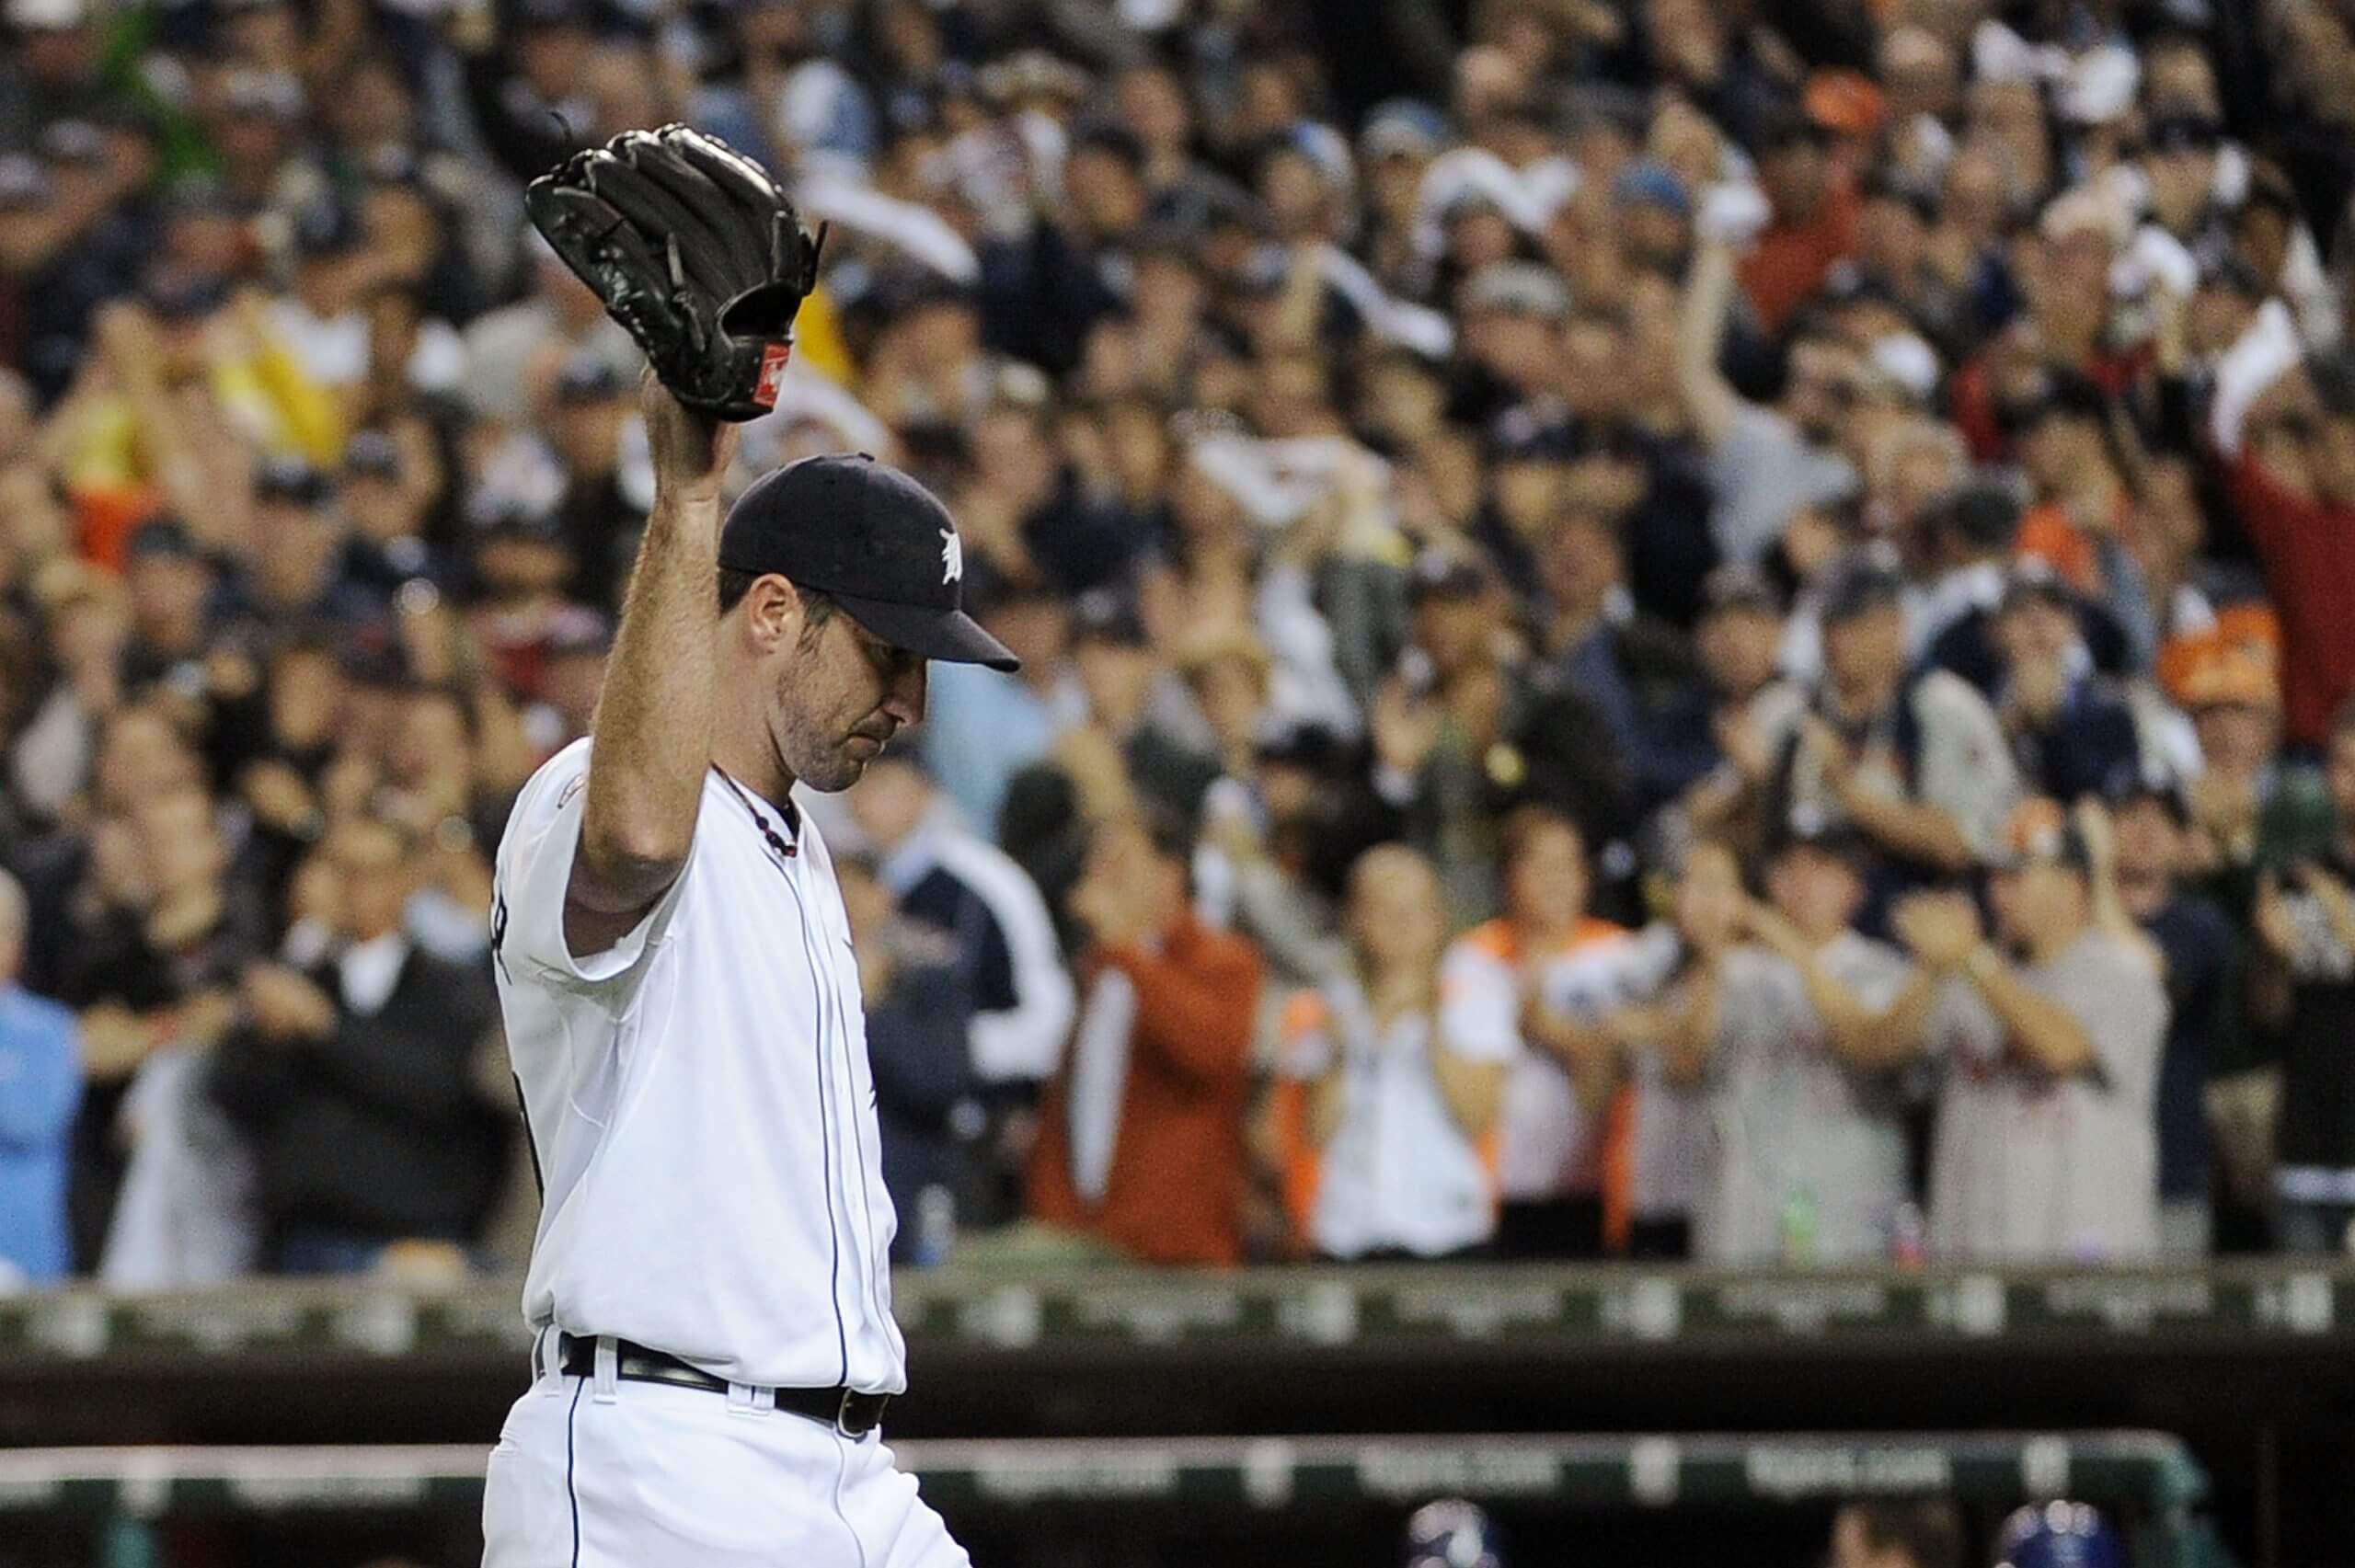
Verlander may have been wiped by the time the 2011 postseason rolled around. (Harry How / Getty Images)
Hitters may suffer from this malady, too. On average, hitters have had 649 plate appearances in their MVP seasons. Last year, 37 players had 650 or more plate appearances, a number that represents less than 6 percent of all the players who took a plate appearance. Dominate the league all year like Mookie Betts and Christian Yelich did in 2018, and maybe it’s not super surprising to see that their collective batting averages sat around .200 during those playoffs after so many at-bats.
But there’s something unsatisfactory about this explanation. Everyone’s tired in October. Catchers, for example, see more of a downturn in performance in October than any other position, presumably because all that squatting catches up to them. If everyone’s tired, then that should change the baseline enough for the MVPs to still shine. A tired MVP is still an MVP among a bunch of tired players.
Better competition
This reason certainly rings true. The average fastball in the postseason was a mile per hour faster than it was during the regular season last year, and these days that means the average postseason fastball is pushing towards 96 mph. And it’s not just velocity: the average fastball in the postseason has an inch more ride. Generally, hitters are seeing better stuff in the postseason than they faced all year, and that’s going to impact their numbers.
On the pitching side, the opposite also holds — pitchers are obviously going to face better hitters. Last year, only two teams of the 12 that made the postseason had below-average lines from their hitters, and that’s about the normal ratio in a given playoff year. There’s no getting fat on the Pirates or White Sox in the postseason if that’s how you racked up your regular-season credentials.
Both the Cy Young and MVP winners fared worse in the postseason, so it’s certainly possible that the higher quality competition is the main reason those stars falter. But here’s why it’s not enough: On the aggregate, the postseason ERA over this timeframe was 3.82 and hitters hit .236/.310/.389 — meaning that the Cy Young pitchers together were worse than postseason average, while the MVPs collectively were still better, but not as good as they were in the regular season.
Luck
Nobody likes luck as the explanation for the difference in performance, but it’s the most likely reason, and it helps explain some of the quirks we’ve hit along the way. Twenty years of award winners seems like a big sample — we’re talking 306 innings pitched in the postseason, and over 1,100 plate appearances. Isn’t that a lot? Not really, not when you’re talking about 40 different players, split over 20 different postseasons. It’s a collection of a lot of small samples, not really a big sample.
If we’re talking about Buster Posey hitting .200 in the 2012 playoffs, or Shohei Ohtani hitting .230 last postseason, we’re missing some context, like Posey catching all year, or Ohtani’s shoulder injury. When we count up Joey Votto, Mike Trout, Josh Hamilton and Cody Bellinger and say that they were bad in the postseason and contributed to this poor MVP line, we’re also taking four players who had a combined 115 plate appearances and treating that sample as if it was one number produced by a monolithic “MVP” instead of a collection of small samples that could be affected by all sorts of randomness.
Here’s another way of saying it: It takes some luck to win the hardware in the first place. We’re awarding the best players, but even those players have good years and then great years. The fact that the strikeout and walk rates for the Cy Young winners in the regular season and postseason are so similar points to some noise in their postseason ERAs. The batting average on balls in play every year in the league is between .285 and .300, and that’s true over our sample in the postseason, too. But our Cy Young winners had a collective .264 BABIP in their award-winning years, and our MVP winners had .341 BABIPs of their own. Maybe some of their regular-season luck ran out when it came to October.
Perhaps none of these explanations is satisfying by itself, but somewhere in there is an answer. While there’s no guarantee that being the best hitter or pitcher in the league means regression in the postseason — we’ve had stellar playoff runs from Roy Halladay, Max Scherzer, Chris Carpenter, Kris Bryant, Freddie Freeman and Ryan Braun in the past — the pattern suggests that maybe all that heavy lifting during the regular season takes its toll in October.
(Top photo: Kevin C. Cox / Getty Images)