The 2025 season is more than half over. If you were hoping to know what kind of team the Giants were more than 80 games into the season, you’re almost certainly still confused. It’s been a tale of two teams. It was the best of teams, it was the worst of teams, it was the age of wisdom, it was the age of foolishness. And the foolishness was super foolish. They’re befuddling the dickens out of us.
In these confusing times, it’s nice to have something definitive to grab onto. So for this first-half recap of Giants statistics, we’re going to look only at the stats where the team or an individual is either first or dead last in the National League or the majors. There’s nowhere to go but up or down in these categories, for better or for worse.
We’ll start with the “for better” because you need a break.
Except this article will be about the hitters. Break over. (Stats as of July 1.)
They’re tied with the Dodgers in this category, which must mean they’re having very similar offensive seasons. I’ll have to look into that later.
This is not your typical underperforming lineup. The 2025 Giants are getting more gifts from opposing pitchers than any other team, but they’re not converting them into as many runs as they should be. Still, it’s not like you’re going to pretend this is a bad stat. The Giants are really good at drawing walks, which gives them more baserunners and increases their chances of scoring. Compare this year’s lineup with one of my least favorite groups of hitters to reminisce about, the 2009 Giants. That team was so impatient that Pablo Sandoval led them in walks. Pablo Sandoval!
Taking walks isn’t a problem for the Giants this season. Hitting the ball is the problem.
Your first reaction is to think that it’s bad for a team to be last in the league in this stat. You might think that the whole point of a hitter is to hit the ball hard, which would mean it’s bad to be so low on a ranking of “hard hits.”
You might think that, alright. So you’ll be surprised to know that it’s actually very bad.
The Giants are making quieter contact than any team in the league. Rafael Devers will help with the overall numbers by the end of the season, as will a healthy Matt Chapman, but it’s just not a lineup that lights up the radar gun.
Go back to the Giants having a great walk rate. That should help them make better contact, in theory. By not swinging at pitches that are difficult to hit hard, Giants hitters are giving themselves a better chance to do more damage on the easier pitches to hit. In theory. The Giants aren’t making that kind of loud contact, though, which is limiting the usefulness of the walks. We can turn it into a baseball truism: Most good lineups draw walks; not all lineups that draw walks are good.
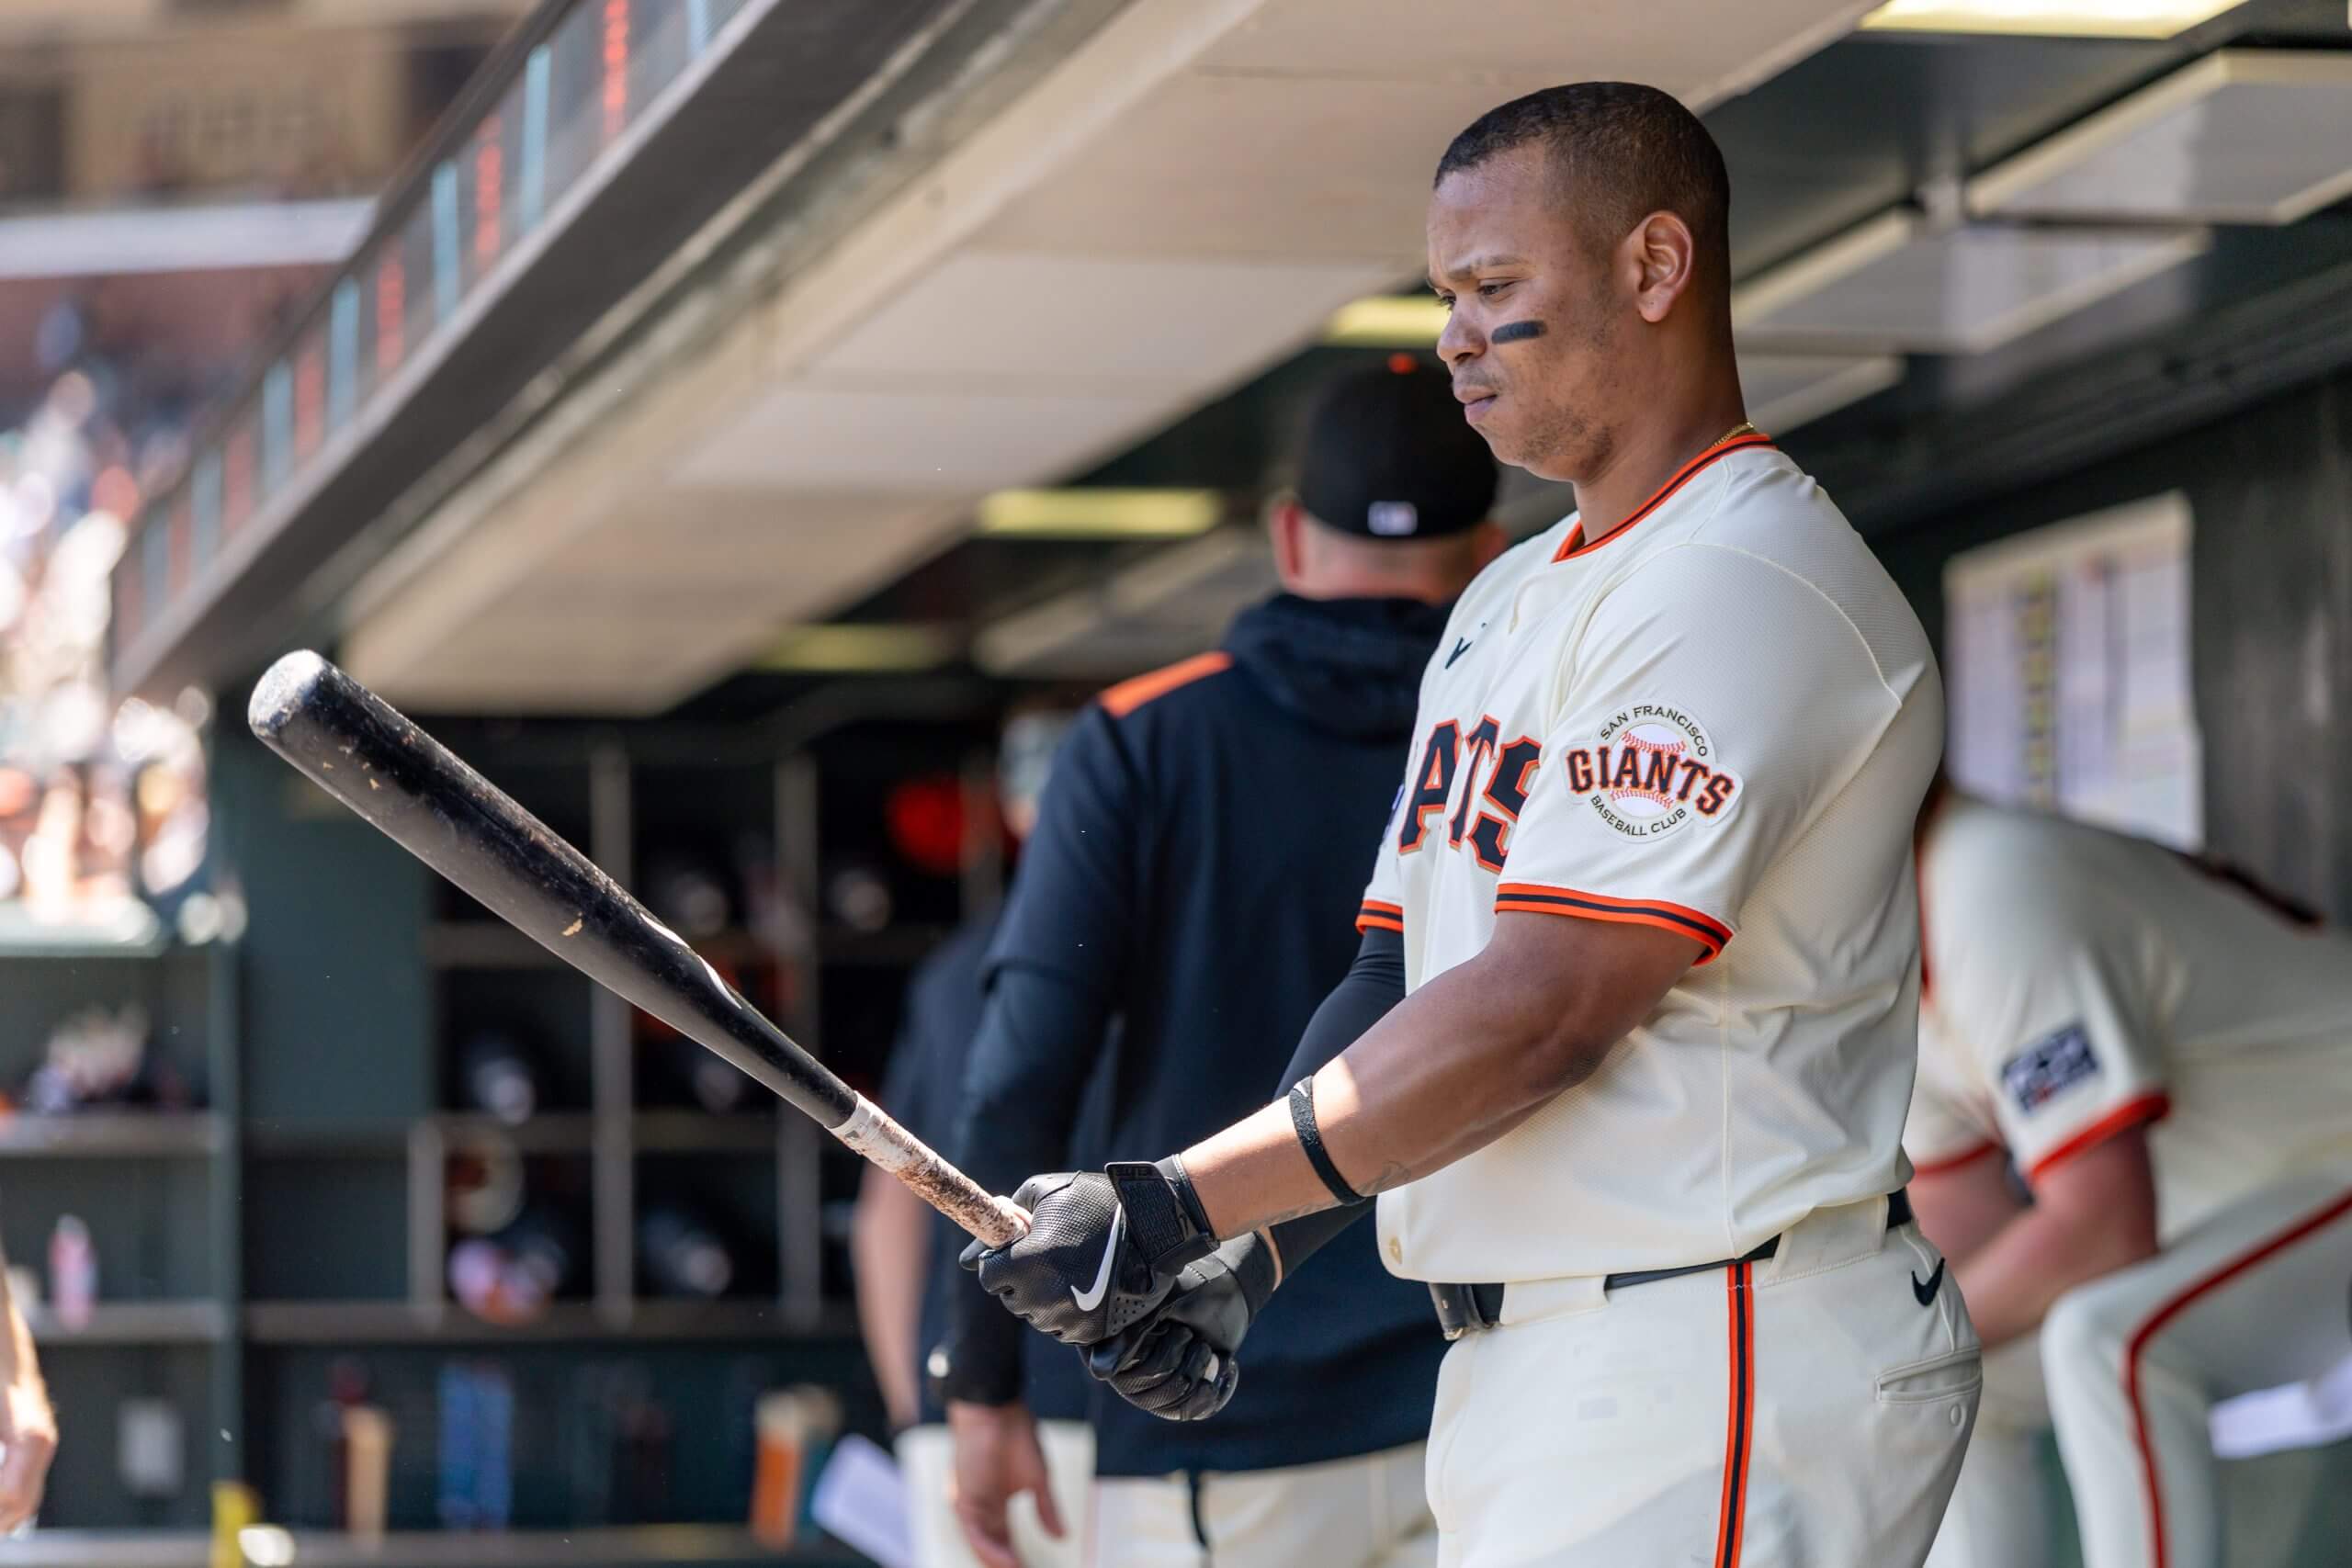
The addition of Devers should, in theory, improve the Giants’ standing in several of these categories. (Bob Kupbens / Imagn Images)
There are a lot of ways to hit a baseball, and some hitters swing their bats harder than others. It doesn’t correlate perfectly with success, and it’s possible to be a great hitter with merely average bat speed.
Still, if you’re looking for a way to explain why the team’s exit velocity is so low, this will help. The Giants aren’t hitting the ball hard because they aren’t swinging their bats hard. Physics, you rascal, you’ve screwed everything up again.
Before the Statcast revolution, this would all feel correct, but there wasn’t any way to verify it. It was maddening. This is so much better. It’s especially helpful when it comes to evaluating the Giants, too, because you don’t have to adjust for the ballpark. The marine layer will suffocate a fly ball before it leaves the yard, but it won’t do much an inch away from where the batter makes contact.
The Giants hit fewer line drives than everyone else. If you remember only one sentence from this article, make it that last one.
Another thing we used to do in the olden days was point at BABIP and say, “There’s your problem,” like a gas station mechanic. It was so easy to use it to explain everything you didn’t have an answer for. If this were 2005, I might have written a column about how the Giants’ offensive struggles aren’t due to being bad. They’re just unlucky. Their BABIP is all out of whack.
The Statcast revolution got rid of that, too. The Giants have the lowest BABIP because they’re not hitting the ball hard. It’s not luck, or lack thereof. When you look at expected batting average, they’re right where they should be. Their grounders are just a little less likely to find a hole. Their fly balls are just a little less likely to find a gap. All the miles per hour that are missing from the team’s exit velocity are translating directly into baseballs nestled safely in opponents’ gloves.
I’m not smart enough to know if this is inherently bad. But it doesn’t feel great. On the surface, it seems like pitchers are more willing to challenge the Giants with fastballs compared to other lineups.
Oracle Park could explain a lot of this, though. The homer-unfriendly ballpark is a heckuva safety net for any pitcher who needs to get back in the zone with a fastball, so this stat is probably less about the Giants’ lineup and more about the park itself.
It could be both, too. Maybe there’s a stat that can tell us the Giants are the worst-hitting team in the majors against fastballs.
Son of a …
Look at the teams that are keeping company with the Giants in this category: the White Sox, Guardians, Pirates, Rockies, et al. It’s a who’s who of ineffective lineups. Maybe collective performance against fastballs is a good proxy for a team’s overall offensive health. If a team is struggling against fastballs, they’re probably just struggling.
Again, Devers should help considerably. So will Chapman, when he’s back in the lineup. Also, all these stats reflect contributions from players who aren’t on the roster anymore, so keep that in mind.
I didn’t set out to write an ultra-depressing article. Just kinda happened. So, uh, do we have any frivolous or fun stats to lighten the mood?
There we go. When the game is on the line, it’s Christian Koss time. Just like everyone was expecting before the season.
This isn’t a predictive stat, and I’m not sure if it has any meaning other than “that happened,” but it’s a fun one. Leverage index is a stat that considers the inning, the score, the number of outs, et cetera, and spits out a number. The higher the number, the tighter the situation. And according to this stat, nobody is having more plate appearances in big spots than Koss.
And if you want to end on some good news, here you go: Koss has been thriving in these high-leverage situations. The Giants are setting the table with walks, and then they’re letting Koss drive them in with some medium-hard (but not hard) contact. A strategy as old as the game itself.
Next time, we’ll look at the extreme statistics for the pitchers, which promises to be much more fun.
(Top photo of Ramos: Chris Coduto / Getty Images)