Design and synthesis of Au-Ni AR photocatalysts
The gold-nickel (Au-Ni) heterostructure was selected as the AR plasmonic photocatalyst, consisting of an Au nanoparticle as the antenna and a Ni nanoparticle as the reactor (Fig. 1a). Au, a typical plasmonic metal, is renowned for its excellent light trapping ability and unique resonance excitation properties, while Ni is widely used as an active phase in various industrial catalytic processes due to its exceptional ability to activate reactant molecules28,29,30. As a consequence of the difference in work function between Au and Ni, the formation of the Au-Ni heterostructure leads to electron transfer from Au to Ni31. Upon illumination, a significant number of high-energy hot electrons are generated within the Au nanoparticles, resulting in the energy band of Au to bend upward, which facilitates further electron transfer from Au to Ni (Fig. 1b).
Fig. 1: Theoretical basis for electron transfer in Au-Ni heterostructure.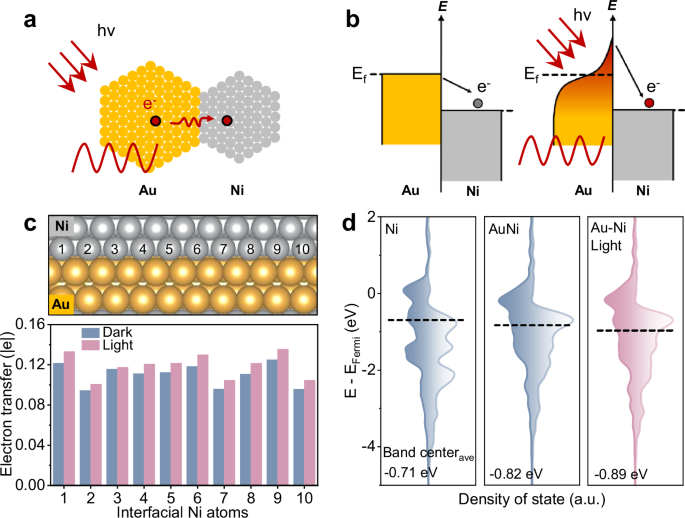
a Schematic diagram of Au-Ni AR photocatalyst. b Electronic band structure of typical plasmonic metal Au and catalytic metal Ni. c Computational model of Au-Ni heterostructure and Bader charge analysis of Ni in Au-Ni heterostructure. d DFT-calculated PDOS of active Ni site of Ni and Au-Ni. Source data are provided as a Source data file.
This mechanism was further supported by theoretical calculations. As shown in Fig. 1c and Supplementary Fig. S1, Bader charge analysis of the interfacial Ni atoms in Au-Ni heterostructure was performed to quantify the extent of electron transfer from Au to Ni. In contrast to the Ni atoms in the Ni nanoparticle, those Ni atoms adjacent to the Au nanoparticles exhibited an electron-rich state due to the redistribution of electrons induced by the Au-Ni heterostructure. As also expected, the electron-rich state of the interfacial Ni atoms was further enhanced under illumination due to the resonant hot-electron excitation of Au nanoparticles. Additionally, the position of the Ni d-band center in the Au-Ni heterostructure shifted to lower energy compared to the Ni nanoparticle, with this shift becoming more pronounced under illumination, as revealed by the projected density of states (PDOS) results (Fig. 1d and Supplementary Fig. S2). These changes in the d-band center of Ni atoms were directly attributed to the Au-Ni heterojunction structure and the illumination-induced electron transfer from Au to Ni. Notably, the light-induced electron-rich Ni sites in the Au-Ni heterostructure will significantly alter the adsorption and desorption behavior of key intermediate species during the catalytic process, thereby affecting catalytic performance32,33.
A one-step synthesis method was employed to prepare Au-Ni heterostructures, taking advantage of the difference in nucleation temperatures between gold and nickel. At lower temperatures, chloroauric acid (HAuCl4) decomposed, leading to the formation of Au nanoparticles (NPs) (Fig. 2a). As the temperature increased, nickel acetylacetonate gradually decomposed to form Ni clusters, which then underwent epitaxial growth on the surface of the Au NPs, ultimately forming the Au-Ni heterostructure. As shown in Fig. 2b, c, it is observed that each Au particle was coated with a layer of ~8 nm of Ni on one side, creating a half-coated heterojunction structure with an average size of ~20 nm. To enhance the thermal stability of this heterostructure and isolate the coupling between particles as well as charge transfer, a ~ 10 nm thick silica (SiO2) layer was encapsulated on the surface of the Au-Ni heterostructure, denoted as AuNi@SiO2 (Fig. 2d and Supplementary Fig. S3–5). Despite slight etching of the Ni particles during the SiO2 coating process, the Au-Ni heterostructure was preserved after calcination in a H2 atmosphere at 350 °C, highlighting the protective effect of the SiO2 layer in suppressing sintering and aggregation of the nanoparticles (Supplementary Fig. S6–7). It should be noted that the SiO2 shell was permeable to gaseous reactants and products and did not affect the intrinsic catalytic performance of the catalysts34,35. Moreover, since TEM images are 3D projections of the sample, some particles appear to be fully coated in Fig. 2d. TEM images at multiple tilt angles ranging from −30° to +30° were carried out for the observation of particle morphology, which consistently support the asymmetric, half-coated morphology of Ni on Au nanoparticles (Supplementary Fig. S8). Furthermore, energy dispersive spectrometry (EDS) elemental mapping provided a more detailed visual representation of this distinctive structure, showing that both Au and Ni were independently distributed at the ends of the Au-Ni heterostructure, while the Si element was present in the outer layer (Fig. 2e-h). Meanwhile, the XRD patterns showed only diffraction peaks corresponding to metallic Au and Ni (Supplementary Fig. S9–12). These results suggest that the AuNi@SiO2 AR photocatalyst has been successfully prepared with excellent thermal stability.
Fig. 2: Structural characterization of the catalyst.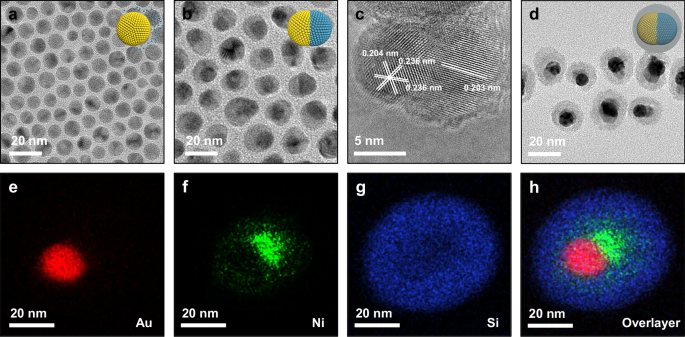
a, b TEM images of Au and Au-Ni NPs. c HRTEM image of Au-Ni NP. d TEM image and (e–h) EDS elemental mappings of AuNi@SiO2 AR photocatalyst.
Electron transfer between Au and Ni in AuNi@SiO2 AR photocatalyst
The results of quasi-in-situ X-ray photoelectron spectroscopy (XPS) provided direct evidence of electron transfer between Au and Ni in the AuNi@SiO2 AR photocatalyst. After calcination in a H2 atmosphere at 350 °C, both Au and Ni in the Au-Ni heterostructure exhibited XPS peaks corresponding to their metallic states (87.19 and 83.48 eV for metallic Au, 869.41 and 852.24 eV for metallic Ni), indicating that the Au-Ni heterostructure has been exposed to a clean surface in the metallic state (Fig. 3a-c). It should be noted that a minor Ni2+ signal was also observed in Fig. 3b, which likely arose from slight surface oxidation during the quasi-in-situ XPS measurements36. This slight surface oxidation did not affect the illumination-induced charge transfer behavior (Supplementary Fig. S13). Importantly, the binding energies of Au and Ni in these heterostructures shifted to higher and lower binding energies, respectively, compared to the monometallic Au@SiO2 (83.40 eV) and Ni@SiO2 (852.35 eV) samples (Supplementary Fig. S14). These shifts directly reflect electron transfer from Au to Ni in the Au-Ni heterostructure, which is consistent with theoretical calculations. Next, the pretreated Au-Ni heterostructures were exposed to illumination for XPS measurement. Under 30 mW·cm-2 (0.3 sun) full-spectrum illumination, the XPS peak of Au 4 f shifted to a higher binding energy (△BE = + 0.15 eV), while the Ni 2p peak shifted to a lower binding energy (△BE = -0.16 eV). And when the light was turned off, these peak positions would return to their original positions. Furthermore, the light-induced XPS peak shifts became more pronounced with an increase in light intensity to 100 mW·cm-2 (Supplementary Fig. S15). These results imply that the light-induced change in XPS peak positions should be attributed to the light-enhanced electron transfer from Au to Ni (Fig. 3a–c and Supplementary Fig. S16–17). Notably, an elevated temperature of 40 °C—which was higher than the catalyst surface temperature under 30 mW·cm-2 illumination—induced only negligible shifts in binding energy: from 83.48 eV to 83.53 eV for Au, and from 852.24 eV to 852.20 eV for Ni. This indicates that the observed electron transfer in the Au-Ni heterostructures is not driven by photothermal heating. (Supplementary Figs. S18–S20).
Fig. 3: Characterization of electron transfer.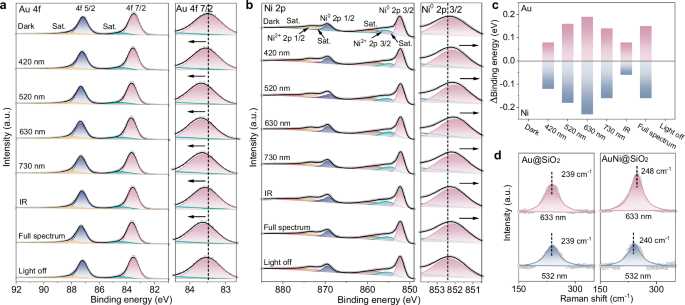
Quasi-in-situ XPS spectra of (a) Au 4 f and (b) Ni 2p of AuNi@SiO2 photocatalyst under 30 mW·cm-2 illumination. c Statistics of binding energy shifts relative to dark condition. d Raman spectra of Au@SiO2 and AuNi@SiO2 under different excitation wavelength. Source data are provided as a Source data file.
Furthermore, the effect of different wavelengths of light on electron transfer between Au and Ni in the AuNi@SiO2 AR photocatalyst was also investigated to gain a deeper understanding of the role of light. Consistent with the full-spectrum illumination XPS results, the XPS peaks for Au and Ni showed distinct shifts, with Au experiencing a high-energy shift and Ni a low-energy shift, compared to conditions without illumination (Fig. 3a-c). Notably, the XPS peak shifts of Au and Ni reached their maximum under monochromatic illumination at 630 nm, with shifts of approximately +0.2 eV and -0.2 eV, respectively. This is consistent with previous reports that the localized surface plasmon resonance (LSPR) peaks of Au nanoparticles aggregation typically lie in the 580-650 nm range37. Previous studies have shown that the LSPR modes of metals typically undergo a red shift as a result of nanoparticles aggregation, primarily due to an increase in the local refractive index surrounding each plasmonic particle38. We have also experimentally confirmed the red shift of the LSPR peak induced by nanoparticle aggregation. Specifically, Au@SiO2 nanoparticles, which were uniformly dispersed in the liquid phase, displayed an LSPR peak around 520 nm. Upon the introduction of Ni, the absorbance spectrum of the catalysts became broader and red-shifted (Supplementary Fig. S21). When these nanoparticles agglomerated, their single-particle dark-field scattering peaks shifted to wavelengths above 600 nm, indicating a pronounced red shift of the LSPR resonance (Supplementary Fig. S22). This red shift caused by particle aggregation was further supported by finite-difference time-domain (FDTD) simulations, which also showed a clear shift in the LSPR peak toward longer wavelengths with increased particle stacking (Supplementary Fig. S23–24). These findings help explain why 630 nm illumination induced the most pronounced electron transfer in the quasi-in-situ XPS measurements. This observation further indicates the surface plasmons excited by light in Au nanoparticles generate nonequilibrium highly excited electrons, which are transferred to Ni nanoparticles, thus increasing their potential energy.
The results of surface-enhanced Raman spectroscopy (SERS) further support these findings (Fig. 3d). The 633 nm excitation laser used in the Raman measurements aligns with the red-shifted resonance condition, as previously discussed, where the resonance wavelength was shown to shift due to nanoparticle aggregation. When excited at this resonance wavelength, the Raman peaks of Au in Au@SiO2 did not exhibit significant shifts. However, for Au in the Au-Ni heterostructures, the peaks gradually shifted to higher wavenumber, accompanied by a noticeable intensity enhancement. This shift can be attributed to a reduction in bond length and lattice constant, which is likely caused by the loss of hot electrons39,40. These results indicate that, upon resonance excitation, hot electrons are generated on the Au surface and subsequently transferred to Ni, also consistent with the observations from XPS analysis.
Light-induced CO adsorption behavior on AuNi@SiO2 AR photocatalyst
The light-promoted electron transfer from the Au antenna to the Ni reactor in AuNi@SiO2 AR photocatalysts significantly alters the adsorption behavior of reactant molecules on Ni sites. Here, carbon monoxide (CO), a key reactant and intermediate in various industrial catalytic processes, such as Fischer-Tropsch synthesis and CO2 hydrogenation, was used as a probe molecule to study the adsorption behavior of reactant molecules. When CO bonds to the metal surface, the 5σ orbitals of CO hybridize with the unoccupied states of the metal, transferring a portion of the 5σ electrons to the unoccupied orbitals of metal. This interaction primarily occurs between the C-terminus of the CO molecule and the metal atoms. Conversely, the lowest unoccupied molecular orbital (LUMO, 2π*) of CO undergoes hybridization with the occupied electronic states on the metal surface, predominantly the d-electronic states of metal. This interaction leads to electron donation from the metal to the 2π* orbitals of CO, a process known as back-donation41,42. In essence, CO adsorption on Ni can be described as an electron-donating process. However, once a certain amount of CO is adsorbed, the Ni can no longer transfer additional electrons to CO to facilitate further adsorption. In the case of the AuNi@SiO2 AR photocatalyst, the light-induced electron transfer from Au to Ni allows these Ni atoms, which were previously unable to donate electrons to the 2π* orbitals of CO, to continue providing electrons (Fig. 4a). This enables these Ni atoms to act as a novel active site, facilitating the adsorption of additional CO molecules.
Fig. 4: Light-induced mechanism.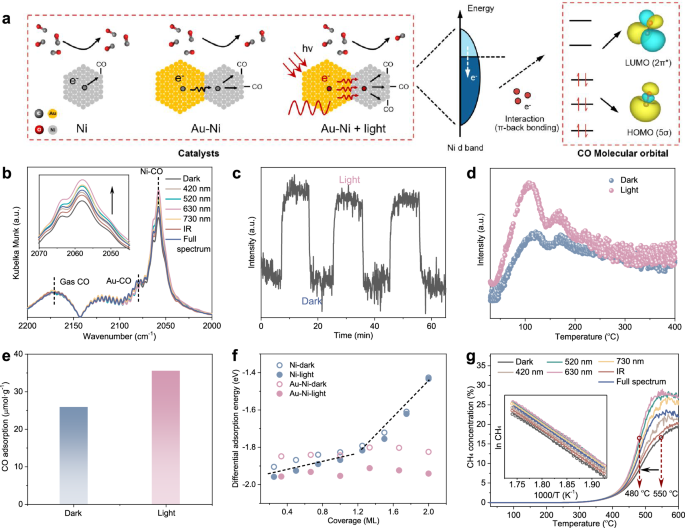
a Scheme of mechanism of light-induced CO coverage enhancement in Au-Ni heterostructures. b CO-DRIFTS of AuNi@SiO2 under 30 mW·cm-2 illumination. The inset shows an enlarged view of the CO adsorption peak. c Evolution of CO adsorption peak intensity during light cycling experiment at 20 °C. d CO-TPD of AuNi@SiO2 under different CO adsorption conditions. e CO adsorption amounts measured through 2.5 vol% CO pulse chemisorption processes of AuNi@SiO2. f The CO adsorption energy of Ni and Au-Ni. g CO hydrogenation TPSR profiles of AuNi@SiO2. The inset presents the Arrhenius plots for CH4 output. Testing conditions: 30 mg of catalyst, CO/H2/N2 = 2/6/2 mL/min, 200 mW·cm-2 illumination. Source data are provided as a Source data file.
The conclusions drawn from the above analysis were further validated experimentally. As observed in Fig. 4b, in-situ diffuse reflectance infrared Fourier transform spectroscopy (DRIFTS) indicated distinct linear CO adsorption peaks for Au and Ni at ~2080 cm−1 and 2056 cm−1, respectively, under saturated CO gas43,44. When compared to the Au@SiO2 catalyst (2068 cm−1), the CO adsorption peak for Au in the Au-Ni heterostructure was blue-shifted, indicating electron loss by Au (Supplementary Fig. S25). Interestingly, the CO adsorption peak position for Ni remained unchanged compared to Ni@SiO2, but its intensity increased significantly. Under illumination, particularly at a wavelength of 630 nm, the CO adsorption peak intensity exhibited the most significant increase without shifting in position. This suggests that while the adsorption strength of Ni for CO remained unchanged, the increase in CO adsorption was attributed to the higher number of adsorption sites made available by the electron-rich Ni formed through electron transfer from Au45,46,47. To further investigate the evolution of CO adsorption under illumination, a light on/off cycling experiment was conducted. The CO adsorption intensity increased rapidly upon light irradiation and returned to its baseline once the light was switched off. These reversible and reproducible changes confirm that the enhanced CO coverage originates from light-induced electron transfer rather than photothermal heating, as CO adsorption typically decreases with increasing temperature due to thermally induced desorption (Fig. 4c and Supplementary Fig. S26). Further confirmation came from CO temperature programmed desorption (CO-TPD) and CO pulse chemical adsorption experiments (Fig. 4d, e and Supplementary Fig. S27–28). A significant enhancement in the CO desorption peak intensity was observed when illumination was applied during the CO pre-adsorption process. Additionally, the CO adsorption amount under illuminated conditions was markedly higher compared to dark conditions. This underscores the role of light in promoting enhanced CO adsorption amount on Ni surface in AuNi@SiO2 AR photocatalyst.
Notably, when CO coverage on the Ni surface was reduced by purging with flowing Ar gas, the intensity of the CO adsorption peak gradually decreased and exhibited a red shift (Supplementary Fig. S29–31). This can be attributed to the fact that a single CO molecule can acquire more electrons from Ni, thereby enhancing the CO adsorption strength. At similar CO adsorption peak intensities, the CO adsorption peaks under illumination showed a red shift compared to those observed in the dark. This further supports the inference that light promotes electron transfer from Au to Ni, resulting in a stronger CO adsorption on Ni at the same CO coverage. These findings indicate that CO adsorption on Ni surfaces is electron-dependent, with more electrons (i.e., activated Ni sites) enabling the adsorption of more CO molecules.
Theoretical calculations were also further employed to evaluate the effect of light on the CO adsorption energy on the catalyst surface. Typically, the CO adsorption energy of a given species follows a two-line model, where the energy becomes progressively more positive and less adsorptive as CO coverage increases. As shown in Fig. 4f and Supplementary Fig. S32, the adsorption energy of CO on monometallic Ni gradually increased with CO coverage, and the addition of light had a negligible effect on this trend. In contrast, electron transfer from Au to Ni in the Au-Ni heterostructure created new CO adsorption sites on the Ni surface, causing the CO adsorption energy to deviate from the two-line model and resulting in a more uniform adsorption energy. This electron transfer, further enhanced by illumination, caused a further decrease in the CO adsorption energy on the Ni surface. This decrease was attributed to the light-induced generation of additional active sites, which facilitated increased CO adsorption.
In general, increasing the coverage of reactants molecular on the catalyst surface can enhance molecular collision frequency, and consequently improve catalytic performance in various catalytic processes48,49. This is typically achieved by increasing the reaction pressure. However, for the AuNi@SiO2 AR photocatalyst, illumination appears to serve a similar role to elevated reaction pressure by increasing the coverage of reactant molecules, but with milder conditions compared to high-pressure reactions. As a proof of concept, we firstly performed CO-DRIFTS experiments under varying pressures, and established a pressure-dependent calibration curve for the CO adsorption intensity (Supplementary Fig. S33). Using this standard, we were able to estimate the equivalent pressurization induced by 30 mW/cm2 illumination of 630 nm, which corresponds to an apparent pressure increase of ~27.7 kPa. The temperature-programmed surface reaction (TPSR) experiments were also carried out for CO hydrogenation to methane (CH4), a reaction typically favorable under high pressure, using the AuNi@SiO2 AR photocatalyst. As shown in Fig. 4g, illumination significantly enhanced the CH4 yield of the AuNi@SiO2 AR photocatalysts compared to the dark reaction conditions. For example, to achieve the same CH4 output concentration of 17%, the reaction temperature under illumination at 630 nm was reduced by 70 °C compared to the dark conditions. More importantly, since CO hydrogenation to CH4 is an exothermic reaction subject to thermodynamic limitations, there is a maximum CH4 concentration that can be achieved at higher reaction temperatures. Illumination significantly increased this maximum CH4 output, which is typically only achieved by increasing reaction pressure. Furthermore, we observed that illumination did not alter the apparent activation energy (Ea) of the catalyst but led to a differential pre-exponential factor. This suggests that the enhancement in catalytic performance induced by light primarily results from an increase in the proportion of Ni sites that exhibit catalytic activity under illumination. The nearly unchanged activation enthalpy (ΔH‡) and moderately increased activation entropy (ΔS‡) from Eyring fitting suggest a consistent mechanism, with illumination enhancing transition state flexibility via more active sites. (Supplementary Fig. S34 and Supplementary Table 1). These findings highlight the potential of illumination as an external field that can reduce the reaction pressure in industrial catalytic processes, i.e., light pressurization effect.
Photocatalytic CO2 hydrogenation over AuNi@SiO2 AR photocatalyst
Carbon dioxide (CO2) hydrogenation, a key process for converting CO2 and H2 into valuable chemicals, holds significant promise for large-scale carbon fixation and chemical production50,51,52,53. Ni is widely regarded as one of the most effective non-precious metal catalysts for CO2 hydrogenation, particularly for CH4 yield. While CO serves as a key intermediate in Ni-catalyzed CO2 methanation, the H2-assisted CO activation process is considered a crucial step in enhancing CH4 yield54. Intuitively, the light-enhanced CO coverage in AuNi@SiO2 AR photocatalysts can significantly improve their performance in CO2 hydrogenation to CH4. As shown in Fig. 5a and Supplementary Fig. S35–38, the Au-Ni@SiO2 AR photocatalysts exhibit a higher thermocatalytic CO2 conversion rate and CH4 selectivity than the Ni@SiO2 catalyst. Under illumination, the CO2 conversion rate and CH4 selectivity of the AuNi@SiO2 AR photocatalysts increase by ~80% and 17%, respectively, while the Ni@SiO2 catalyst shows only slight improvement. Meanwhile, the observed increase in CH4 selectivity under photo-assisted thermal conditions contrasts with the trend observed under purely thermocatalytic conditions, but aligns with the effect of increasing reaction pressure (Supplementary Fig. S39). Specifically, while elevating the pressure thermodynamically favors CH4 formation, raising the temperature generally leads to decreased CH4 selectivity due to the endothermic nature of CO2 methanation. This divergence highlights that, in addition to the photothermal contribution, a non-thermal effect may also influence the catalytic performance. Furthermore, this non-thermal contribution is likely associated with the light-induced pressurization effect. Wavelength-dependent performance studies further demonstrate that the catalyst illuminated with 630 nm light achieves the greatest enhancement in both CO2 conversion and CH4 selectivity, which is consistent with the observed light-induced electron transfer and CO coverage enhancement, thus confirming the hypothesis (Fig. 5b).
Fig. 5: CO2 hydrogenation catalytic performance.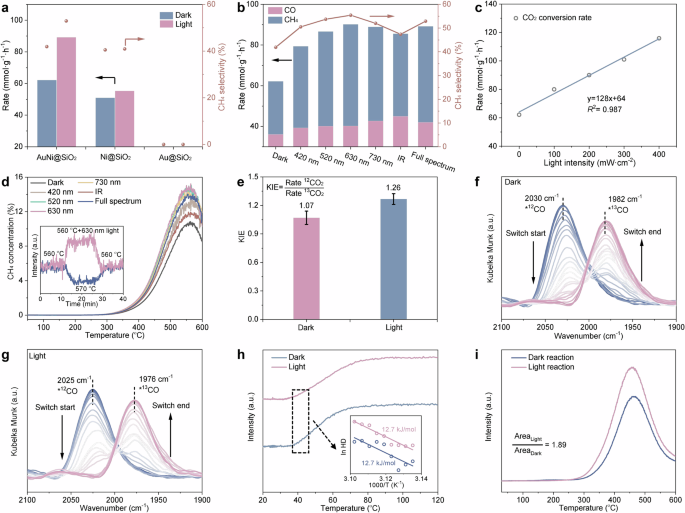
a CO2 hydrogenation rate of Au@SiO2, Ni@SiO2 and AuNi@SiO2 at 300 °C under full spectrum illumination. b Wavelength-dependent performance studies of AuNi@SiO2 at 300 °C. c Catalytic performance of AuNi@SiO2 at 300 °C under 630 nm illumination with different light intensities. d CO2 hydrogenation TPSR profiles of AuNi@SiO2. The inset shows the changes in steady-state catalytic performance upon heating or adding illumination at the maximum CH4 output. Testing conditions: 30 mg catalyst; CO2/H2/N2 = 2/8/10 mL min−1; 200 mW·cm-2 illumination. e Kinetic isotope effect (12CO2 + H2 rate/13CO2 + H2 rate) over AuNi@SiO2 at 300 °C. Error bars represent ± standard deviation from three equivalent experiments. f, g Time-resolved in-situ DRIFTS difference spectra of surface species evolution during a switch from 12CO to 13CO at 20 °C. h Temperature-programmed H2-D2 exchange over AuNi@SiO2. The inset presents the Arrhenius plots for HD generation. i In-situ H2-TPR curves of spent AuNi@SiO2 after dark and illumination reaction. Source data are provided as a Source data file.
To better understand the mechanism behind the light-induced enhancement in CH4 yield during CO2 hydrogenation, we investigated the relationship between CO2 conversion rate and illumination intensity. We found that the CO2 conversion rate increases gradually with light intensity, showing a linear correlation (Fig. 5c and Supplementary Fig. S40). This observation suggests that hot carriers play a critical role in the catalytic process, contributing to the light-induced improvement in CH4 yield45. Additionally, similar to the results of CO hydrogenation TPSR, the maximum CH4 output in CO2 hydrogenation TPSR was significantly enhanced by illumination, with the apparent Ea remaining relatively unchanged (Fig. 5d and Supplementary Fig. S41–42). We also carried out steady-state CO2 hydrogenation tests at 560 °C, the temperature corresponding to the maximum CH4 output, to examine how CH4 production responds to external stimuli under thermodynamic equilibrium-favored conditions. Under these conditions, raising the temperature to 570 °C led to a noticeable drop in CH4 production, consistent with the thermodynamic limitation of the exothermic methanation reaction. In contrast, introducing light at the same temperature resulted in a clear increase in CH4 output. This contrasting trend suggests that the observed CH4 yield enhancement under illumination is not primarily due to photothermal effects—since a thermal increase would reduce CH4 yield—but rather stems from the light-induced pressurization effect.
The results from kinetic isotope effect (KIE) experiments further support this conclusion. As shown in Fig. 5e, the KIE value for CO2 under dark conditions was 1.07, whereas it increased to 1.26 under illumination and this increase in KIE values was not influenced by the reaction temperature (Supplementary Fig. S43). This suggesting that hot carriers generated from the nonradiative relaxation of Au accelerated the reaction rates55. It is worth noting that such light-induced KIE enhancement is often attributed in the literature to the formation of transient negative ions (TNI) via hot-electron injection into the antibonding orbitals of pre-adsorbed molecules, leading to isotope-sensitive dynamics on the modified potential energy surface27,56,57. However, in our system, hot electrons from Au are not transferred to CO molecules already adsorbed on Ni. Instead, they increase the electron density of previously inactive Ni sites, enabling these sites to adsorb additional CO molecules. As a result, the light-induced increase in CO coverage promotes further hydrogenation of CO to CH4, which involves C–H bond formation steps that are isotope-sensitive, thereby contributing to the observed KIE enhancement. Furthermore, when the KIE values were calculated for the products, CH4 and CO, both exhibited secondary KIE, indicating that CO and CH4 are produced via the same reaction pathways (Supplementary Fig. S44). Interestingly, CH4 displayed a normal KIE, while CO showed an inverse KIE, suggesting that CO2 methanation in this study may follow the reverse water-gas shift (RWGS) followed by CO hydrogenation pathways, with the continued hydrogenation of CO to CH4 playing a key role. Furthermore, it was observed that the KIE value for CH4 increased under illumination, while that for CO showed minimal variation. This phenomenon can thus be attributed to the light-induced formation of new active sites and increased CO coverage, which enhanced the downstream hydrogenation steps contributing to CH₄ formation.
CO2 hydrogenation DRIFTS experiments were conducted to gain deeper insight into the reaction mechanism. A typical linear CO adsorption peak (*CO) was observed in the DRIFTS spectra of the AuNi@SiO2 AR photocatalysts, indicating that *CO is a key intermediate species for CH4 production, in agreement with previous reports (Supplementary Fig. S45–46). When 12CO2 was replaced by 13CO2, the CO adsorption peak shifted significantly to lower wavenumbers (Fig. 5f). This shift reflects the gradual replacement of surface-adsorbed *12CO intermediates by *13CO, indicating that the CO species are dynamically formed from the gas-phase CO2 under reaction conditions58,59. This further confirms the crucial role of *CO as an intermediate in CO2 methanation. Under illumination, a similar redshift of the *CO peak due to the 12CO2 to 13CO2 substitution was also observed, accompanying increased CH4 peak intensity. However, in contrast to dark conditions, the adsorption peaks for both 12CO and 13CO exhibited an even greater redshift (Fig. 5g). These results provide further evidence that light-triggered generation of additional active sites enhances CO adsorption, thereby promoting CH4 production.
Furthermore, considering the importance of the *CO hydrogenation pathway for CH₄ production, the adsorption and dissociation abilities of H2 must also be taken into account. The H2 dissociation capability of the catalyst was assessed through H2-D2 exchange experiments. As shown in Fig. 5h and Supplementary Fig. S47–48, the AuNi@SiO2 AR photocatalysts demonstrated excellent H2 dissociation ability, with activation temperatures for H2 activation observed below 50 °C, and no significant effect from illumination. Combined with the KIE values, which showed no change under illumination, these results suggest that H2 plays a minimal role in the CO2 hydrogenation reaction (Supplementary Fig. S49–50). Specifically, light primarily affects the reaction steps involving C-containing species, rather than the steps involving H2 dissociation and reactive H species. Furthermore, we also performed in-situ temperature-programmed reduction (TPR) testing for the AuNi@SiO2 AR photocatalysts after light and dark CO2 hydrogenation reactions (Fig. 5i). It is found that the catalysts reacted under illumination produced more CH4 in H2-TPR test compared to catalysts reacted under dark condition, implying that more key intermediate species was produced during CO2 hydrogenation under illumination. Combining these results, it is reasonable to infer that light promotes CO2 methanation process, i.e., light excites plasmon on the Au surface to generate high-energy electrons and inject them into Ni, and therefore Ni adsorbs more CO key intermediates during CO2 hydrogenation and consequently promotes CH4 production. That is, light boosts the CO2 methanation process by inducing the AuNi@SiO2 AR photocatalysts to produce more active sites.
Study of the CO2 hydrogenation reaction pathway
Density functional theory (DFT) calculations were performed to better understand the effect of light on the CO2 hydrogenation reaction pathways in AuNi@SiO2 AR photocatalysts. Given that the adsorption and dissociation of H2 are less critical compared to the behavior of C-containing species, the H2 adsorption and dissociation processes were simplified in this analysis. For CO2 activation on the Au-Ni heterostructure model, which represents the first step in CO2 hydrogenation, CO2 molecules preferentially dissociate into CO* and O* on the Ni surface. This dissociation occurs with a lower energy barrier than H-assisted CO2 dissociation (Supplementary Fig. S51–54, Table 2–4 and Supplementary Data 1). Subsequently, O* reacts with H2 to form H2O and is removed from the surface, while CO* either desorbs directly or undergoes further hydrogenation to form HCO*. The direct dissociation of CO* into C* and O* is less favorable due to a higher reaction barrier. HCO* then undergoes a series of hydrogenation steps to eventually form CH4. The illumination did not significantly affect these reaction pathways, which are also the main steps in the monometallic Ni model (Supplementary Fig. S55–63). Degree rate control (DRC) analysis indicates that the rate-determining step (RDS) in CO2 methanation is the dissociation of HCO* on both Ni and Ni in the Au-Ni heterostructures, and this step is also unaffected by illumination. This suggests that the hot electron injection from Au to Ni does not alter the RDS for CO2 hydrogenation on the Ni surface. The CO* remains the most abundant surface species during CO2 hydrogenation and is a key intermediate in CH4 formation, which aligns with the previous DRIFTS results. Therefore, the behavior of CO*, including its desorption and further hydrogenation, is critical for determining the final product selectivity.
For the monometallic Ni model, it is found that the energy barrier for CO* desorption (1.79 eV) is slightly higher than that for its further hydrogenation (1.46 eV), which explains the presence of some CO in the catalytic products of CO2 hydrogenation (Supplementary Fig. S55 and Supplementary Table 5). However, when Ni receives electrons from Au in the Au-Ni heterostructure, it exhibits stronger CO* adsorption, which is further enhanced under illumination. As a result, the energy barrier for CO* desorption on Ni in the Au-Ni heterostructure increases to 1.93 eV, while the energy barrier for CO* hydrogenation decreases to 1.33 eV. Additionally, illumination further widens the difference in energy barriers for CO* desorption (2.00 eV) and CO* hydrogenation (1.32 eV), due to the increased injection of hot electrons (Fig. 6a, c and Supplementary Table 5–6). This is consistent with the observed light-enhanced CH4 yields during CO2 hydrogenation. Microkinetic modeling (MKM) results further support these conclusions. The CH4 conversion frequency is higher on the Ni surface in the Au-Ni heterostructure compared to the monometallic Ni surface. Under illumination, the CH4 conversion frequency increases even further, while the CO conversion frequency decreases. Furthermore, the CH4/CO conversion frequency ratio, used to qualitatively assess product selectivity, shows that the ratio for the monometallic Ni surface is close to 0, indicating CH4 dominance with a notable presence of CO. In contrast, the CH4/CO ratio exceeds 1 on the Ni surface in the Au-Ni heterostructure, and this ratio increases further under illumination, indicating a continued improvement in CH₄ selectivity (Fig. 6b, d and Supplementary Fig. S64–67).
Fig. 6: DFT studies of the reaction mechanisms of CO2 hydrogenation.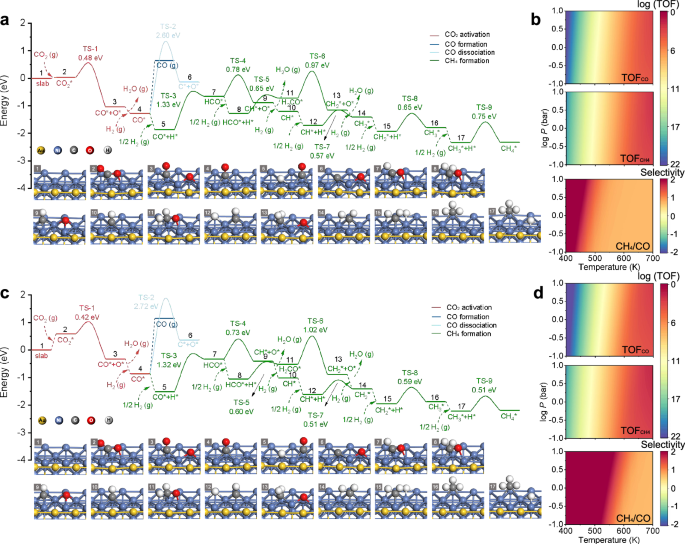
Free-energy diagrams of the CO2 hydrogenation reaction pathways on Au-Ni (a), without and (c) with illumination. The insets show the atomic structures of the reaction intermediates. The labels (g), (p) and (v) represent gas phase, parallelly adsorbed, and vertically adsorbed states, respectively. TOFs for the generation of CO, CH4 and selectivity of CH4 from the microkinetic modeling of the reaction mechanisms on Au-Ni (b) without and (d), with illumination. Source data are provided as a Source data file.