The methodology framework of this study aims to achieve two goals: (1) draft the energy–water–climate impacts of AI servers in the United States from 2024 to 2030 to handle the massive concerns about AI developments, and (2) identify the best and worst practices of each influencing factor to scheme the net-zero pathways for realizing water and climate targets set for 2030. Compared with many previous climate pathway studies, which often extend predictions to 2050 for better integrating climate goals, this study focuses on the period from 2024 to 2030 due to the great uncertainties surrounding the future of AI applications and hardware development. For assessing these uncertainties, scenario-based projections are first constructed to obtain potential capacity-increasing patterns of AI servers. Technology dynamics, such as SUO and ALC adoption, are defined with best, base and worst scenarios, and a similar method is employed to capture the impact of grid decarbonization and spatial distribution. The utilized models and data required during the calculation process are illustrated in the following sections. More details on model assumptions and data generation are provided in sections 1–4 of Supplementary Information.
Data description and discussion
This section provides a comprehensive overview of the data used in this study. Historical DGX (Nvidia’s high-performance AI server line) parameters were sourced from official documentation, and future scenarios were projected on the basis of historical configurations and current industry forecasts. To attain the units of AI servers, we collected the most updated industrial report data for projecting the future manufacturing capacity of CoWoS technology, which is the bottleneck for top-tier AI server production. The data resources of the preceding process have been introduced and validated in section 1 of Supplementary Information. AI server electricity usage was assessed using recent experimental data on maximum power44,45, idle power44,46 and utilization rate46,47,48,49, derived from existing AI server systems. PUE and WUE values for AI data centres across different locations were calculated using operational data from previous studies30,50 and industrial resources51, combined with the collected average climate data for each state52. The allocation ratios of AI servers to each state were determined on the basis of configurations of existing and planned AI data centres, which are collected from reports of major AI companies in the United States, as data resources detailed in section 2 of Supplementary Information. In addition, projections for grid carbon and water factors were derived from the ReEDS model31, using its default scenario data33. All datasets employed in this study are publicly available, with most originating from well-established sources. A key uncertainty lies in estimating the number of manufactured AI server units, as official supply-chain reports remain largely opaque. To maintain transparency and ensure reproducibility, we rely on the best available industry reports rather than commercial sources such as International Data Cooperation data53, which are not granted for open access and would limit future validation despite their potential to provide better estimates. The validations of applied data are further detailed in sections 1 and 4 of Supplementary Information.
AI server power capacity projections
The energy consumption of AI servers is projected to be driven predominantly by top-tier models designed for large-scale generative AI computing6,7. This trend is attributed to their substantial power requirements and the increasing number of units being deployed. In this study, we estimate the power capacity of these high-performance AI servers by examining a critical manufacturing bottleneck: the CoWoS process54. This process, which is controlled nearly exclusively by the Taiwan Semiconductor Manufacturing Company, serves as a key determinant of the manufacturing capacity for AI servers in recent years55. Our analysis uses forecast data and projection assumptions of the CoWoS process to estimate total production capacity. Other factors are integral to translating this capacity into the power capacity of AI servers: the CoWoS size of AI chips, which determines how many chips can be produced by each wafer; the rated power of future AI servers, which reflects the power demand per unit; and the adoption patterns of AI servers, which dictate the mix of various server types over time. The values of these factors are derived mainly from the DGX systems produced by Nvidia, which is the dominant product for the top-tier AI server markets56.
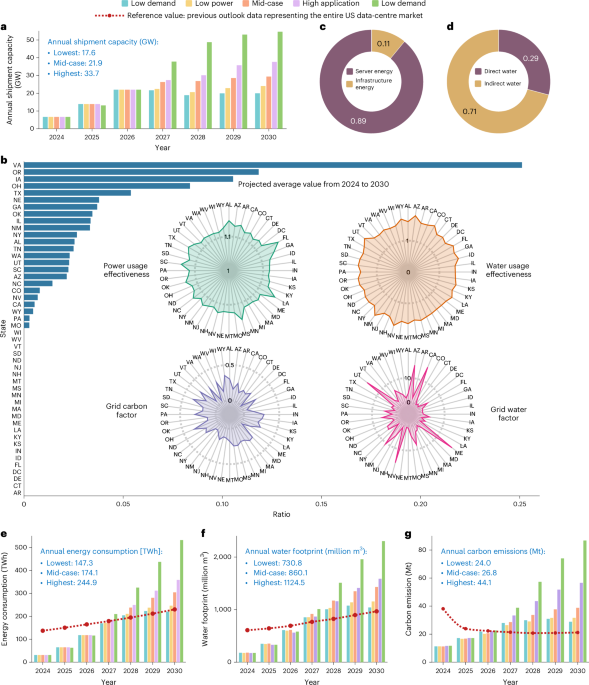
Considering the influencing factors for the total AI server capacity shipments and existing uncertainties, we generate distinct scenarios as follows:
-
Mid-case scenario: the CoWoS capacity is projected to slightly increase after 2026, consistent with the growth rate in 2023. Under this scenario, AI servers’ rated power is expected to have a linear relationship with the anticipated die size increase while adoption patterns remain aligned with current trajectory.
-
Low-demand scenario: characterized by lower CoWoS capacity growth and lower AI server rated power compared with the mid-case scenario, this reflects a scenario of lower overall demand for AI servers.
-
Low-power scenario: maintains the same assumptions as the mid-case scenario but with lower AI server rated power, representing efficiency gains in AI hardware and software development.
-
High-application scenario: assumes lower AI server rated power alongside high CoWoS capacity, capturing the potential rebound effect where efficiency gains drive increased AI workload deployment.
-
High-demand scenario: features higher CoWoS capacity expansion, higher AI server rated power and higher adoption of new servers compared with the mid-case scenario, reflecting a scenario of strong AI server demand.
Based on the assumptions and scenarios outlined, the annual projections for top-tier AI server shipments and their average rated power are calculated as follows:
$$\begin{array}{l}{N}_{\mathrm{AI}}=\frac{{C}_{\mathrm{CoWoS}}\times {R}_{\mathrm{Nvidia}}\times {\sum }_{i}{R}_{i}{n}_{i}}{{N}_{\mathrm{GPU}}}\\ {\bar{P}}_{\mathrm{AI}}=\mathop{\sum }\limits_{i}{R}_{i}{P}_{i}\end{array}$$
(1)
where \({N}_{\mathrm{AI}}\) and \({\bar{P}}_{\mathrm{AI}}\) represent the annually projected shipments and average rated power of the top-tier AI servers. \({R}_{\mathrm{AI}}\) is the ratio of CoWoS capacity allocated to top-tier AI servers and is set as 40% for 2022, 40.7% for 2023, 48.5% for 2024 and 54.3% for 2025, according to industry reports57,58. For years beyond 2025, this ratio is assumed to remain constant at the 2025 value due to a lack of further data. The sensitivity analysis regarding this value is provided in Fig. 6. \({C}_{\mathrm{CoWoS}}\) is the projected CoWoS capacity within each scenario. \({N}_{\mathrm{GPU}}\) is the number of graphic processor units (GPUs) per server and is set as 8, reflecting the configuration of most commonly used AI server systems59. In addition, \({R}_{i}\), \({n}_{i}\) and \({P}_{i}\) represent the projected adoption ratio, units yield per CoWoS wafer and rated power of the ith type of chip at each year, respectively. The details of the projections and related data resources are provided in section 1 of Supplementary Information, Supplementary Figs. 1–4 and Supplementary Table 1.
AI server electricity usage calculation
The applied AI server electricity usage model is a utilization-based approach initially derived from CPU (central processing unit)-dominant servers60 and can be written as the following:
$${P}_{\mathrm{server}}=({P}_{\max }-{P}_{\mathrm{idle}})u+{P}_{\mathrm{idle}}$$
(2)
The preceding model assumes the total server power has a linear relationship with the processor utilization rate u. While this relationship has been well validated for CPU machines, its application to GPU utilization is less established except for a few cases61. However, several recent studies have shown a strong correlation between GPU utilization and overall server power consumption when dealing with AI workloads44,46, indicating that GPUs are the dominant contributors to energy use in AI servers45. Although systematic experimental validation specific to GPUs is still limited, the consistency of findings across various case studies supports the assumption that the linear relationship applies here as well. The maximum power \({P}_{\max }\) and idle power \({P}_{\mathrm{idle}}\) are generated on the basis of the recent DGX system experimental results, and their values are set as 23% and 88% of the server rated power, respectively44,46. The sensitivity analysis was conducted to quantify the uncertainty, as shown in Supplementary Fig. 6. Moreover, the GPU processor utilization \(u\) is calculated as the following:
$$u={u}_{\mathrm{active}}\times {r}_{\mathrm{active}}$$
(3)
where \({u}_{\mathrm{active}}\) and \({r}_{\mathrm{active}}\) represent the average processor utilization of active GPUs and the ratio of active GPUs to total GPUs, respectively. Note that the \({u}_{\mathrm{active}}\) and \({r}_{\mathrm{active}}\) commonly have higher values during training compared with inference62. Specifically, we use currently available AI traces, including Philly trace47, Helios trace46, PAI trace48 and Acme trace49, to determine the \({r}_{\mathrm{active}}\) for training and inference tasks. These traces provide comprehensive analyses on the relationship between GPU utilization rate and job characteristics. Based on the data provided in these works, the \({r}_{\mathrm{active}}\) is set as 50% and 90% for inference and training, respectively. Moreover, the \({u}_{\mathrm{active}}\) values are further determined on the basis of recent experimental studies44. The values are set as 50% and 80% for inference and training, respectively. Therefore, the processor utilization rates for inference and training in this work are set as 25% and 72%, respectively. Following the previous works63,64, our base estimations assume 30% of computing capacity for training and 70% for inference. A detailed sensitivity analysis on the impact of these utilization rate settings is provided in Fig. 6.
Assessment of the environmental footprints of AI servers
This study employs a state-level allocation method to evaluate the energy, water and carbon footprints of AI servers. To capture the current and future distributions of AI server capacity, we compiled data of current and in-construction large-scale data centres belonging to major purchasers of top-tier AI servers, including Google, Meta, Microsoft, AWS, XAI and Tesla. The analysis incorporates the location, building area and construction year of each data centre to calculate the state-level distribution of server capacity by annually aggregating the total building area for each state. On the basis of our calculations, no major changes in spatial distribution are projected between 2024 and 2030, even with the anticipated addition of new data centres. Therefore, we assume the current spatial distribution will remain constant from 2024 to 2030 to account for uncertainties in directly integrating the projected contributions of in-construction data centres. Further details on the methodology and spatial distribution results are provided in section 2 of Supplementary Information.
For each state, the actual energy consumption can be derived from the server electricity usage and the PUE value of AI data centres. Meanwhile, the water footprint and carbon emissions should be analysed across three scopes. Scope 1 encompasses the on-site water footprint, calculated on the basis of on-site WUE (shortened as WUE in this work) and on-site carbon emissions (typically negligible for data centres18). Scope 2 includes off-site water footprint and carbon emissions, which are contingent on the local grid power supply portfolio. Scope 3, representing embodied water footprint and carbon emissions during facility manufacturing, lies beyond the spatial scope of this study. A regional PUE and WUE model, following the idea in previous research30,50, is applied to estimate the PUE and WUE values of AI data centres in different states. This hybrid model integrates thermodynamics and statistical data to generate estimations on the basis of local climate data. Specifically, we collected the average climate data of each state between 2024 and 2030 from an existing climate model52, which is then employed in calculating the PUE and WUE values of each state. Considering that the specific cooling settings for AI data centres are unknown, the base values are calculated by averaging the worst and best cases. The model parameters are detailed in Supplementary Table 2. Subsequently, the Scope 2 water footprint and carbon emissions are calculated on the basis of the grid water and carbon factors derived from the ReEDS model31. This approach also allows us to incorporate the projected data-centre load data, which can further interact with the grid system through services such as demand response. The validation of the ReEDS model results by using current high-resolution data is presented in Supplementary Figs. 7 and 8, and the related discussion is presented in section 4 of Supplementary Information. Optimization and analytical techniques are employed to determine optimal parameters during the simulation to generate the best and worst practices concerning industrial efficiency efforts, spatial distributions and grid decarbonization. Moreover, the water scarcity and remaining renewable energy potential data of each state are computed on the basis of the calculated environmental cost and standard data from previous literature18,65. The preceding calculation process depends mainly on previously established approaches, and its integration into our framework is further discussed in sections 3 and 4 of Supplementary Information.
Uncertainties and limitations
There are substantial uncertainties inherent in projecting the evolution of AI servers. Our analysis presents a range of scenarios based on current data to evaluate the impacts of data-centre operational efficiency, spatial distribution and grid development. However, several key uncertainties remain an unmodelled field for this work. For a better understanding of our study and to outline future research directions, these uncertainties are categorized as follows:
-
Model and algorithm innovations: the model and algorithm breakthroughs in the AI industry could fundamentally alter computing requirements.
-
Supply-chain uncertainties: the complex production process of AI servers may reveal new bottlenecks beyond the current CoWoS technology, leading to varying expansion patterns.
-
Hardware and facility evolutions: continued improvements in AI computing hardware and data-centre efficiency may substantially affect the environmental impact of these servers.
-
Out-of-scope factors: there are other major contributors that are out of the scope of this study and would be critical to the process, such as market forces and geopolitical influences.
The impacts of these factors are multifaceted and challenging to model with existing data. For example, while the recent release of DeepSeek has been interpreted as reducing the energy demands of AI servers, it may also trigger a rebound effect by spurring increased AI computing activity, ultimately resulting in higher overall energy, water and carbon footprints43. However, no fresh data have become available to simulate this complex process, based on our best knowledge when drafting. To further assess the influence of unpredictable uncertainties, we conducted a sensitivity analysis on key factors, including manufacturing capacities for AI servers, US allocation ratios, server lifetimes, idle and maximum power ratios and training/inference distributions. As shown in Fig. 6, our findings suggest that the key conclusions of this study are expected to remain robust as long as the impact of future uncertainties does not notable exceed the ranges considered. Given the highly dynamic nature of AI evolution, our modelling approach allows for future revisions as more data become available on potential shifts in industry trends.
Reporting summary
Further information on research design is available in the Nature Portfolio Reporting Summary linked to this article.