Jun 22, 2025
IndexBox has just published a new report: China – Ethylbenzene – Market Analysis, Forecast, Size, Trends And Insights.
The article discusses the projected upward consumption trend of ethylbenzene in China, with a forecasted CAGR of +1.5% in volume and +1.7% in value from 2024 to 2035. By the end of 2035, the market volume is expected to reach 53 tons and the market value is projected to be $88K in nominal prices.
Market Forecast
Driven by rising demand for ethylbenzene in China, the market is expected to start an upward consumption trend over the next decade. The performance of the market is forecast to increase slightly, with an anticipated CAGR of +1.5% for the period from 2024 to 2035, which is projected to bring the market volume to 53 tons by the end of 2035.
In value terms, the market is forecast to increase with an anticipated CAGR of +1.7% for the period from 2024 to 2035, which is projected to bring the market value to $88K (in nominal wholesale prices) by the end of 2035.
 ConsumptionChina’s Consumption of Ethylbenzene
In 2024, the amount of ethylbenzene consumed in China contracted remarkably to 45 tons, dropping by -86.2% against 2023 figures. Over the period under review, consumption saw a dramatic slump. Over the period under review, consumption hit record highs at 179K tons in 2018; however, from 2019 to 2024, consumption failed to regain momentum.
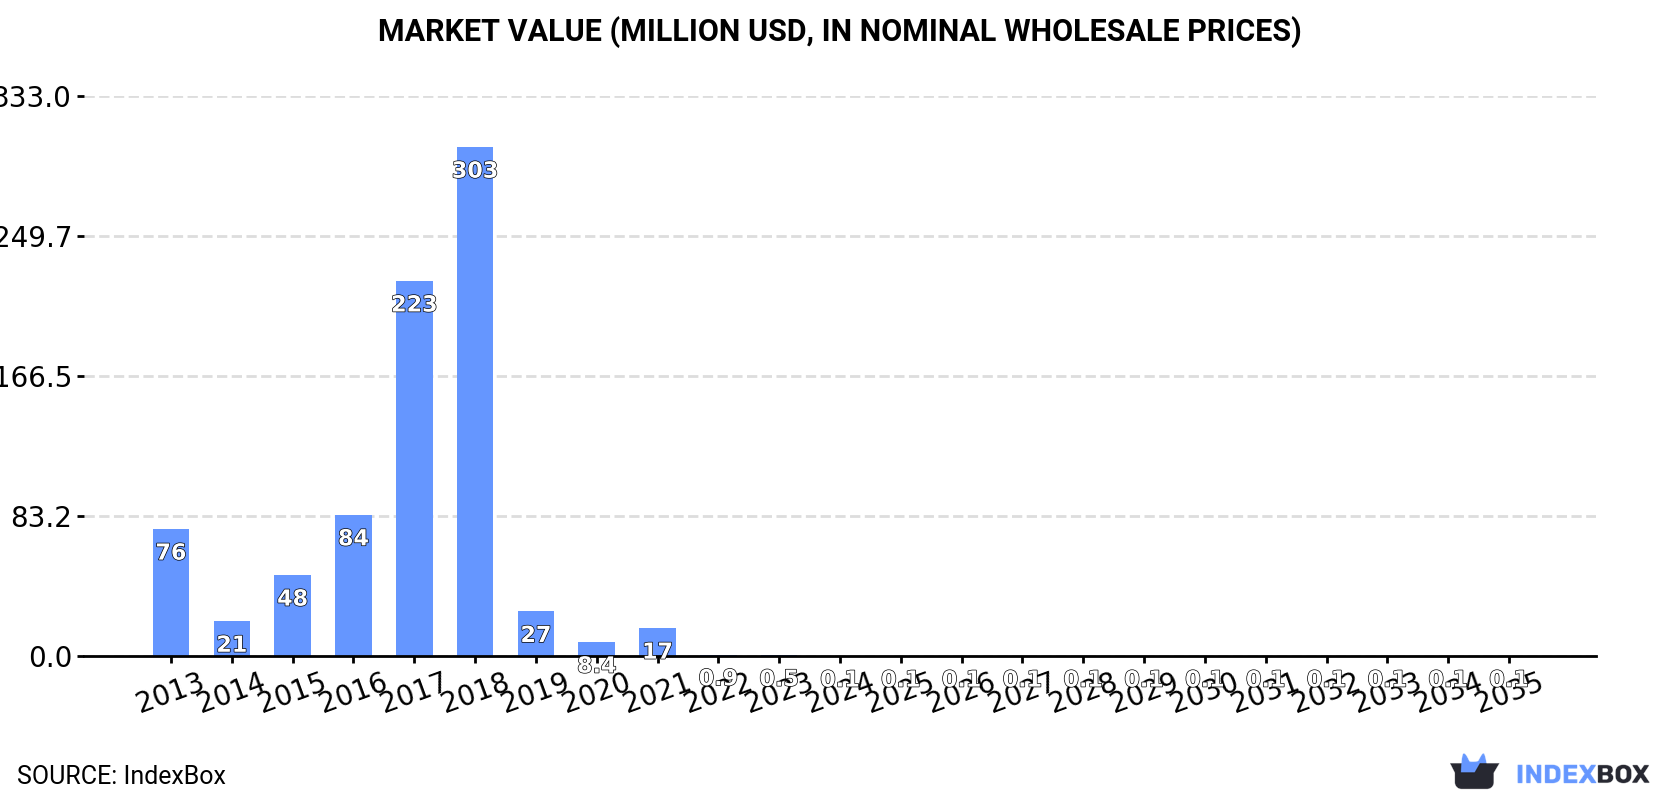
The revenue of the ethylbenzene market in China dropped rapidly to $74K in 2024, declining by -86.4% against the previous year. This figure reflects the total revenues of producers and importers (excluding logistics costs, retail marketing costs, and retailers’ margins, which will be included in the final consumer price). In general, consumption continues to indicate a dramatic setback. Ethylbenzene consumption peaked at $303M in 2018; however, from 2019 to 2024, consumption failed to regain momentum.
ProductionChina’s Production of Ethylbenzene
In 2024, ethylbenzene production in China totaled 1K tons, approximately reflecting the previous year. In general, production continues to indicate a relatively flat trend pattern. The growth pace was the most rapid in 2014 when the production volume increased by 0.6%. Over the period under review, production reached the peak volume at 1K tons in 2022; afterwards, it flattened through to 2024.
In value terms, ethylbenzene production dropped modestly to $1.7M in 2024 estimated in export price. Overall, production, however, recorded a mild decline. The pace of growth appeared the most rapid in 2017 when the production volume increased by 28%. Over the period under review, production attained the maximum level at $2M in 2013; however, from 2014 to 2024, production stood at a somewhat lower figure.
ImportsChina’s Imports of Ethylbenzene
After two years of decline, purchases abroad of ethylbenzene increased by 93% to 197 kg in 2024. Over the period under review, imports, however, showed a sharp curtailment. The most prominent rate of growth was recorded in 2015 with an increase of 171% against the previous year. Over the period under review, imports reached the maximum at 179K tons in 2018; however, from 2019 to 2024, imports failed to regain momentum.
In value terms, ethylbenzene imports soared to $8.3K in 2024. Overall, imports, however, showed a precipitous curtailment. The pace of growth appeared the most rapid in 2017 when imports increased by 207%. Imports peaked at $187M in 2018; however, from 2019 to 2024, imports remained at a lower figure.
Imports By Country
In 2024, the United States (188 kg) was the main ethylbenzene supplier to China, accounting for a 95% share of total imports. Moreover, ethylbenzene imports from the United States exceeded the figures recorded by the second-largest supplier, Japan (7 kg), more than tenfold.
From 2013 to 2024, the average annual rate of growth in terms of volume from the United States totaled -67.0%.
In value terms, the largest ethylbenzene suppliers to China were the United States ($2.6K) and Japan ($2.2K).
In terms of the main suppliers, Japan, with a CAGR of -56.1%, recorded the highest growth rate of the value of imports, over the period under review.
Import Prices By Country
The average ethylbenzene import price stood at $41,970 per ton in 2024, dropping by -16.8% against the previous year. Overall, the import price, however, recorded a significant increase. The pace of growth was the most pronounced in 2022 when the average import price increased by 4,232%. The import price peaked at $50,451 per ton in 2023, and then plummeted in the following year.
Prices varied noticeably by country of origin: amid the top importers, the country with the highest price was Japan ($315,429 per ton), while the price for the United States stood at $13,920 per ton.
From 2013 to 2024, the most notable rate of growth in terms of prices was attained by Japan (+71.4%).
ExportsChina’s Exports of Ethylbenzene
In 2024, exports of ethylbenzene from China skyrocketed to 1,000 tons, with an increase of 39% against the previous year’s figure. Overall, exports saw a significant increase. The pace of growth appeared the most rapid in 2019 when exports increased by 708%. As a result, the exports attained the peak of 5.6K tons. From 2020 to 2024, the growth of the exports remained at a lower figure.
In value terms, ethylbenzene exports soared to $1.5M in 2024. In general, exports saw a prominent expansion. The pace of growth appeared the most rapid in 2019 with an increase of 343%. As a result, the exports attained the peak of $4.7M. From 2020 to 2024, the growth of the exports remained at a lower figure.
Exports By Country
India (814 tons) was the main destination for ethylbenzene exports from China, accounting for a 81% share of total exports. Moreover, ethylbenzene exports to India exceeded the volume sent to the second major destination, Qatar (102 tons), eightfold.
From 2013 to 2024, the average annual growth rate of volume to India amounted to +21.2%. Exports to the other major destinations recorded the following average annual rates of exports growth: Qatar (-3.6% per year) and Hong Kong SAR (+27.6% per year).
In value terms, India ($1.2M) remains the key foreign market for ethylbenzene exports from China, comprising 80% of total exports. The second position in the ranking was taken by Qatar ($150K), with a 10% share of total exports.
From 2013 to 2024, the average annual growth rate of value to India stood at +17.1%. Exports to the other major destinations recorded the following average annual rates of exports growth: Qatar (-5.9% per year) and Hong Kong SAR (+29.9% per year).
Export Prices By Country
The average ethylbenzene export price stood at $1,479 per ton in 2024, declining by -2.8% against the previous year. Over the period under review, the export price continues to indicate a pronounced shrinkage. The most prominent rate of growth was recorded in 2017 an increase of 79% against the previous year. The export price peaked at $2,161 per ton in 2013; however, from 2014 to 2024, the export prices remained at a lower figure.
Average prices varied noticeably for the major external markets. In 2024, amid the top suppliers, the country with the highest price was Hong Kong SAR ($1,584 per ton), while the average price for exports to India ($1,458 per ton) was amongst the lowest.
From 2013 to 2024, the most notable rate of growth in terms of prices was recorded for supplies to Hong Kong SAR (+1.8%), while the prices for the other major destinations experienced a decline.
Source: IndexBox Market Intelligence Platform