Design principles for far-UVC emission
In order to obtain far-UVC ML in Pr3+ ions, a set of conditions should be satisfied (Fig. 1). At the most basic level, the bandgap of the host where Pr3+ ions are embedded should be greater than 6.2 eV (≈200 nm), such that the far-UVC photons are not absorbed by the host (Fig. 1, step 1). This requirement excludes a large portion of semiconductors and oxysalts, such as sulfide (ZnS:3.5 ~ 3.8 eV, CaS:3.06 eV), oxides (Y2O3:5.5 eV, ZnO:3.37 eV and BaTiO3:3.3 eV), tungstates (CaWO4:4.5 eV) and molybdates (CaMoO4:3.7 eV), despite their popularity in hosting visible emitting ions.
Fig. 1: Design principles for far-UVC emission.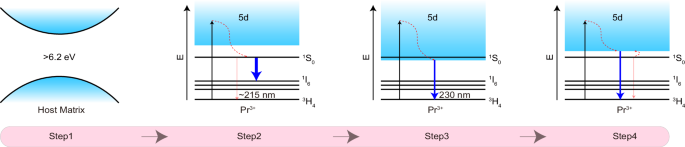
Step 1: Calculation of the band gap of the host crystal. Step 2: Assessment of the position and intensity of transitions from the 1S0 state of Pr3+. Step 3: Determine the lowest energy 4f5d state for the longwave boundary of far-UVC emission. Step 4: Analysis of the situation in which the transitions from the 4f5d state of Pr3+ dominate the emissions as well as the shortwave boundary of far-UVC emission.
Next, we pay attention to the 1S0 state of Pr3+, which may generate far-UVC emissions through the 1S0 → 3H4 (≈215 nm) and 1S0 → 3H5 (≈225 nm) transitions (Fig. 1, step 2). It should be noted, however, that the emission intensities of these intra-configurational transitions are very weak due to their parity-forbidden nature. Another downside is that the total transition branching ratios of 1S0 → 3H4,5 are usually less than 1%. More than 60% ~ 80% of the excited 1S0 state terminates in the lower-lying 1I6 state, peaking at ≈400 nm49,50. This explains why the 1S0 → 3H4 (≈215 nm) and 1S0 → 3H5 (≈225 nm) transitions are hardly observed in most reports. Even if they are observed under optimal conditions, the emission intensity is too weak51,52.
The above discussions suggest that the 1S0 state is unfavorable to far-UVC emissions. Therefore, it is more advisable to expect far-UVC emissions from the 4f5d state. The longwave boundary of far-UVC is at 230 nm, corresponding to ≈43478 cm−1. Accordingly, the lower limit of the 4f5d state should be above 43478 cm−1 (Fig. 1, step 3). Under this premise constraint, the energy position of the 4f5d state should be as close as possible to the center wavelength (≈46500 cm−1) of far-UVC, ensuring that most emissions fall within the far-UVC range.
Notably, an over-high energy of the 4f5d should also be avoided. Otherwise, the excited electrons at the 4f5d state will be non-radiatively relaxed to the lower 1S0 state, followed by the emissions from the 1S0 state (Fig. 1, step 4). In SrAl12O19:Pr3+, for example, the lowest 4f5d state and 1S0 state were ≈47600 cm−1 and ≈46500 cm−1, respectively, with an energy difference of 1100 cm−1 53. In this compound, only weak transitions from the 1S0 state were observed over the far-UVC region at 220 nm. In contrast, the lowest 4f5d state in LaB3O6:Pr3+ is higher than the 1S0 state by ≈900 cm−1, and the 5d → 4f transitions dominated the emission spectrum in the far-UVC range due to the Boltzmann distribution between the 1S0 state and the upper 4f5d state54. Combining the above two situations, we suggest that the position of the 4f5d state should not be higher than that of the 1S0 state by 1000 cm−1.
Summarizing all the information above, we can draw the following semi-empirical conclusion: the 4f5d state of Pr3+ should be in the range of 43478 to 47500 cm−1. Considering that the position of the 1S0 state may slightly change with the alteration of the host (−1), the upper energy limit of the 4f5d state of Pr3+ can be appropriately relaxed to ≈48000 cm−1. Additionally, it is important to note that the host material where Pr3+ ions are embedded needs to have good far-UVC transmission. This clue points to fluorides that typically possess a wide band gap and good ultraviolet transmittance. Based on previous reports, the 4f → 5d transition of Pr3+ in SrF2 had an absorption peak at ≈46600 cm−1 55. Such energy value well satisfies the above guidelines, thus making it possible to achieve far-UVC ML. Therefore, SrF2:Pr3+ was chosen as a representative for examination in the subsequent sections.
Material synthesis and characterization
A series of SrF2:x%Pr3+ (x = 0.1, 0.2, 0.5, 0.7, and 1) phosphors were synthesized by a high-temperature solid-state technique. The X-ray diffraction (XRD) patterns of these samples, mainly comprising the diffraction peaks of (1 1 1), (2 0 0), (2 2 0), (3 1 1), (4 0 0), and (3 3 1) planes, matched well with cubic phase SrF2 crystals (PDF#88-2294) (Fig. 2a). It suggested that SrF2:Pr3+ crystalized in the single center-symmetric structure with the Fm-3m space group (Fig. 2b). In this structure, Sr ions occupied an octahedral coordination environment, where each Sr ion was surrounded by eight F ions. Meanwhile, Pr3+ ions entered the host lattice by substituting the Sr2+ sites (Supplementary Table 2), which was confirmed by the Rietveld refinement analysis (Fig. 2c and Supplementary Table 3).
Fig. 2: Characterization of SrF2:Pr3+.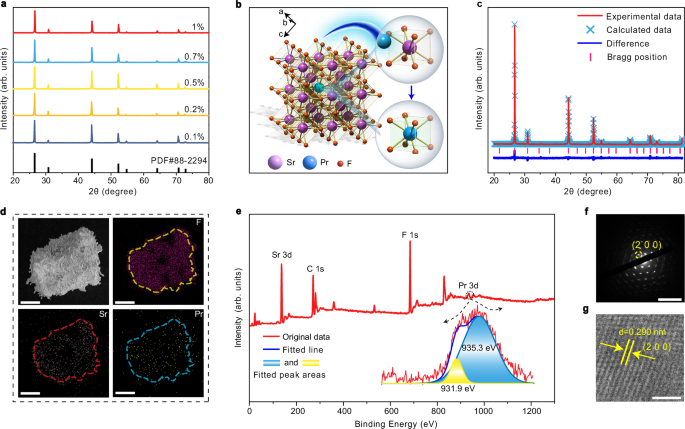
a X-ray diffraction patterns of SrF2:x%Pr3+ (x = 0.1, 0.2, 0.5, 0.7, and 1). b Crystal structure of SrF2:Pr3+. c Rietveld structure refinements of SrF2:0.5%Pr3+. d Scanning electron microscopy and elemental mapping images SrF2:0.5%Pr3+ (scale bar: 50 μm). e X-ray photoelectron spectroscopy profile of SrF2:0.5%Pr3+. f Selected area electron diffraction image of SrF2:0.5%Pr3+ (scale bar: 10 nm−1). g High-resolution transmission electron microscopy image of SrF2:0.5%Pr3+ (scale bar: 2 nm). Source data are provided as a Source Data file.
The scanning electron microscopy (SEM) image revealed an irregular morphology of the as-synthesized SrF2:Pr3+ in the micrometer length scale, with Sr, F and Pr elements distributed uniformly at the single particle level (Fig. 2d and Supplementary Fig. 2). The energy dispersive spectroscopy (EDS) results proved that the element ratios of Sr, F, and Pr were as expected (Supplementary Figs. 3–7). The X-ray photoelectron spectroscopy (XPS) results further validated the presence of constituent elements (Fig. 2e). The XPS peaks centered approximately at 966 and 946 eV were not observed, indicating the absence of tetravalent Pr. The peaks at the binding energy of 931.9 and 935.3 eV were ascribed to trivalent Pr. We also measured the Raman shift of SrF2:0.5%Pr3+ (Supplementary Fig. 8). A prominent band appeared at approximately 285 cm-1, attributed to the first-order F2g mode of SrF256. The selected area electron diffraction (SAED) exhibited sharp diffraction spots with a periodic arrangement, demonstrating good crystallinity (Fig. 2f). The high-resolution transmission electron microscopy (HR-TEM) images further disclosed the good crystallinity of our samples, which show well-defined (2 0 0) and (1 1 1) lattice fringes with observed d-spacings of 0.290 and 0.335 nm, respectively (Fig. 2g and Supplementary Fig. 9).
Multi-stimulated far-UVC luminescence
We designed a set of experimental procedures to systematically investigate the multi-stimulated luminescence, as schematically shown in Fig. 3a. Figure 3b depicts the emission spectra of SrF2:Pr3+ under different conditions. As can be seen, the sample can be directly excited by mechanical action through the self-recoverable ML mechanism (Stage I). After being exposed to X-ray irradiation, bright persistent luminescence (PersL) was detected (Stage II), indicating the occurrence of charge carrier trapping. Following PersL, we further detected trap-controlled ML by application of force (Stage III). The trap-controlled ML was about 90-fold stronger than the self-recoverable ML, and the intensity fell back to the original level by thermal cleaning of the trap states (Stage IV). Notably, all the spectra are dominated by the characteristic emission peaks of Pr3+ ions, suggesting that Pr3+ ions consistently acted as luminescent centers during the whole process (Fig. 3b). Specifically, the visible emission bands are attributed to the 3P0 → 3H4 (488 nm), 3P1 → 3H5 (524 nm), 3P0 → 3H6 (606 nm) /1D2 → 3H4 (606 nm) and 3P0 → 3F2 (640 nm) transitions of Pr3+. The UVC emission bands are assigned as the 4f5d → 3H4 (222 nm), 4f5d → 3H5 (233 nm) and 4f5d → 3H6 (259 nm) transitions of Pr3+. Note that the broad band peaking at 300 nm came from the self-trapped exciton of the host (Supplementary Fig. 10)57,58,59. The presence of the ML line at 222 nm proves the reliability of our guidelines for designing far-UVC luminescence.
Fig. 3: Optical properties of SrF2:Pr3+.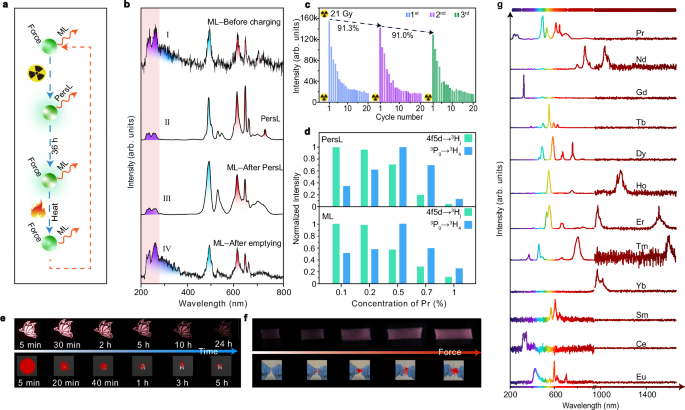
a Schematic of experimental procedures for mechanoluminescence (ML) and persistent luminescence (PersL) measurement. b Comparison of spectra of SrF2:0.5%Pr3+ under different conditions. Stage I: obtained before X-ray irradiation. Stage II: obtained immediately after stoppage of 5-min X-ray irradiation. Stage III: obtained upon force stimulation at 5 N after PersL. Stage IV: obtained after thermal bleach. c Repeatability results of trap-controlled ML. d PersL and ML intensity of SrF2:Pr3+ as a function of Pr3+ content. e Photographs of visible and UVC PersL of SrF2:0.5%Pr3+, showing progressive changes over time following a 5-min X-ray irradiation. f Photographs of visible and UVC ML of SrF2:0.5%Pr3+@polydimethylsiloxane films stretched under different magnitudes of force. g ML spectra of SrF2 singly doped with different lanthanides (0.5%mol). Source data are provided as a Source Data file.
We next examined the repeatability of ML. Both the self-recoverable and trap-controlled ML decreased after several cycles of continuous operation (Fig. 3c and Supplementary Fig. 11). This phenomenon was also previously observed by several groups13,15,22,25,43. By checking the XRD results of SrF2:0.5%Pr3+ after grinding, we found no noticeable change in the crystal structure (Supplementary Fig. 12). The comparison of SEM images of SrF2:Pr3+ before and after grinding suggested that the samples became progressively finer (Supplementary Fig. 13). As the surface area and morphology of samples had been modified, it was reasonable to assume that the ML property, including both self-recoverable and trap-controlled ML, were affected to some extent60.
We optimized the content of Pr3+ in SrF2 with emphasis on the 4f5d → 3H4,5,6 and 3P0 → 3H4 transitions. The transitions from the 4f5d and 3P0 states exhibit opposite trends with doping concentration (Fig. 3d and Supplementary Fig. 14). Such discrepancy is explained by the possible cross-relaxation-induced concentration quenching mechanism (Supplementary Fig. 15). With gradually increasing the content of Pr3+, the 4f5d → 3H4,5,6 transition showed a monotonic decrease trend, as the [4f5d → 3P0,1]/[1D2 ← 3H4] cross-relaxation process was harmful to the 4f5d state. By contrast, the 3P0 → 3H4 transition increased first over the range of 0.1 x 3P0,1]/[1D2 ← 3H4] cross-relaxation would populate the 3P0 state, together with the increment of luminescent centers. When the content of Pr3+ exceeded 0.5%, the 3P0 → 3H4 transition experienced a continuous decline, attributed to the predominance of [3P0,1 → 1G4]/[1G4 ← 3H4] cross-relaxation59.
Under a doping concentration of 0.5%, the SrF2:Pr3+ exhibited pronounced and balanced visible and UVC PersL after the stoppage of X-ray irradiation (Fig. 3e and Supplementary Fig. 16). It was easy to distinguish the UVC PersL signal from the background noise after several hours. Even after one day, the visible PersL was observed clearly. Over the whole PersL process, the positions of emission spectra remained unchanged (Supplementary Fig. 17). After the release of room temperature PersL, SrF2:Pr3+ continued to emit in the visible and UVC regions by mechanical stimulation (Fig. 3f and Supplementary Movie 1). With increasing the force, both the UVC and visible ML were enhanced. Notably, the ML intensity of 3P0 → 3H4 (488 nm) and 4f5d → 3H4,5,6 transitions displayed different responses to the external force (Supplementary Figs. 18 and 19), pushing us to establish a ratiometric method for stress sensing61,62. The ML intensity ratio between the 3P0 → 3H4 and 4f5d → 3H4,5,6 transitions presented a monotonic decrease by raising the force, with the relative sensitivity varying from 3% N−1 to 7% N−1 over the 5–25 N range (Supplementary Fig. 20).
We also prepared a series of SrF2 samples doped with various lanthanides (Ce3+, Nd3+, Sm3+, Eu2+,3+, Gd3+, Tb3+, Dy3+, Ho3+, Er3+, Tm3+, and Yb3+) to expand the spectral range. The XRD and XPS results proved the successful preparation of target materials (Supplementary Figs. 21 and 22). All these samples emitted self-recoverable ML (Supplementary Figs. 23 and 24). After being pre-charged by X-ray, these samples emitted tunable PersL due to characteristic transitions in relevant lanthanide dopants (Supplementary Figs. 25–27). After the PersL faded out in one and a half days, all samples presented trap-controlled ML, nearly covering the whole spectral range from 200 to 1700 nm (Fig. 3g and Supplementary Figs. 28–31).
Mechanistic investigation of multi-stimulated emission
The self-recoverable ML was previously observed in some asymmetric materials like CaZnOS:Mn2+ and ZnS:Mn2+ due to piezoelectricity28,63. Accordingly, we conducted the piezoresponse force microscopy (PFM) tests to check the piezoelectric effect. Pure SrF2 did not show any piezoelectric properties due to the centrosymmetric nature (Supplementary Fig. 32). Nevertheless, piezoelectric hysteresis and butterfly loops appeared for SrF2:Pr3+ during the PFM measurements, indicating that the introduction of Pr3+ disrupted the local symmetry of SrF2 and thereby endowed SrF2:Pr3+ with local piezoelectric properties (Supplementary Fig. 33). The PFM results verify the arise of piezoelectric potential in the ML process.
It should be noted that, in addition to the piezoelectric effect, triboelectrification has recently been considered as another key mechanism for ML. A notable feature of triboelectrification-induced ML is that the ML intensity exhibits a strong dependence on the triboelectricity of the embedding substrates (Supplementary Table 4). Accordingly, we assessed the ML intensity of SrF2:Pr3+ particles embedded in a series of polymer substrates (Fig. 4a). The results show that SrF2:Pr3+@polydimethylsiloxane (PDMS) presented the strongest ML as PDMS has the best negative triboelectricity than ER (epoxy resin), PU (polyurethane) and SG (silicon gel), consistent with the previously reported results (Supplementary Table 4). The above observations indicate that the triboelectric effect is also responsible for the ML from SrF2:Pr3+. The conclusion was further corroborated by green-emitting SrF2:Tb3+ (Fig. 4a).
Fig. 4: Mechanistic study of SrF2:Pr3+.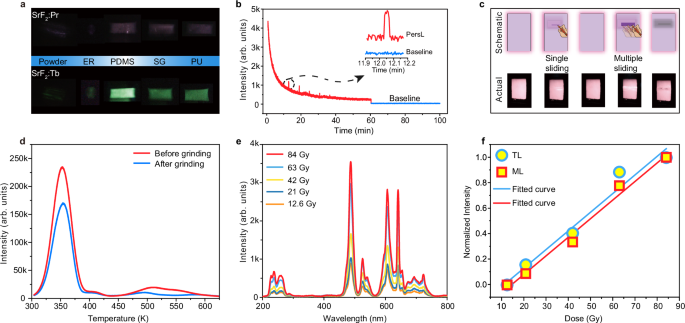
a Photographs of SrF2:0.5%Pr3+ powder and SrF2:0.5%Pr3+ embedded in different polymers, including epoxy resin (ER), polydimethylsiloxane (PDMS), silicon gel (SG) and polyurethane (PU), under mechanical action. b Persistent luminescence (PersL) decay curve of SrF2:0.5%Pr3+ after stoppage of 5-min X-ray irradiation. Inset: enlarged PersL signal upon stimulation of external force. c Photographs of SrF2:0.5%Pr3+ upon single- and multiple-sliding during the PersL process. d Thermoluminescence (TL) curves of SrF2:0.5%Pr3+ before and after grinding for 20 min. e Mechanoluminescence (ML) spectra of SrF2:0.5%Pr3+ after different X-ray exposure dose. f Normalized TL and ML intensities of SrF2:0.5%Pr3+ as a function of X-ray irradiation dose. Source data are provided as a Source Data file.
To gain insight into the trap-controlled ML mechanism after X-ray charging, we measured the PL (λex = 440 nm, λem = 488 nm) and ML decay curves of SrF2:0.5%Pr3+ (Supplementary Fig. 34). The results reveal that the duration time of ML is three orders of magnitude larger than that of PL. The observation supports the trap-controlled nature of the ML behavior, which involves the release and migration of charge carriers, thus taking a significantly longer time than PL (Supplementary Fig. 35). In line with the mechanically induced release of trap carriers, a transient enhancement of emission was detected at the PersL stage upon stimulation of external force (Fig. 4b). After repeated force stimulation, a notable dimming in PersL occurred at the location where the force was applied along with a significant decrease in the TL intensity (Figs. 4c, d). At the same time, the ML intensity constantly decreased. These results indicated that the PersL and ML originated from the same trapped charge carriers that can be released by both heat and force.
To shed more light on the multi-stimulated luminescence, the trapped charge carriers were adjusted by regulating the X-ray dose. With the increase of charging time, the ML intensified gradually (Fig. 4e). The observation is as anticipated due to the increased population in trap states, as confirmed by TL measurement (Supplementary Fig. 36). After performing the integral calculation, we clearly demonstrated the positive correlation of ML and TL intensities (Fig. 4f). As PersL is also closely related to TL, it is not difficult to understand that the stronger the PersL, the stronger the ML typically is (Supplementary Figs. 37 and 38). These observations provided additional evidence that the PersL and ML originated from the same trapped charge carriers. According to the TL spectra, we determined continuously distributed traps (Supplementary Figs. 39 and 40). The XRD pattern of SrF2:Pr3+ was essentially unchanged upon exposure to X-ray (Supplementary Fig. 41), suggesting that the traps of SrF2:Pr3+ were not due to the macro-structural change. We thus ascribe the trap states to intrinsic defects resulting from aliovalent doping. Our theoretical calculations (Supplementary Fig. 42 and Table 5 and Note 1) suggest that the substitution of two Pr3+ ions for two Sr2+ sites most likely occurred, resulting in one consequent Sr2+ vacancy. Moreover, fluorine vacancies and interstitials were expected to be generated in the fluorides under X-ray irradiation according to previous reports. Therefore, there were abundant defects in SrF2:Pr3+ to trap charge carriers64,65,66.
Far-UVC emission for solar-blind imaging
We designed a quick response (QR) code made of SrF2:0.5%Pr3+ and put it on the surface of high-valued goods. During X-ray inspections, the QR code was charged. After inspections, the QR code emitted both UVC and visible PersL that could be recorded separately by solar-blind and common cameras (Fig. 5a), providing a dual-layer anti-counterfeiting verification. Furthermore, even if the QR code’s PersL diminished over time, the QR code could still be captured by a typical smartphone under mechanical stimulation (Supplementary Fig. 43). By incorporating such a unique QR code on product packaging, counterfeiting and illegal transportation can be prevented to a great extent.
Fig. 5: Optical imaging through far-UVC emission of SrF2:Pr3+.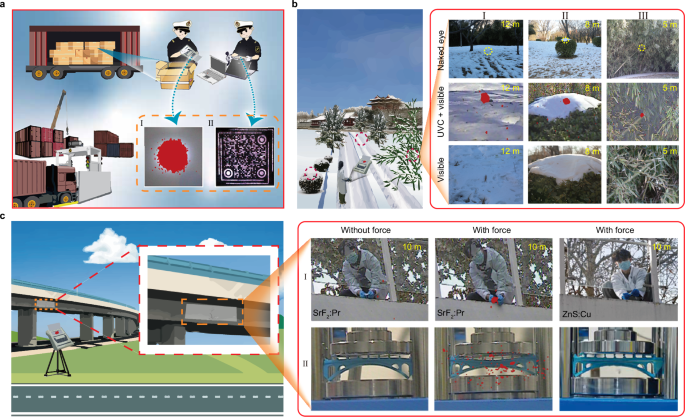
a Customs inspection. I and II show the photographs of SrF2:Pr3+ coated on the surface of goods after X-ray inspections, captured by collecting the UVC and visible emissions, respectively. b Solar-blind marking. The right panel presents the images of different complex scenarios that contain the SrF2:Pr3+ tablets, captured by using the visible or UVC+visible channel of a solar blind camera. c Structural health monitoring. The right panel shows the photographs of SrF2:Pr3+@polydimethylsiloxane and ZnS:Cu2+@polydimethylsiloxane films, as well as SrF2:Pr3+@photopolymer resin and ZnS:Cu2+@photopolymer resin under force stimulation by using the visible or UVC+visible channel of s solar blind camera.
Another important application for the UVC emission of SrF2:Pr3+ is high contrast marking. We prepared a series of SrF2:Pr3+ tablets with a diameter of 13 mm (Supplementary Fig. 44). As the samples are visually small and white, they are almost imperceptible to the naked eyes when placed in complex backgrounds such as in bamboo forests, holly bushes or snow. However, the positions of SrF2:Pr3+ tablets can be clearly identified by using a solar blind camera to capture the UVC PersL signal (Fig. 5b). We further constructed an array by mixing SrF2:Pr3+@PDMS with SrF2@PDMS (Supplementary Fig. 45). After X-ray irradiation, the pattern ‘Pr’ was captured using the combined UVC and visible channel of solar blind camera. This method enables advanced marking techniques.
Health monitoring of engineering structures such as bridges and buildings is important for preventing structural failures that can lead to major disasters and economic losses. SrF2:Pr3+ holds important value for remote and real-time structural monitoring. We simulated two scenarios to illustrate the superiority of UVC photons. One involved directly pulling the SrF2:Pr3+@PDMS film coated on the surface of a real bridge (Fig. 5c-I), while the other involved compressing the SrF2:Pr3+@PDMS film coated on the surface of a 3D-printed bridge model (Fig. 5c-II). When external force was applied to the SrF2:Pr3+@PDMS film, the UVC emission was clearly captured in high contrast even in a bright environment. In this way, structural damage to the building, such as cracks, could be promptly collected and warned to prevent accidents and ensure safety. As a control experiment, we also employed the well-established ZnS:Cu2+ with visible emission to replace SrF2:Pr3+ for the above demonstrations. Expectedly, no green ML could be observed due to the strong interference of background light, including intense outdoor sunlight and indoor lighting sources, although super bright ML was observed in dark environments (Supplementary Fig. 46). Considering the remarkable anti-interference capability of UVC photons, our samples are expected to unlock more applications such as emergency rescue (Supplementary Fig. 47). As the multi-stimulated luminescence can be substantially tuned across the full spectrum by doping different lanthanides, these materials also hold significant promise for information security and other advanced applications (Supplementary Figs. 48–51 and Note 2).