Samples
A total of 133 P. vivax field isolates were obtained between 2016 and 2021 from symptomatic patients originating from ten sub-Saharan African countries. Samples were collected locally at health centers in Ethiopia (N = 66), Madagascar (N = 27), Mauritania (N = 2), and Angola (N = 12). Additional DNA extracts were obtained from symptomatic travelers returning to France from the Comoros (N = 8), Mauritania (N = 5), Djibouti (N = 3), Sudan (N = 3), Madagascar (N = 2), Eritrea (N = 2), Ethiopia (N = 1), Burundi (N = 1), and Egypt (N = 1).
We amplified P. vivax DNA using sWGA to address the challenge of low parasitemia in clinical samples and successfully sequenced 72/133 P. vivax genomes using high-throughput sequencing. Among the successfully sequenced genomes, 18/72 (25%) were from homozygous Duffy-positive patients, 52/72 (72.3%) were from heterozygous Duffy-positive patients, and 2/72 (2.7%) had undetermined Duffy status. Despite our efforts, P. vivax genome sequences from 18 homozygous Duffy-negative patients could not be properly exploited due to insufficient parasitemia levels, which resulted in low DNA amplification and inadequate sequencing quality (see “Methods” for details). This limitation highlights the ongoing technical challenges in obtaining high-quality genomic data from Duffy-negative individuals, an issue that remains a bottleneck for understanding potential adaptations of P. vivax to these hosts.
To expand the scope of our analysis, we enriched our dataset with 204 publicly available P. vivax genome sequences from prior studies. These included sequences from Southeast Asia (Cambodia, Thailand, Vietnam), the Pacific Coral Triangle (Indonesia, Malaysia, Papua New Guinea), South America (Brazil, Colombia), and Africa (Ethiopia, Madagascar, Mauritania). Full details, including sample metadata and references, are provided in Table 1 and Supplementary Information (Table S1).
Table 1 List of P. vivax field isolates sequenced in this studyGenomic data
We aligned the sequencing reads to the PvP01 (v.48) reference genome using bwa mem and used GATK 4.0 (Genome Analysis Toolkit) following best practices guidelines to identify Single Nucleotide Polymorphisms (SNPs). Genotypes were defined in diploid mode. To ensure robust variant calling, we applied hard filtering based on several summary statistics. Variants were excluded if they met any of the following criteria: QD 3.0, FS > 60.0, MQ S1.
The final dataset retained >300,000 SNPs across 276 samples (72 newly sequenced samples from this study and 204 sequences from previously published datasets). To assess the presence of polyclonal infections, we evaluated within-host diversity by calculating Fws coefficients24. Empirically, isolates with Fws Fws > 0.95 are expected to be monoclonal. This analysis revealed that approximately one-third of the isolates (32.4%) could be classified as polyclonal (Tabel S2 and Fig. S2). This finding corroborates previous studies showing that P. vivax infections in Southeast Asia and South America are frequently characterized by multiple clones8,25,26,27,28. For subsequent analyses, polyclonal infections were excluded to avoid biases in heterozygosity, while complementary analyses including both monoclonal and polyclonal infections were conducted and reported in the Supplementary Information to assess the robustness of the results (Fig. S3).
Global genetic diversity
The population structure of P. vivax isolates was characterized by low levels of admixture overall, with clear geographic genetic clusters identified (Fig. 1A). Isolates from South America (Brazil and Colombia) exhibited more ambiguous clustering profiles, suggesting some degree of admixture that requires further investigation with a larger sample size.
Fig. 1: Global genetic diversity of P. vivax populations.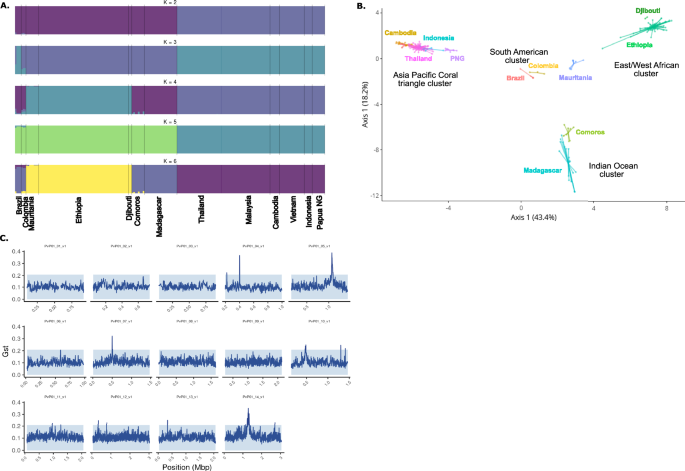
A Structural analysis of chromosomes. B Principal Coordinate analysis (PCO). C Genome-wide genetic differentiation with genomic islands.
The Principal Coordinate Analysis (PCO) corroborated the genetic clustering and revealed four distinct geographic groups (Fig. 1B): an East/West African cluster (Ethiopia, Djibouti, Mauritania), an Indian Ocean cluster (Madagascar, Comoros), an Asian/Pacific Coral Triangle cluster (Cambodia, Indonesia, Malaysia, Papua New Guinea, Thailand, and Vietnam), and a South American cluster (Brazil, Colombia), which appeared centrally positioned relative to the other three clusters.
Among the sub-Saharan African samples, we observed a notable distinction between the two African subpopulations: the East/West African cluster (Ethiopia, Djibouti, Mauritania) and the Indian Ocean cluster (Madagascar, Comoros). Notably, the Indian Ocean cluster was genetically closer to the East/West African cluster than to the Asian/Pacific cluster, suggesting significant historical or contemporary gene flow between these African populations.
This observation contrasts with the assumption of a unique Indonesian origin for the P. vivax population in Madagascar29. While past human migrations have been proposed as a major driver of P. vivax population structure6,30, our results suggest that the genetic landscape in Madagascar may reflect a more complex history, potentially involving multiple introductions and subsequent gene flow between African and Indian Ocean populations. These findings align partially with previous studies but highlight the need for larger sample sizes and deeper analyses to refine our understanding of the genetic origins and population dynamics of P. vivax in Madagascar and the surrounding regions.
Genomic islands of genetic differentiation
We investigated whether the low frequency of Duffy antigens in human populations across sub-Saharan Africa might exert selective pressure on P. vivax parasites, potentially favoring adaptations enabling Duffy-independent invasion pathways. To test this hypothesis, we performed a genome-wide analysis of genetic differentiation using pairwise comparisons of P. vivax sequences from multiple regions. We identified eight genomic regions with clear peaks of differentiation on chromosomes 4, 5, 7, 10, 11, 12, 13, and 14 (Fig. 1C). These regions contained genes with diverse functions, including loci involved in metabolic pathways, cellular components, and genes of unknown function (Table 2). Interestingly, we observed signals in three genes previously associated with antimalarial drug resistance: mdr-1 (PVP01_1010900), dhfr (PVP01_0526600), and dhps (PVP01_1429500). These findings likely reflect differential drug pressures acting on P. vivax populations worldwide, consistent with observations from other studies25,26,27. Importantly, no significant signals were detected in genes encoding parasite ligands directly implicated in erythrocyte invasion pathways, such as PvDBP or members of the PvRBP family, which would have suggested adaptations for Duffy-independent invasion. However, one notable exception was a signal detected in the thrombospondin-related anonymous protein gene (TRAP) (PVP01_1218700), located on chromosome 12. This protein is known to be expressed in P. vivax sporozoites and plays a critical role in the invasion of human hepatocytes31,32. While this signal may not directly relate to erythrocyte invasion, it highlights the potential involvement of P. vivax genes in other stages of the parasite’s lifecycle. Taken together, our results suggest that the global genomic structure of P. vivax populations reflects consistent patterns of differentiation, likely driven by geographic and environmental pressures, including drug pressure. Although no evidence was found for specific genetic adaptations to Duffy-independent invasion in the regions examined, these findings underscore the complexity of P. vivax evolution in regions where Duffy negativity predominates. Future studies incorporating larger datasets of high-quality genomes from Duffy-negative individuals will be essential to conclusively identify loci under selection for alternative invasion pathways.
Table 2 List of genes falling within the identified genomic islands showing clear peaks of differentiation in eight genomic regions on chromosomes 4, 5, 7, 10, 11, 12, 13, and 14Genetic diversity of genes associated with drug resistance
In the African P. vivax population, we detected four single non-synonymous mutations (P33L, C49R, N130K, A255T) in the bifunctional dihydrofolate reductase-thymidylate synthase gene (PVP01_0526600) in samples from Madagascar, Comoros, and Mauritania. The C49R mutation, only found in Madagascar (18/23), was the most common mutation (26%). The P33L mutation was detected in samples from the Comoros (1/6), the N130K mutation in samples from Madagascar (3/23) and the A255T mutation in samples from Mauritania (1/3). No such mutations were found in samples from Ethiopia and Djibouti.
Analysis of mutation points in the hydroxymethyldihydropterin pyrophosphokinase-dihydropteroate synthase gene (PVP01_1429500), likely associated with sulfadoxine resistance, revealed the presence of five different non-synonymous mutations (E142G, M205I, G383A, I545T and A647V) in varying proportions. The three most common mutations were G383A (36/68) from 4 countries, followed by M205I (30/68) from 3 countries, and E142G (25/68) from 2 countries. The E142G, I545T and A647V mutations were country-specific: E142G in Ethiopia and Djibouti (24/34 and 1/1, respectively), I545T in Mauritania (1/3) and A647V in the Comoros (1/6) and Ethiopia (10/34). The M205I and G383A mutations were found in varying proportions in all countries except in samples from Madagascar in which we did not find M205I mutations. Three triple mutant alleles were observed including the E142G/M205I/G383A (15/68, mainly in Ethiopia 14/15), the E142G/M205I/A647V (10/68, only in Ethiopia 10/34) and the M205I/G383A/I545T (1/68, Mauritania). We also found two double mutant alleles, the M205I/G383A (4/68) and the G383A/A647V (1/68).
For the ABC transporter B family member 1 – multidrug resistance protein 1 gene (PVP01_1010900), which is thought to modulate parasite susceptibility to amino-4 and amino-alcohol quinolines, five-point mutations were found (F194Y, S698G, L845F, F976Y and T1269S). The F976Y mutation was the most common mutation (34/68) and was found in high proportions in Mauritania (3/3), in Ethiopia (30/34) and in Djibouti (1/1). The F194Y mutation was found only in samples from Madagascar (1/24), the S698G mutation was observed in samples from Mauritania (1/3) and Ethiopia (1/34) and the L845F mutation only in Mauritania (2/3). Two double mutant alleles were observed including the S698G/F976Y (7/68, mainly in Ethiopia 6/34) and the L845F/F976Y (2/68, Mauritania 2/3). More details are given in the Supplementary Information (Table S3).
Genetic diversity of invasion-related genes
We then restricted our analysis to regions containing genes validated or suspected to encode parasite ligands involved in reticulocyte invasion pathways25,26,27,33, such as the pvdbp, pvebp/pvdbp2, pvrbp2a, and pvrbp2b genes (Table S4). Only two mutations were found in the P. vivax Duffy binding gene (pvdbp, PVP01_0623800), the K277T (2/68) and the G830V (1/68). The K277T mutation was specific to samples from the Comoros (1/6) and Madagascar (1/24), while the G830V mutation was detected only in Mauritania (1/3). No mutations were detected in Ethiopia and Djibouti. Analysis of mutation points in the P. vivax erythrocyte binding gene (pvebp/pvdbp2, PVP01_0102300) revealed 7 non-synonymous mutations: D268N, E341K, K595N, I611F, E660K, V705L and F746I. The most common mutation was the I611F (8/68), found only in Comoros (1/6) and Madagascar (7/24). In Ethiopia, only the E660K mutation was detected at a low proportion (1/34), while no mutation was found in samples from Djibouti. The K595N mutation was specific for Madagascar (1/24) and the V705L mutation for the Comoros (1/6). The D268N mutation was found in Comoros (1/6), in Madagascar (1/24) and in Mauritania (1/3). Two double mutant alleles were found in Comoros and Madagascar (D268N/E341K) and in Mauritania (D268N/F746I).
No mutations were found in the reticulocyte binding protein 2a (pvrbp2a, PVP01_1402400) and the reticulocyte binding protein 2b (pvrbp2b, PVP01_0800700) genes in samples from Mauritania, Ethiopia, and Djibouti. In samples from the Comoros, the K112I mutation in the pvrbp2a gene and the S186N and D461G mutations in the pvrbp2b gene were detected once (1/6). The same mutations were found in samples from Madagascar, once for the K112I mutation in the pvrbp2a gene (1/24) and at higher frequencies for the S186N (6/24) and D461G (3/24) mutations in the pvrbp2b gene. The L84F in the pvrbp2b gene was unique to samples from Madagascar (5/24). More details can be found in the Supplementary Information (Table S4).
We also analyzed genetic differentiation by estimating Tajima’s D values at loci associated with invasion-related genes and comparing these values with those obtained for all individual genes across the genome. This analysis revealed that invasion-related genes from P. vivax populations in all regions fell well within the boundaries defined by other genes (Fig. 2A). In addition, a country-level comparison of Tajima’s D values across 13 populations confirmed that invasion-related genes did not exhibit patterns of differentiation distinct from the genome-wide average. Interestingly, values of Tajima’s D across all populations appeared shifted toward negative values, suggesting an excess of low-frequency alleles. This trend may indicate ongoing geographic differentiation at a finer scale, possibly driven by local demographic events, such as population expansions or recent bottlenecks, rather than by selective pressure on invasion-related loci.
Fig. 2: Genetic diversity of invasion-related genes.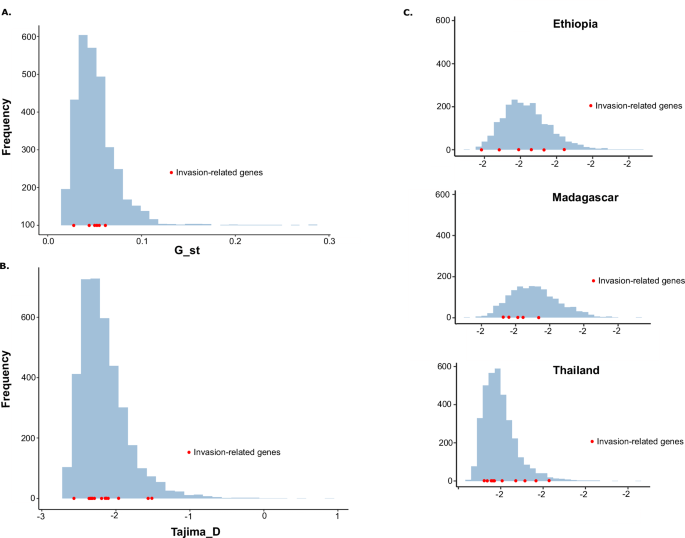
A Differentiation of invasion-related genes in all P. vivax populations. B Analysis of Tajima’s D within all countries. C Analysis of Tajima’s D in Ethiopia, Madagascar, and Thailand.
Overall, we found no evidence of selective pressure specifically acting on invasion-related genes in sub-Saharan P. vivax strains (Fig. 2B, C). These results suggest that while geographic structure may influence allele frequency patterns, it does not appear to impose measurable selection on genes linked to erythrocyte invasion pathways.
Genetic diversity associated with Duffy genotype in human hosts
We hypothesized that the Duffy status of patients (homozygous and heterozygous Duffy-positives, and homozygous Duffy-negative) might influence the diversity and selection of invasion-related genes in African P. vivax genomes. To test this, we conducted a Genome-Wide Association Study (GWAS) on sequences obtained from 18 isolates infecting homozygous Duffy-positive patients and 52 isolates from heterozygous Duffy-positive patients. The results of the GWAS showed no significant associations between the patient’s Duffy status and parasite genotypes at loci encoding invasion-related genes. Specifically, we did not observe any molecular signatures suggestive of adaptive evolution in these genes that could facilitate infection in Duffy-negative hosts (Fig. 3). These findings suggest that the evolution of African P. vivax populations may not be primarily driven by diversification or selection of invasion-related genes, at least within the resolution of our current analysis. Alternatively, adaptations to infect Duffy-negative individuals, if they exist, may involve molecular mechanisms too complex or subtle to be detected by broad-scale genomic association methods, particularly given the constraints imposed by the limited availability of high-quality Duffy-negative sequences.
Fig. 3: GWAS analysis.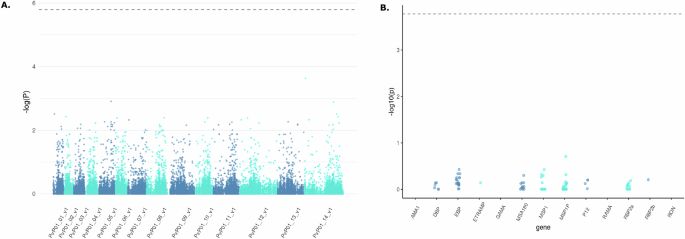
A GWAS analysis of sequences obtained from 18 P. vivax African isolates infecting homozygous Duffy-positive patients and 52 P. vivax African isolates infecting heterozygous Duffy-positive patients for invasion-related genes. Manhattan plot displaying the genome-wide association results. Each dot represents a single nucleotide polymorphism (SNP), plotted as the negative log10-transformed p value (−log10(P))(−log_{10}(P))(−log10 (P)) of the association test. The x-axis represents genomic regions, labeled as PvP01_01_v1 through PvP01_14_v1, corresponding to different chromosomes or contigs of the Plasmodium vivax genome. The dashed horizontal line indicates the genome-wide significance threshold. No SNPs surpassed the genome-wide significance threshold, suggesting that no variants showed statistically significant associations after multiple testing correction. B Association of genetic variants in selected genes with the phenotype of interest. Genes are displayed on the x-axis, and the dashed horizontal line indicates the genome-wide significance threshold. Genes include AMA1, DBP, EBP, ETRAMP, GAMA, MSA180, MSP1, MSP1P, P12, RAMA, RBP2a, RBP2b, and RON. No SNPs reached the genome-wide significance threshold in this analysis.
Overall, while our data do not rule out the possibility of Duffy-independent invasion pathways, they underscore the need for future studies incorporating higher-resolution genomic data from larger numbers of Duffy-negative infections to identify potential loci under selection and fully elucidate the evolutionary dynamics of P. vivax populations in Africa.