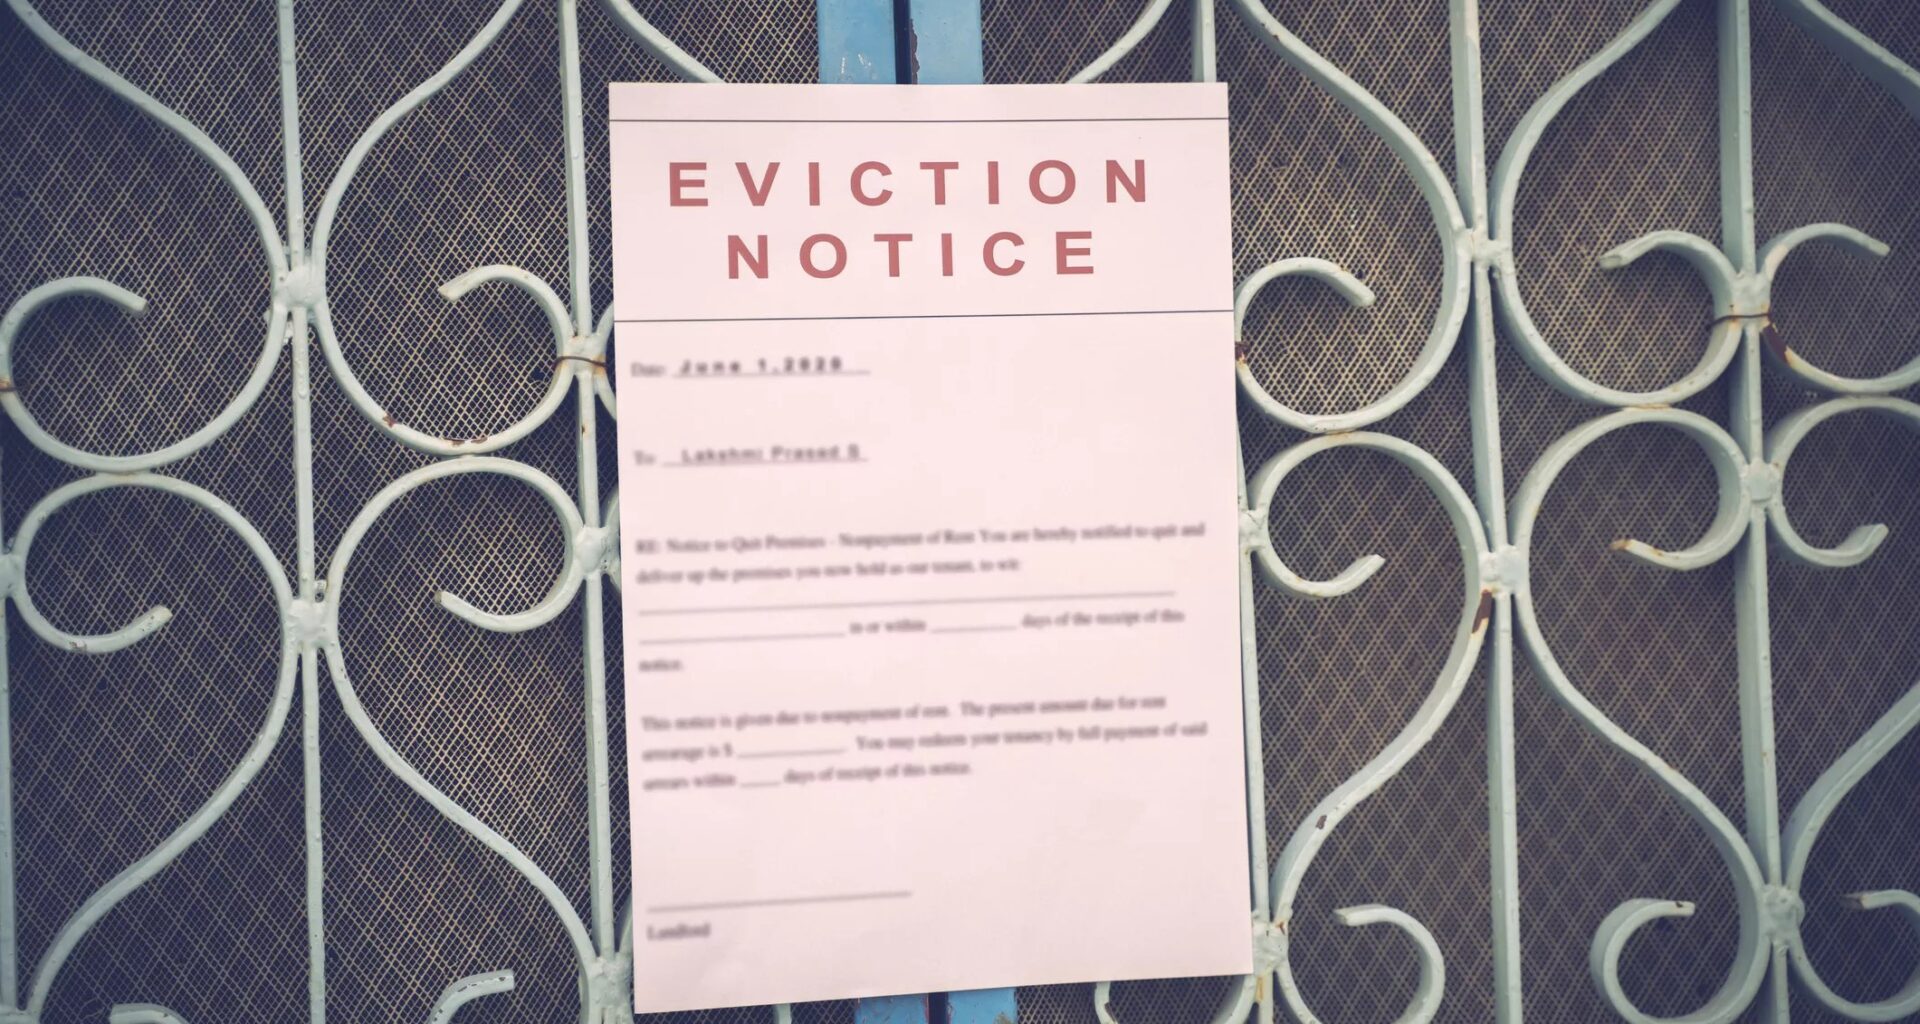
Maricopa County broke an eviction filings record in 2024.
lakshmiprasad S/Getty Images
Last year, Maricopa County broke a nearly 20-year-old record for the most eviction filings in a single year with 87,197. This year, eviction filings will likely fall just short of that number.
Through the end of November, there have been 77,710 evictions filed in Maricopa County – an average of 7,065 filings a month, according to data from the Justice Courts of Maricopa County. That’s short of last year’s record, which saw an average of 7,266 evictions filed per month. The county has not yet released eviction filing numbers for December. An eviction filing does not guarantee an eviction, although the deck is stacked significantly against tenants, who often lack the resources to challenge their evictions in court.
The thousands of evictions filed each month aren’t eventually distributed across the county of more than four million people. Several ZIP codes, often in lower-income areas, have seen thousands of eviction filings this year. Others — in rural ZIP codes such as 85087 (Morristown), 85139 (Mobile), 85320 (Aguila) and 85263 (far north Scottsdale) had zero eviction filings in 2025.
Which areas have been hit the hardest by evictions? Here are the top 10 ZIP codes by eviction filings this year, with data from the Justice Courts, U.S. Census Bureau and Zillow.
This year, make your gift count –
Invest in local news that matters.
Our work is funded by readers like you who make voluntary gifts because they value our work and want to see it continue. Make a contribution today to help us reach our $30,000 goal!
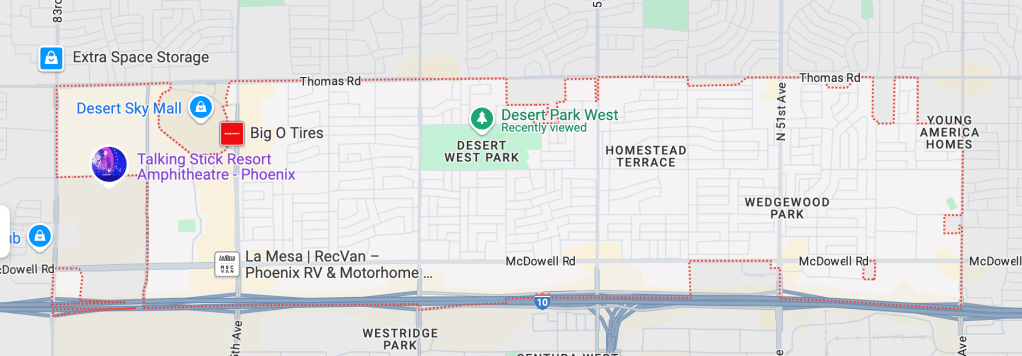
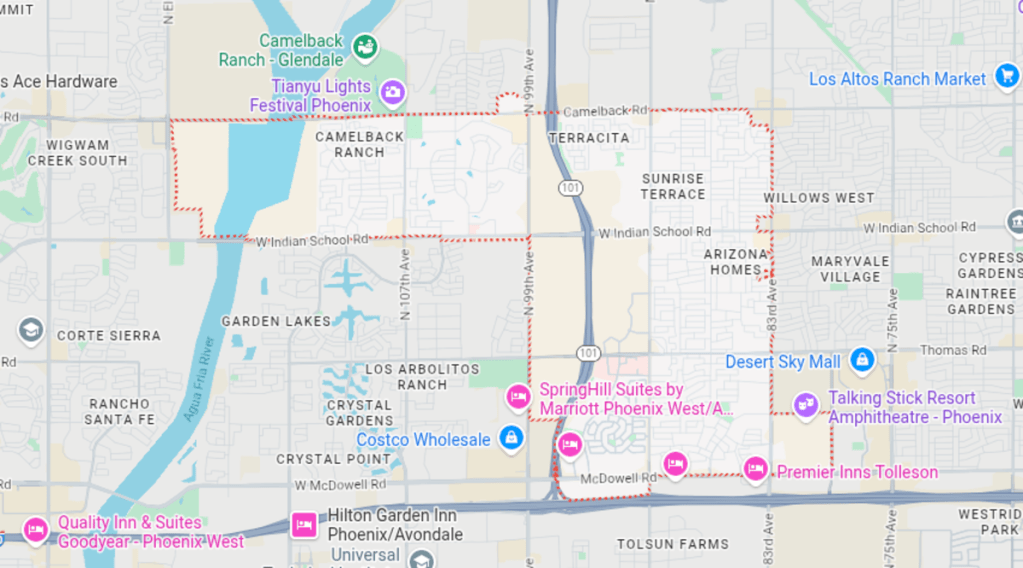
1. 85035 (Maryvale)
This 5.5-square-mile west Phoenix ZIP code, which saw the second-highest number of eviction filings in the Valley in 2022 and 2024, tops the list through November. The generally low-income area, in which more than one-fifth of residents live below the poverty line, is just north of Interstate 10. It surrounds Desert Sky Mall and includes Talking Stick Resort Amphitheatre.
Evictions in 2025: 2,644
Percentage of renters: 54%
Average rent: $1,675
Median household income: $57,790
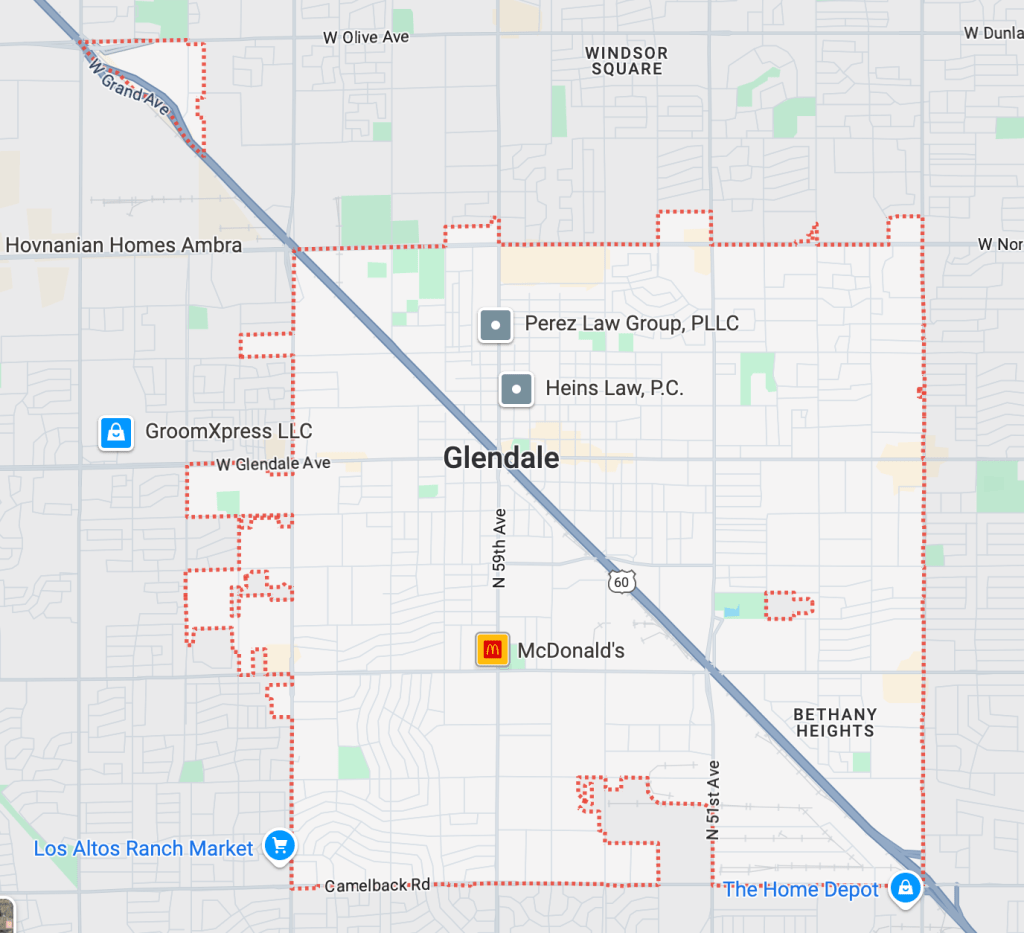
2. 85301 (Glendale)
This generally low-income area, which includes Glendale’s downtown and city center, has consistently had the highest number of annual eviction filings for years. This year, it comes a few short of the highest, but not by much. Nearly 40% of children in this 9.3-square-mile area fall below the poverty line.
Evictions in 2025: 2,445
Percentage of renters: 61%
Average rent: $1,447
Median household income: $47,422
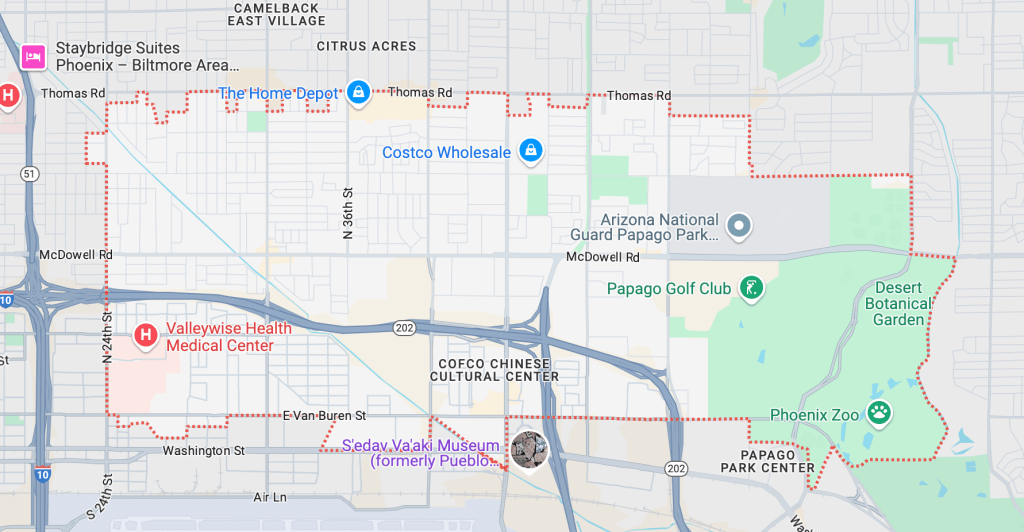
3. 85008 (Phoenix)
This 10-square-mile ZIP code experienced the third-highest number of eviction filings in the county for two consecutive years. It sits north of Phoenix Sky Harbor International Airport. Nearly 20% of residents live below the poverty line.
Evictions in 2025: 2,084
Percentage of renters: 69%
Average rent: $1,399
Median household income: $61,369
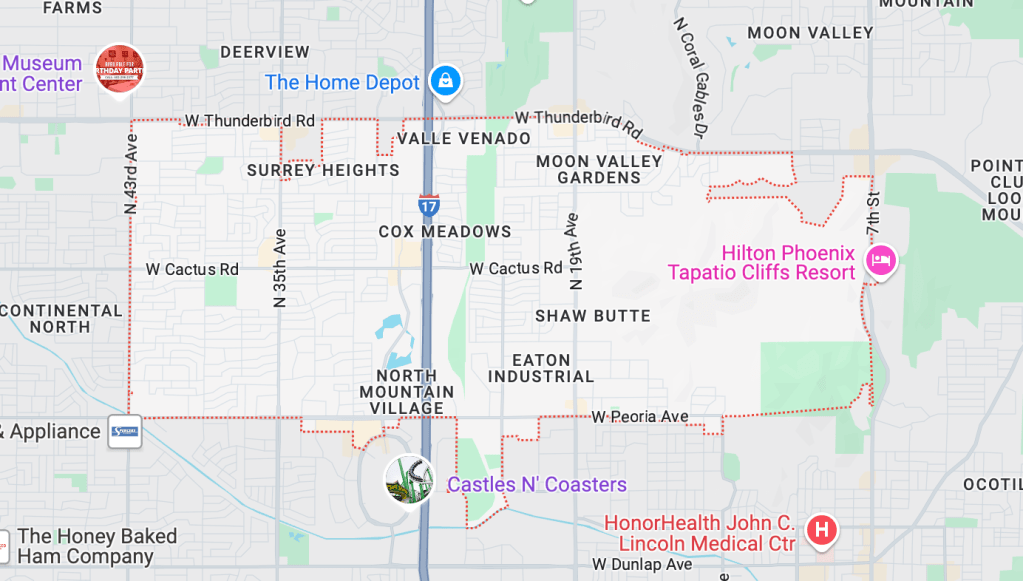
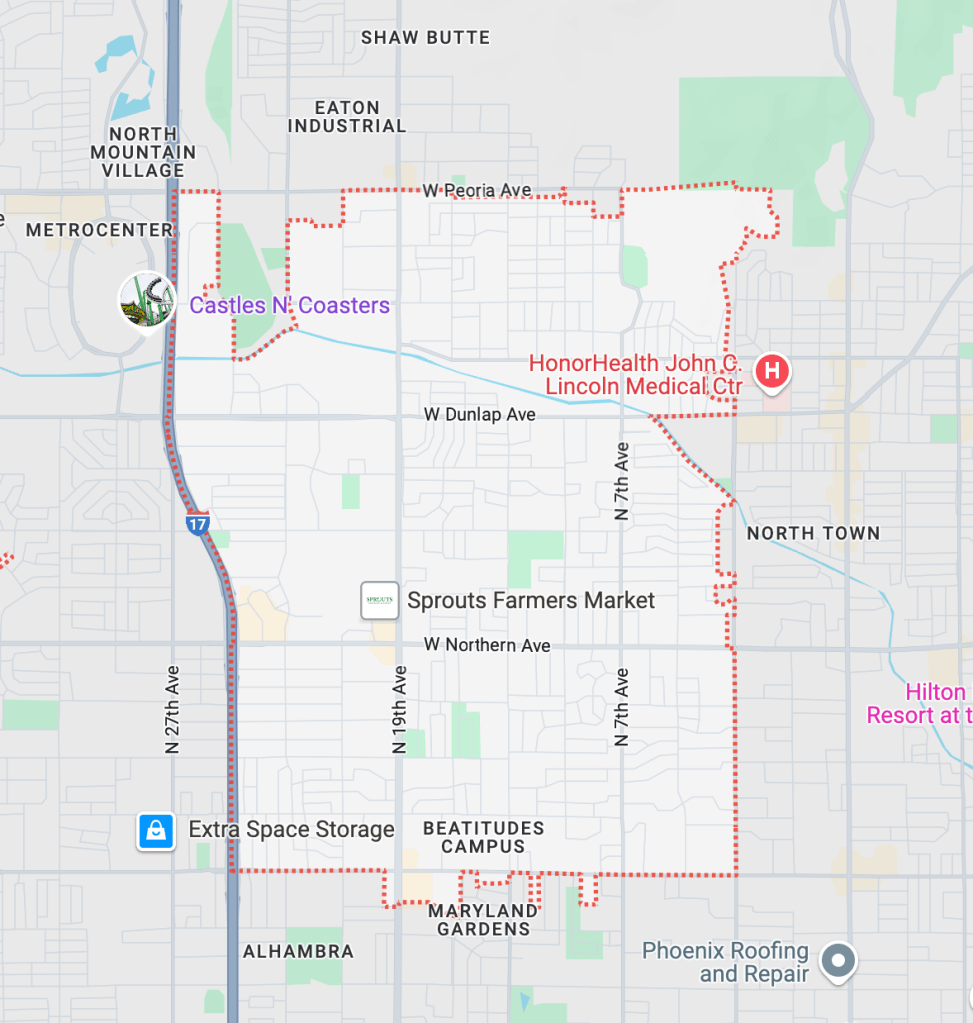
4. 85029 (Phoenix)
This 9.4-square-mile ZIP code encompasses parts of the Phoenix Mountains Preserve, including North Mountain. Last year, this area had the fifth-highest number of filings in the county.
Evictions in 2025: 1,974
Percentage of renters: 45%
Average rent: $1,649
Median household income: $60,384
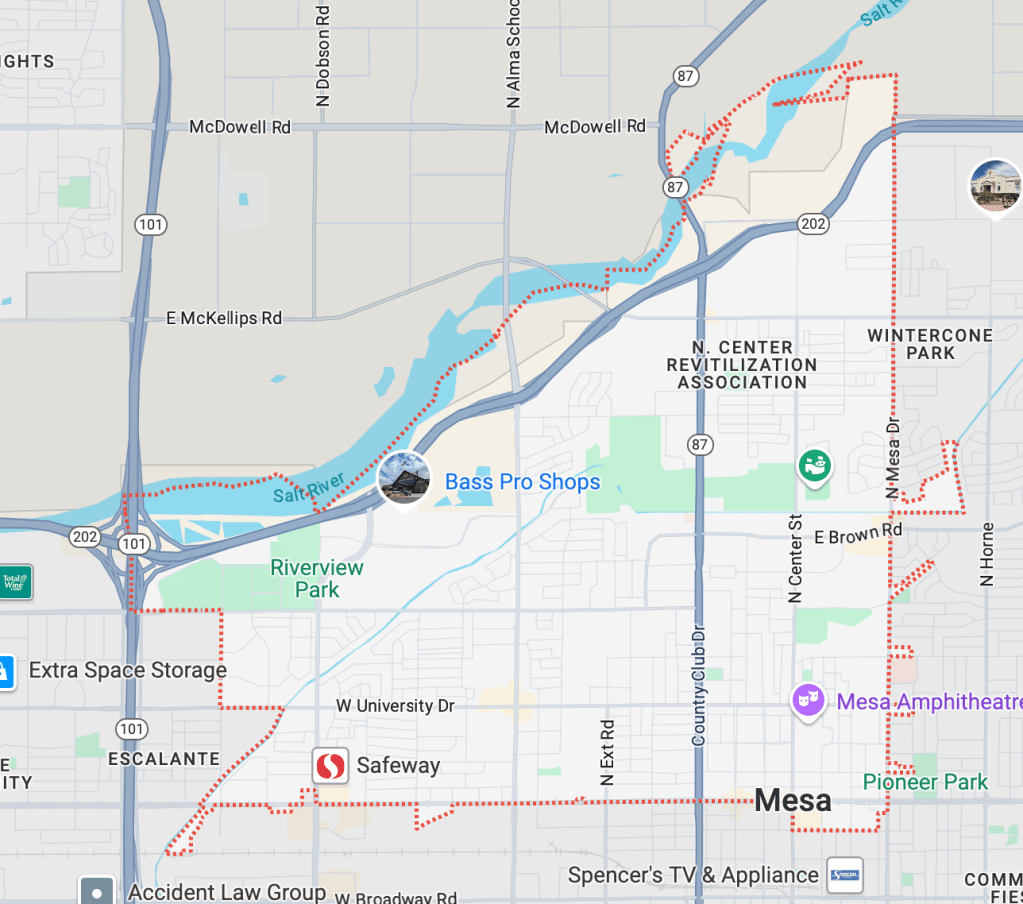
5. 85201 (Mesa)
This 9.5-square-mile ZIP code along the Loop 202 contains Mesa’s historic downtown district and two Cactus League ballparks. Last year, the area had the county’s fourth-highest number of filings.
Evictions in 2025: 1,826
Percentage of renters: 61%
Average rent: $1,295
Median household income: $63,725
6. 85037 (Phoenix)
This more than 8-square-mile ZIP Code is a new addition to the county’s top eviction filings list. Situated between Maryvale and Litchfield Park, it’s along both the I-10 and Loop 101. It also neighbors both of the ZIP Codes with the top eviction filings on this list.
Evictions in 2025: 1,773
Percentage of renters: 40%
Average rent: $1,900
Median household income: $81,919
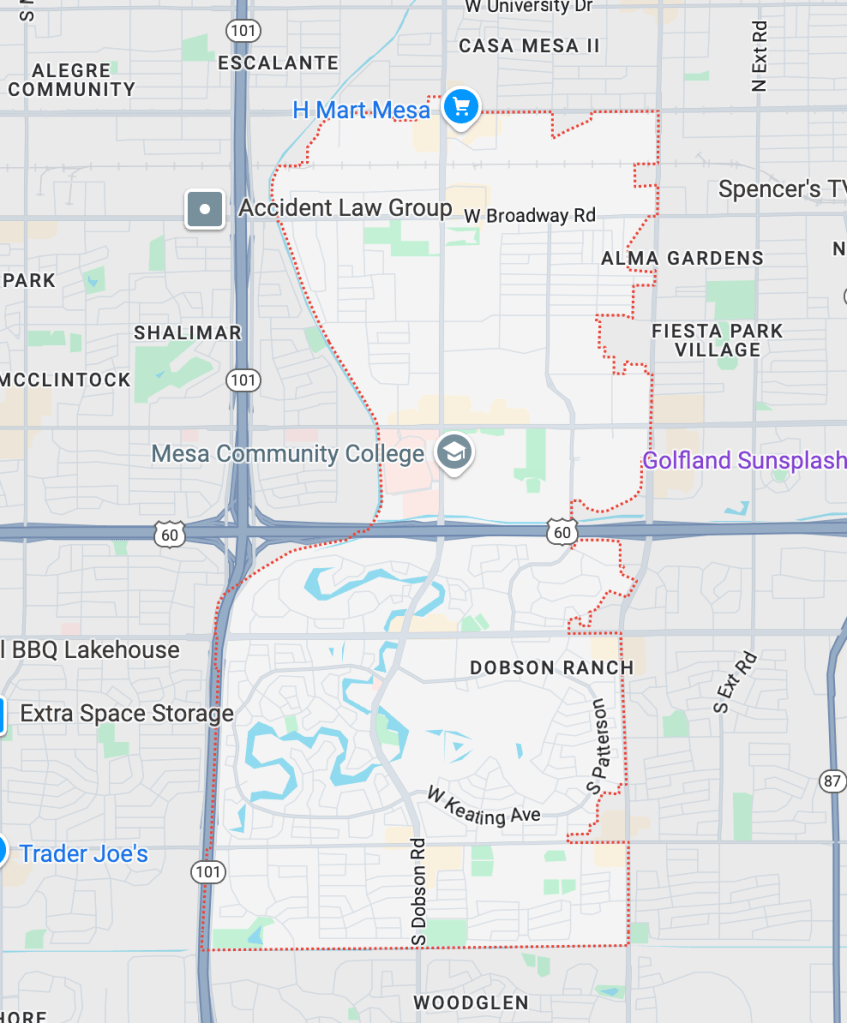
7. 85202 (Mesa)
This ZIP code includes Dobson Ranch Park, Banner Desert Medical Center, Mesa Community College and Mekong Plaza. Last year, this area was the ZIP Code with the eighth-highest number of eviction filings.
Evictions in 2025: 1,750
Percentage of renters: 50%
Average rent: $1,589
Median household income: $66,582
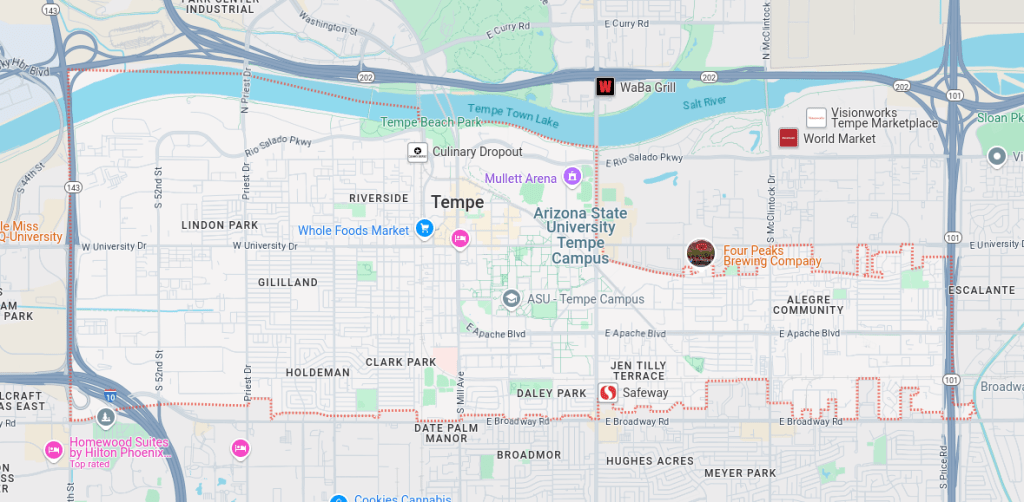
8. 85281 (Tempe)
This ZIP Code borders Tempe Town Lake and includes Arizona State University’s Tempe Campus, Tempe Beach Park and Tempe Center of the Arts. More than 27% of the nearly 71,000 residents in the 13-square-mile area live below the poverty line. It was the ZIP Code with the seventh-highest filings in 2024.
Evictions in 2025: 1,748
Percentage of renters: 76%
Average rent: $1,700
Median household income: $59,084
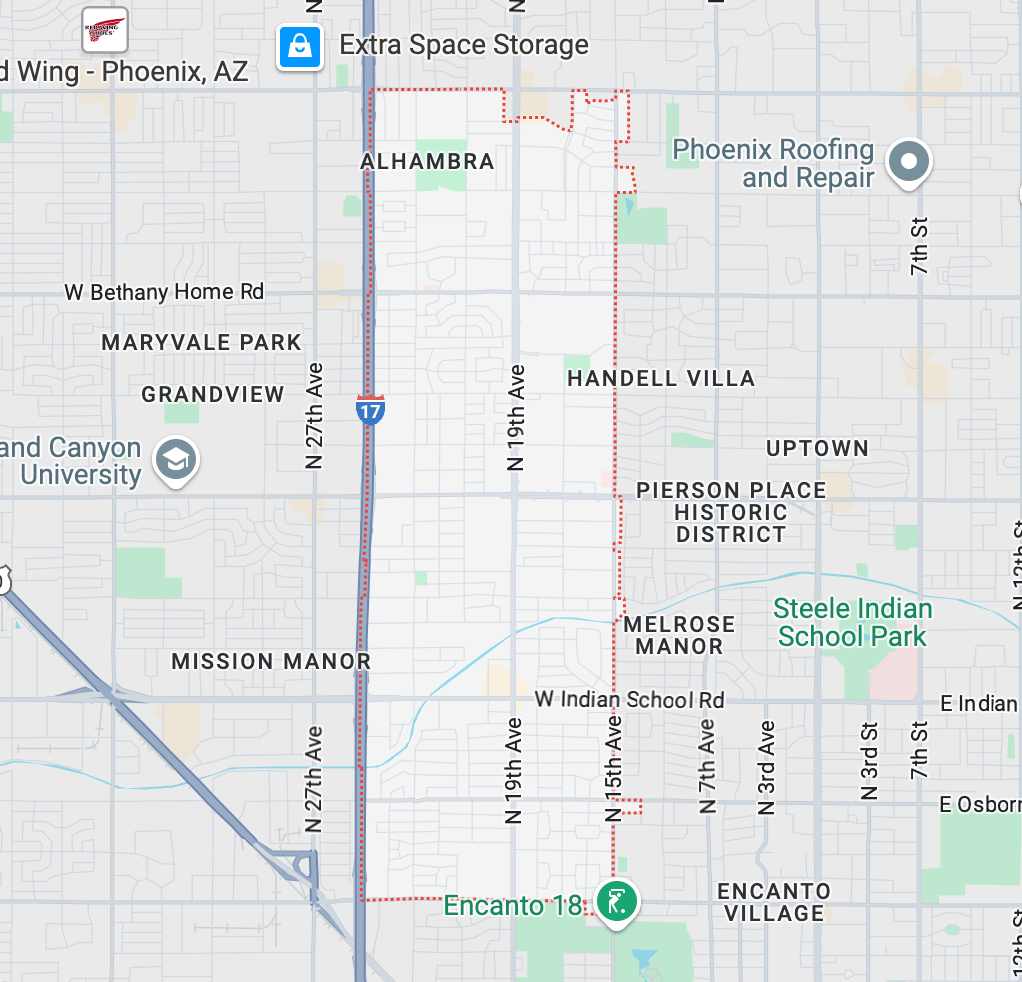
9. 85021 (Phoenix)
This ZIP code features many single-family homes and is bisected by the Arizona Canal Trail. It was the ZIP Code with the sixth-highest number of filings in 2024.
Evictions in 2025: 1,652
Percentage of renters: 62%
Average rent: $1,235
Median household income: $58,481
10. 85015 (Phoenix)
This ZIP code contains the Christown Spectrum mall. The almost 5-square-mile area is a high-poverty area, with more than 23% of the population falling below the poverty line.
Evictions in 2025: 1,639
Percentage of renters: 67%
Average rent: $1,295
Median household income: $52,585