A unique cohort of pure DCIS patients
We assembled a cohort of 147 pure DCIS patients treated with BCS, with or without subsequent RT, incorporating comprehensive genomic profiling through whole-exome DNA analysis of primary DCIS tumors and matched normal tissues (Table 1). The study design was balanced to include at least a third of patients who experienced an ipsilateral invasive or in-situ LR within a 10-year follow-up period and about half received radiotherapy as part of their standard-of-care (Table 1). In clinical settings, RT is omitted in some patients with low-risk features of DCIS or due to patient preference. The median time to recurrence was 4.2 years for invasive disease and 2.1 years for in-situ disease. Most tumors were of intermediate to high grade spanning all five molecular subtypes, with normal-like and luminal A subtypes more frequently observed in patients without LR within 10 years (Table 1). A minority of tumors exhibited multifocality (24.5%) and positive margins (6.8%). Clinical characteristics were comparable between RT-treated and untreated patients across all variables except age, with women aged 60 years or older less likely to receive RT (Supplementary Table 1).
Table 1 Patient and tumor clinical attributesMutational landscape of DCIS reveals distinct processes driving high mutational burden in early-onset cases
The mutational load of pure DCIS lesions varied considerably, ranging from. 3 to 3,482 non-synonymous variants per sample (median 75). The majority (74.2%) were missense mutations, constituting approximately 52K unique variants identified in ~ 14K genes. Most of these genes were not frequently mutated, with only 2,030 genes (14.5%) harboring non-synonymous aberrations in at least 5 patients.
As expected, most mutations are of C > T type (barplot in Fig. 1), a common mutational pattern attributed to the spontaneous deamination of 5-methylcytosine, a process frequently observed in many cancer genomes [21, 22]. Spontaneous deamination can be exacerbated in formalin-fixed paraffin-embedded (FFPE) samples due to DNA damage [23]. FFPE-related mutational artefacts are known to resemble certain COSMIC signatures [24], such as SBS30 and SBS1 [25]. During library preparation, formalin-induced DNA lesions are chemically repaired with unrepaired profiles resembling SBS30 and repaired profiles resembling SBS1 [25]. While SBS30 was not identified in our dataset, SBS1 was detected in a large number of samples (Fig. 1). SBS1, commonly found in tumor genomes, is difficult to distinguish from repaired FFPE-related artifacts due to their high similarity [22, 25]. However, previous research has demonstrated that mutational profiles from repaired FFPE samples closely match true tumor mutational profiles [25], and we expect that our careful processing of mutation calling-pipeline minimizes the impact of these artefacts [23].
Fig. 1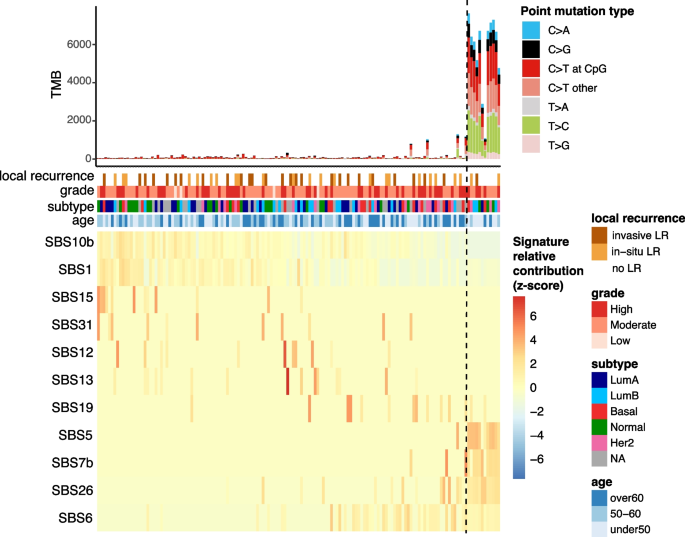
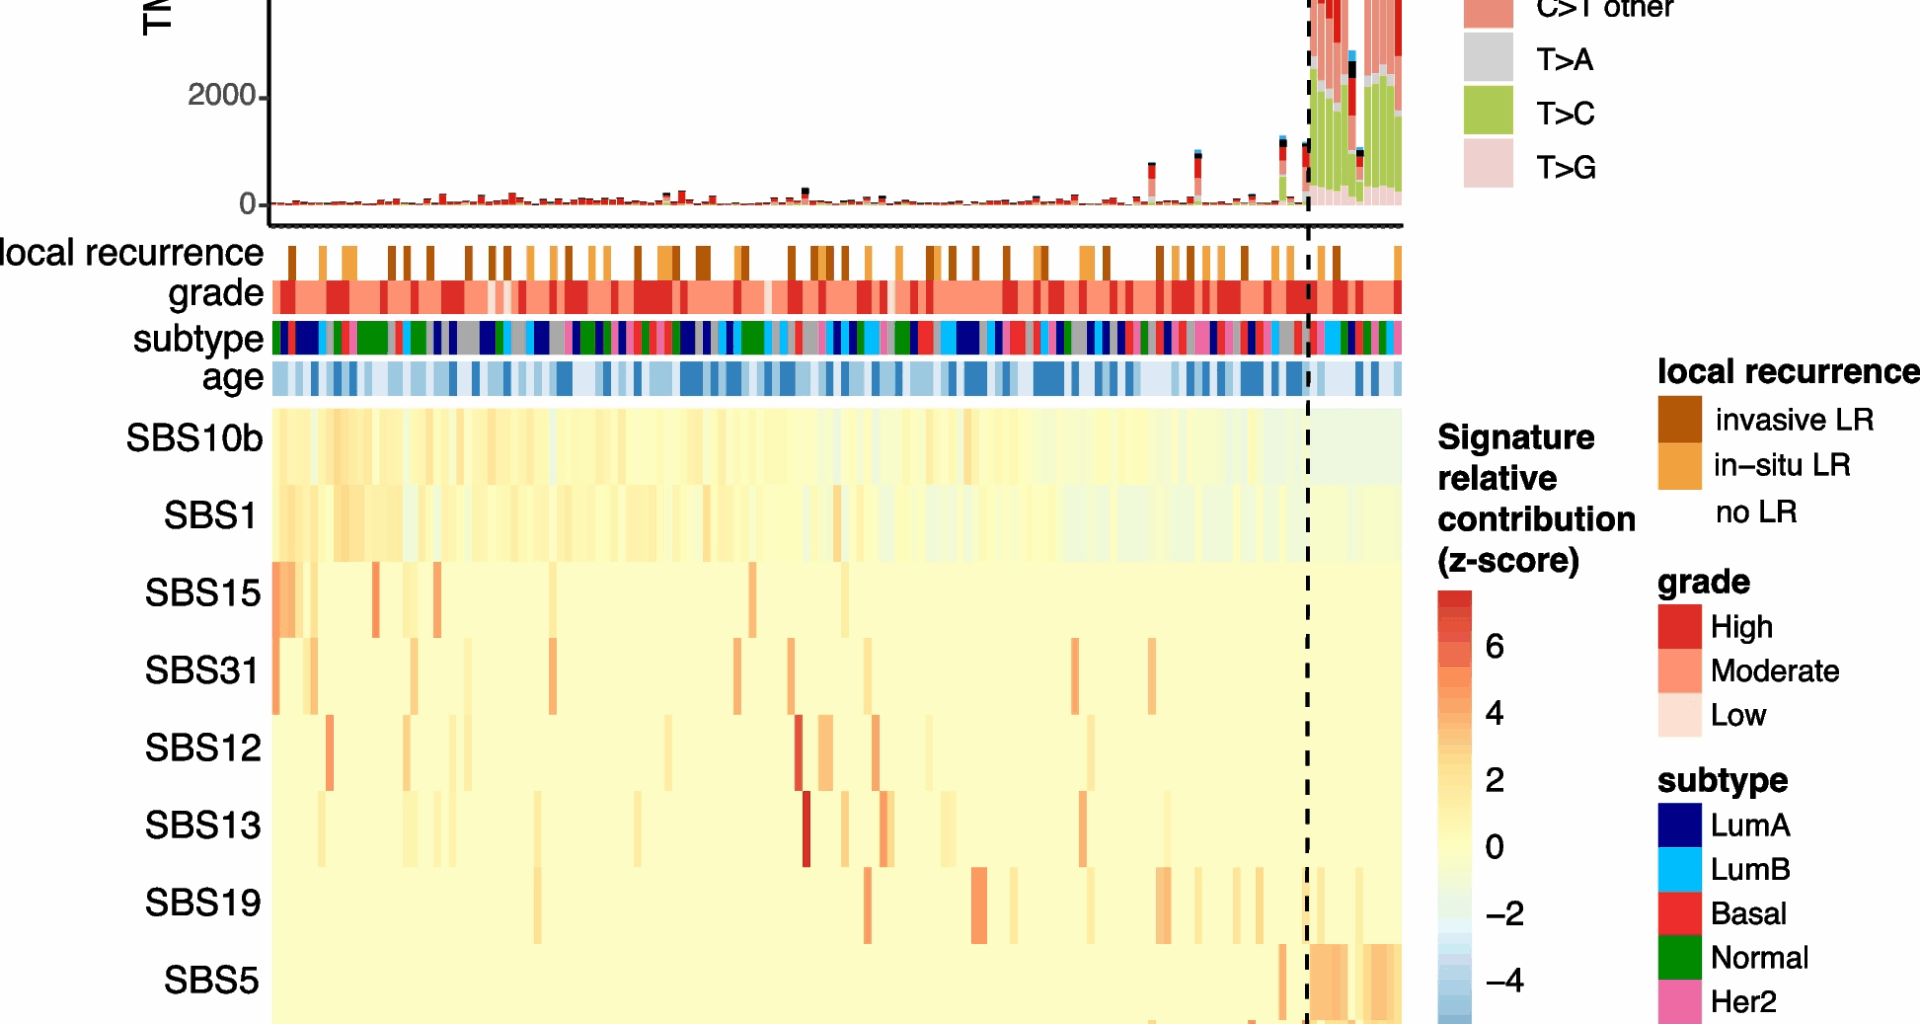
Mutational signatures in pure DCIS samples. The top panel shows tumor mutational burden (TMB) with distribution of point mutation types. Clinical annotations display 10-year local recurrence outcome, tumor grade, molecular subtype, and patient age. The bottom heatmap depicts the row-scaled relative contribution of single base substitution (SBS) signatures detected in at least 10 samples (z-score). Samples (columns) and signatures (rows) are ordered based on a rank-sum statistic that maximizes the coherence of contribution patterns. The method first splits signatures into two groups using medoid clustering. For each signature, relative contributions are ranked within each group, and the final sample ordering is determined by the average rank-sum across all signatures
Interestingly, a subset of DCIS samples exhibit a significantly higher tumor mutational burden (TMB), characterized by an increase in frequency of C > G, T > C, and C > A mutations, and enrichment of specific SBS signatures including SBS26, SBS7b, and SBS5 (Fig. 1, 12 samples on the right). The causes underlying these mutational signatures remain incompletely understood. However, SBS26 has been linked to impaired mismatch repair and microsatellite instability. These cases were not more likely to have a recurrence, of a higher grade or of a specific molecular subtype but were predominantly found in younger patients (8 out of 12 under 50 years; Chi-square test p-value
These findings highlight distinct mutational processes in some early-onset DCIS cases, though these molecular features were not associated with prognosis.
Pure DCIS is associated with high frequency of mutations in genes involved cell adhesion, polarity, tissue structure and function
Analysis of pure DCIS revealed distinct patterns of recurrent mutations across multiple genes (Fig. 2). PIK3CA was the most frequently mutated gene (15% of cases), followed by FSIP2 and KIR3DL3 (14%). We also identified functional gene groups among the most frequently mutated genes including several motor genes converting chemical energy to mechanical force (DNAH12, DNHD1, and MYOB15; 12% each), collagen genes (COL18A1 and COL4A3; 12% and 10%, respectively), and mucin genes (MUC3A, MUC4, MUC22, and MUC5AC) also showed alterations (10-12% of cases each). While mucin genes are typically large and can accumulate mutations by chance, these specific mucin genes were not identified as FLAGS (FrequentLy mutAted GeneS) and therefore not excluded in our analysis (See Methods). Given our stringent rules for mutation calling, these findings suggest that mutations in mucin and other genes controlling epithelial-components including cellular morphology, epithelial function and adhesion are central to the physiopathology of pure DCIS.
Fig. 2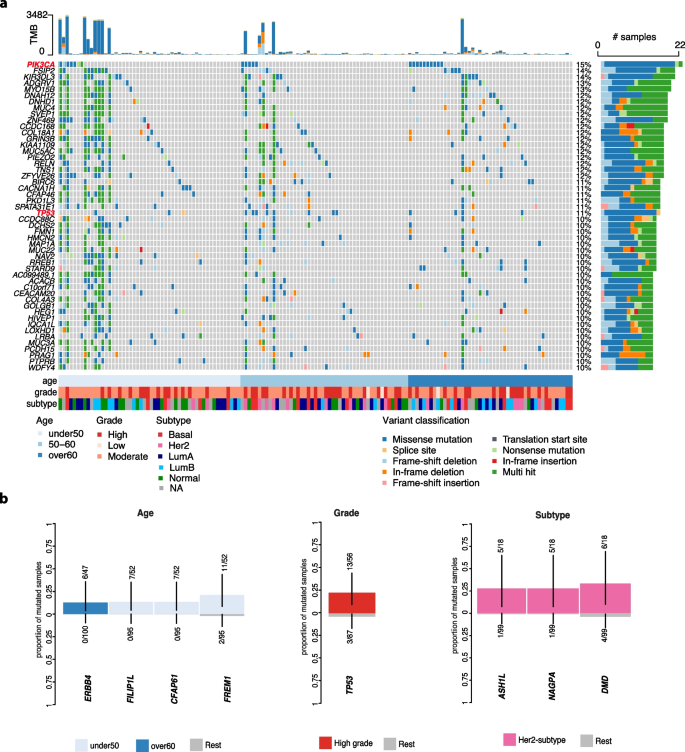
The most frequently mutated genes and association with clinico-pathological variables in pure DCIS patients. a The top 50 most frequent non-synonymous small variants identified in pure DCIS lesions. Samples are in columns and variants are color-coded based on their classification. The TMB for each lesion is displayed at the top of the heatmap. Samples are organized by age at diagnosis, with additional clinico-pathological features—grade and subtype—depicted at the bottom. b Mutated genes significantly associated with specific clinico-pathological variables (False discovery rate [FDR]
We also identified a few mutated genes enriched in distinct clinico-pathological groups including patients with early-onset DCIS (FILP1L, CFAP61, FREM1) or later-onset (ERBB4), high-grade lesions (TP53) and Her2-enriched subtype (ASH1L, NAGPA, DMD) (Fig. 2B).
Collectively, these findings highlight that pure DCIS harbors frequent mutations in genes governing tissue architecture and cell- cell interactions, suggesting these alterations may be fundamental to DCIS development.
Established cancer driver genes are present in pure DCIS but lack prognostic capacity
To identify potential cancer driver genes, we analyzed the ratio of non-synonymous to synonymous mutations (dN/dS) across all genes, which can indicate positive selection of mutations that provide growth advantages to cancer cells [26]. This analysis identified two significantly mutated driver genes in pure DCIS: PIK3CA and TP53 (FDR 2a, red-labelled genes). While PIK3CA mutations were not enriched in specific molecular subtypes, TP53 mutations were significantly more frequent in basal-like and Her2-enriched subtypes compared to other subtypes (19% in basal-like [4/21], 33% in Her2-enriched [6/18] vs 5% in other subtypes [4/78], Chi-square test p
Out of 34 samples carrying a mutation in at least one of these driver genes, 15 samples harbored at least one potentially actionable alteration as indicated by OncoKB (Supplementary Fig. 1). The mutation spectrum in PIK3CA was dominated by the activating H1047R hotspot mutation (~ 50%) in the kinase domain of exon 21, known to enhance PI3K-mitigated pathway signaling (Supplementary Fig. 1a) [27, 28]. Similarly, TP53 mutations clustered in known hotspots within the DNA-binding domain, which may result in the loss of tumor suppression by affecting its ability to bind to DNA (Supplementary Fig. 1b).
Despite their established roles in cancer progression, none of these driver mutations was associated with 10-year LR risk (Firth’s penalized likelihood Cox regression p-value > 0.5), suggesting that additional factors influence DCIS prognosis.
Identification of mutations associated with increased local recurrence risk regardless of treatment
To identify potential prognostic markers, we analyzed mutated genes associated with the risk of invasive or in-situ LR in the ipsilateral breast occurring between 6 months and 10 years after diagnosis. Our survival analysis identified five biomarkers each significantly associated with increased 10-year LR risk (Firth’s penalized likelihood Cox regression p-value p-value 3a-b). These mutations, occurring in 4-7% of cases, were largely mutually exclusive and occurred across molecular subtypes and grades.
Fig. 3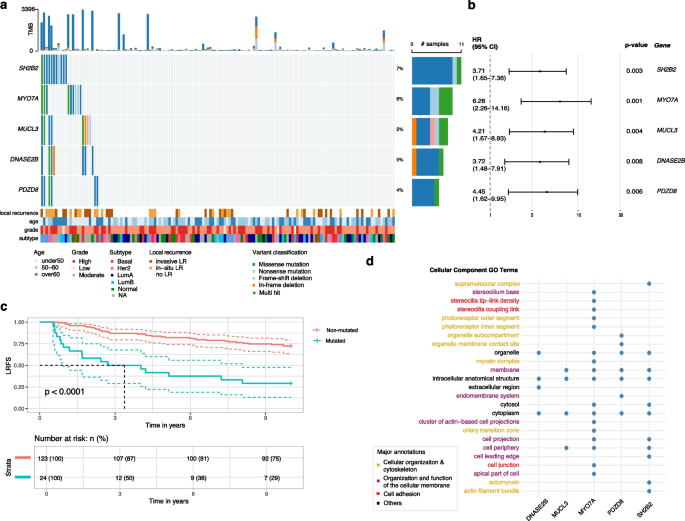
Gene variants associated with an increased 10-year LR risk in DCIS. a Samples are in columns and variants are color-coded based on their classification. LR status and clinico-pathological characteristics of each lesion are depicted at the bottom. LR is defined as any recurrence, in situ or invasive, in the ipsilateral breast occurring between 6 months and 10 years after diagnosis. Right-hand side reports the proportion of each variant classification type. b Hazard ratio and confidence intervals for each significant mutated gene associated with increased 10-year LR risk (Firth’s penalized likelihood Cox regression). c Kaplan–Meier analysis of local recurrence-free survival (LRFS) comparing patients with mutations in at least one of the 5 genes (red) versus those without mutations (blue). d Cellular component Gene Ontology (GO) terms annotations for each significant gene
The presence of mutations in at least one of these genes was significantly associated with increased recurrence risk (Fig. 3c, log-rank p-value p MYO7A and PDZD8 showing the strongest associations (Firth’s penalized likelihood Cox regression HR > 4.4, Fig. 3b). Gene Ontology analysis revealed that most genes are involved in multiple interrelated cellular processes including cell adhesion (MYO7A, SH2B2), organization and function of the cellular membrane (PDZD8, MUCL3, MYO7A), and cellular organization and cytoskeleton (MYO7A, PDZD8) (Fig. 3d). Additionally, DNASE2B, a member of the DNase II family of endonucleases, was identified among the significant genes. These findings underscore how cytoskeletal reorganization, changes in cell structure, and compromised cell adhesion might contribute to increased risk of recurrence within 10 years after a DCIS diagnosis.
Mutations in genes governing cytoskeletal organization and membrane dynamics associated with radiotherapy resistance
To identify predictive biomarkers for RT response, we analyzed mutations associated with 10-year local recurrence in a cohort restricted to patients who received RT. This analysis revealed 29 genes significantly associated with an increased risk of recurrence (Firth’s penalized likelihood Cox regression p-value p-value 4a). Notably, these mutations often co-occurred, with at least two mutated genes present in approximately 27% of lesions (20/73 patients treated with RT).
Fig. 4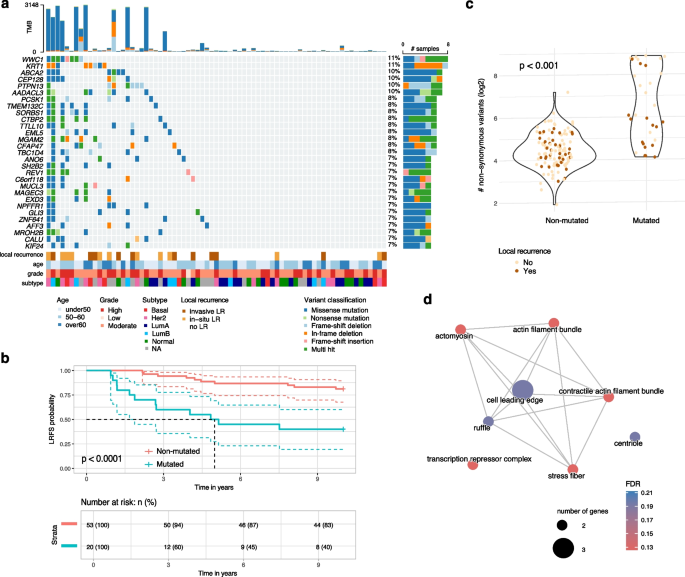
Mutations associated with radiotherapy resistance in DCIS. a An oncoplot showing the distribution of mutations in 29 genes significantly associated with LR in RT-treated patients. Color-coding indicates mutation types; clinical annotations show age, grade, molecular subtype, and 10-year recurrence status. b Kaplan–Meier analysis of LRFS comparing patients with mutations in at least two of the 29 genes (red) versus those without mutations (blue). c Distribution of TMB, shown as number of non-synonymous variants, log2 scale) for lesions with at least one mutation in two genes associated with LRFS colored by recurrence status at 10 years. d GO cellular component enrichment network analysis of recurrence-associated genes in RT-treated DCIS. Network visualization shows enriched GO terms (FDR 2), and edges indicate significant semantic similarity between terms. Node color intensity corresponds to enrichment significance
In RT-treated patients, lesions harboring mutations in at least two of these genes exhibited a markedly increased risk of LR (Firth’s penalized likelihood Cox regression HR = 4.8, 95% CI: 2.1–11.2, p = 0.0002), with most mutation-positive recurrences occurring within 5 years post-RT (Fig. 4b). Notably, while mutations in SH2B2 and MUCL3 were significantly associated with prognosis in both the overall cohort and the RT-treated subgroup, an RT-stratified analysis revealed that lesions harboring two mutations in the remaining 26 genes (which were altered in at least five lesions in the no-RT group) were predictive of prognosis only in RT-treated patients (p p > 0.5) (Supplementary Fig. 2).
Given the frequent co-occurrence of these mutations, we assessed whether overall TMB might explain the increased recurrence risk. Although several high-TMB lesions were observed among patients with these mutations (Fig. 4a,c), TMB itself was not significantly associated with LR risk (Firth’s penalized likelihood Cox regression p = 0.8). Indeed, many lesions with high TMB remained recurrence-free over 10 years, suggesting that specific mutations—not overall mutation load—drive LR after RT. We further examined potential confounding by clinico-pathological variables (i.e. age, grade, tumor size, multifocality and subtype) by adjusting our survival model for each factor. The predictive value of these mutations remained significant (Firth’s penalized likelihood Cox regression p-values
Functional analysis revealed a network of interrelated cellular functions involved in actin cytoskeleton regulation, cellular polarity, and membrane dynamics—processes essential for invasive behavior (Fig. 4d).
Alterations in SH2B2 and SORBS1, which modulate stress fiber formation and actin remodeling, and in PTPN13 and WWC1, which affect actomyosin tension at the cell leading edge, suggest disruptions in cytoskeletal dynamics. Additional genes associated with prognosis in RT-treated include KRT1, MUCL3, TMEM132C, TTLL10, EML5, CEP128, CFAP47, and KIF24, all of which contribute to maintaining cellular architecture, polarity, and adhesion (Fig. 4a). In addition, alterations in metabolic regulators—such as MGAM2 and AADACL3—could influence the energetic and biosynthetic demands required in response to RT-induced stress, while REV1 is implicated in DNA damage tolerance, a critical safeguard following genotoxic stress.
Collectively, these findings highlight the pivotal roles of cytoskeletal reorganization, membrane remodeling, metabolic regulation, and DNA repair pathways in the response to RT. The prognostic significance of these mutations in RT-treated patients suggests that these gene alterations may mediate resistance mechanisms triggered by RT-induced stress.
Differential mutational associations with in-situ versus invasive local recurrence after radiotherapy
To investigate whether individual mutations are preferentially linked to either in-situ or invasive LR, we refitted the gene-based survival models using each LR type as the sole endpoint (the alternative event was censored) and stratified the analyses by RT. For the full cohort we had retained genes with p p p p 5a).
Fig. 5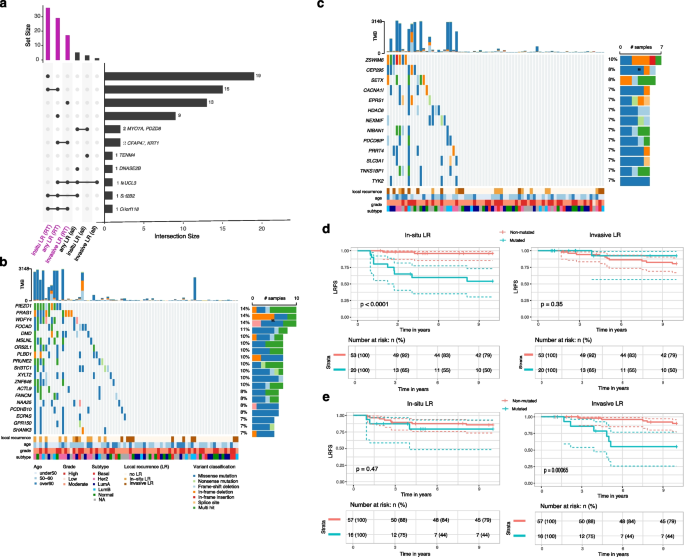
Differential mutational associations with in-situ versus invasive local recurrence after radiotherapy. a An UpSet plot showing the number of genes significantly associated with risk of invasive, in-situ or any LR in the whole cohort (all) and in RT-treated (RT) or untreated patients (noRT), with intersections between gene lists indicated by connected dots below and corresponding size of the intersection depicted in the barplot on the right. b Oncoplot showing mutations in genes uniquely associated with in-situ LR (n = 19) in RT-treated patients. Color-coding indicates mutation types; clinical annotations show age, grade, molecular subtype, and recurrence status. c Similar to b but showing mutations in genes uniquely associated with invasive LR (n = 13) in RT-treated patients. d Kaplan–Meier analysis of in-situ (left) or invasive (right) LRFS comparing patients with mutations in at least two of the 19 genes uniquely associated with in-situ LR (red) versus those without mutations (blue). e Similar to d but comparing in-situ or invasive LRFS between patients with mutations in at least two of the 13 genes uniquely associated with invasive LR versus those without mutations
Three genes—MUCL3, SH2B2 and C6orf118—were associated with outcome in at least three out of six analyses (Fig. 5a). In RT-treated tumours, fifteen genes were associated with in-situ LR or with “any LR”, and two genes (CFAP47, KRT1) were associated with invasive or with “any LR” (Fig. 5a). Nineteen additional genes were uniquely associated with in-situ LR (Fig. 5b), whereas thirteen were unique to invasive LR (Fig. 5c) within the RT subgroup. The Kaplan-Meyer analyses demonstrate that patients whose lesions harbor mutations in at least two genes from either the in-situ-specific or invasive-specific gene sets show significantly worse LR-free survival only for the corresponding recurrence type (Fig. 5d,e).
Functional annotation indicates that mutations uniquely linked to in-situ LR occur mainly in genes that preserve epithelial architecture and mechanosensing: anchoring-junction components that couple cells to neighbouring cells or to the extracellular matrix (DMD, FOCAD), the stretch-activated channel PIEZO1, and scaffolds/adaptors localised to actin-rich membrane projections such as invadopodia (SHANK3, PRAG1). The set also includes WDFY4, a WD-repeat/FYVE-domain autophagy adaptor implicated in MHC-II antigen presentation.
Conversely, mutations associated with invasive LR after RT mapped to genes involved in late cytokinetic abscission (PDCD6IP), centriole-to-centrosome maturation (CEP295), DNA-damage sensing and repair (SETX, TNKS1BP1), calcium-regulated motility (CACNA1I) and cytokine-dependent inflammatory signalling (TYK2).
Because stratifying simultaneously by treatment and LR type reduces sample size and event numbers, we cannot exclude the possibility that some endpoint-specific associations—or the absence of others—reflect differences in statistical power. Nevertheless, these findings suggest that distinct biological programs—structural maintenance versus cell-cycle, genome-stability and inflammatory pathways—underlie in-situ and invasive patterns of recurrence after RT.
Copy number alterations display molecular subtype-specific patterns with select genomic regions linked to local recurrence
Analysis of copy number alterations (CNAs) revealed recurrent chromosomal changes similar to those reported in invasive breast cancer (Fig. 6a). Significant gains were identified on chromosomal arms 1q, 8q, 16p, 17q, 20p, and 20q, while losses predominantly occurred on 8p, 9p, 11q, 13q, 14q, 16q, and 17p (binomial test, FDR
Fig. 6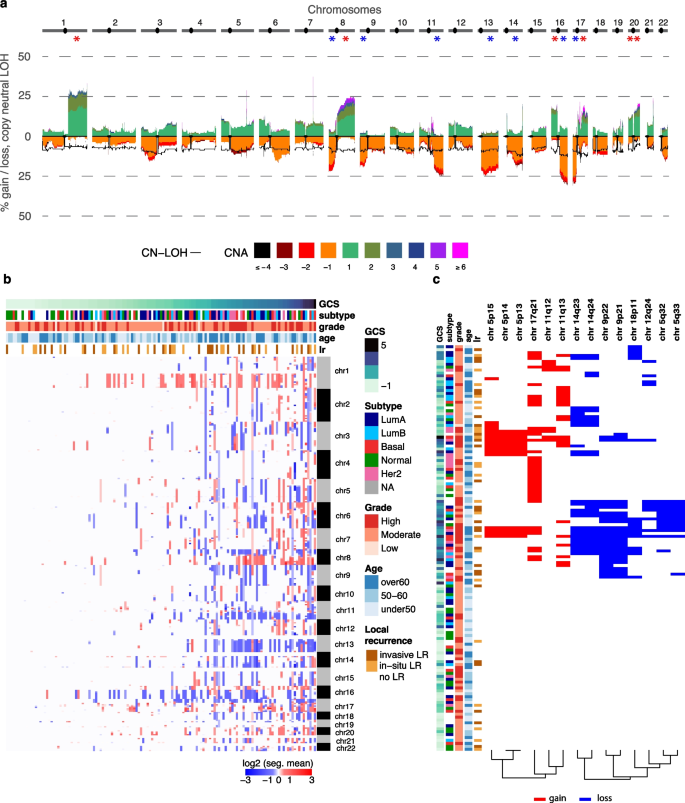
Frequent copy number alterations in pure DCIS and associations with 10-year LR risk. a Genome-wide frequency of absolute copy number gains and losses across chromosomes 1–22 (1 Mb window). The estimated ploidy for each sample is subtracted from the copy number values of each segment which means that a copy number of 0 is no copy number change. The y-axis shows the percentage of samples with each alteration type. Asterisks indicate statistical significance for chromosomal arm alterations b Heatmap showing copy number profiles per cytoband across samples (rows), ordered by global CNA score (GCS). Sample annotations include age, grade, molecular subtype and LR status at 10 years. c Heatmap of twenty genomic regions significantly associated with 10-year risk of local recurrence (Firth’s penalized likelihood Cox regression p-value
Global CNA burden varied considerably across samples, with approximately half showing minimal alterations (global CNA score 6b). Basal-like tumors exhibited greater CNA burden, while normal-like tumors showed fewer alterations (Fig. 6b, Supplementary Fig. 2a). Similarly, high-grade lesions showed a greater CNA burden compared to low-grade lesions (Supplementary Fig. 3b).
We identified distinct CNA patterns across molecular subtypes: basal-like tumors showed enrichment for gains on 8q, 13q, and 19q; LumA tumors frequently exhibited 16q loss; and Her2-enriched tumors showed characteristic 17q12 gains corresponding to the ERBB2 locus (Fisher’s exact test, p
Fourteen cytoband regions were significantly associated with increased 10-year LR risk after grade adjustment (Firth’s penalized likelihood Cox regression p-value & permuted p-values 6c). These included copy number losses in five non-adjacent cytobands and gains in three non-adjacent cytobands. When analyzing invasive LR specifically, four regions were shared (losses in 5q32-33, 9p21, 18p11), with two additional losses identified in 9p13 and 8q11 and one gain in 5p15 (Firth’s penalized likelihood Cox regression p-value p-value
Copy number losses could alter critical tumor suppressor functions, as evidenced by the presence of several well-known tumor suppressor genes within these regions. Notable examples include CDKN2A at 9p21 (a key regulator of cell cycle progression), PRDM4 at 12q23-24 (involved in cell differentiation and tumorigenesis) [29], SPARC at 5q33 (important for extracellular matrix synthesis and modulation of cell shape) [30] and MITOSTATIN at 12q24 (a mitochondrial protein with tumor suppressor activity) [31]. Additional loss highlights disruptions in cell adhesion and intercellular contacts as loss of 18p11 may affect DAL-1, a known regulator of cell adhesion and link between cell membrane and cytoskeleton [32, 33].
Gains were identified in regions harboring oncogenes or potential cancer-related genes. For example, amplification in the 11q region—including 11q13, which contains CCND1 and CTTN— previously associated with breast cancer aggressiveness [34, 35]. Additionally, a gain in 5p14 includes four cadherin genes (CDH10, CDH9, CDH12, CDH18) and PRDM9, whose aberrant expression has been associated with genomic instability [36].
Collectively, these findings demonstrate that the CNAs associated with 10‑year LR not only affect regions harboring established tumor suppressors and oncogenes but also target regions involved in cell structural integrity and cell-cell interactions, potentially contributing to an aggressive and treatment-resistant phenotype.
Contextualizing our genomic findings with prior profiling studies: consistent early mutational drivers, novel subtype-specific CNA patterns, and predictors of RT response
Most prior DCIS genomic studies analyzed small cohorts (. (2022) [20] and Kader et al. (2024) [37], examined hundreds of pure DCIS cases, their reliance on low-pass sequencing or lack of matched normal tissues limits the sensitivity for detecting genomic changes, particularly when working with FFPE samples, which are often the only available option for DCIS studies.
Across studies, PIK3CA and TP53 consistently emerged as the most frequently mutated genes in DCIS (and invasive disease), with mutation rates ranging from 21-55% and 17-52%, respectively (Supplementary Tables 2–3). In our cohort, PIK3CA and TP53 were also among the most frequently mutated genes and identified as tumorigenesis drivers in pure DCIS. Mutations in GATA3 and ERBB2, which were reported in several studies, were only detected in a small number of lesions in our cohort (n = 3 and 7, respectively, Supplementary Table 3). Overall, we observe very little overlap between genes reported as frequently mutated across studies (Supplementary Table 3). Differences across studies likely reflect variations in methodology, including variant-calling pipelines, sample types (e.g., synchronous vs. pure DCIS), cohort composition (e.g., histological grade and ER/HER2 status), and our study’s specific focus on LR and RT response, complicating direct comparisons. Nevertheless, the consistent identification of PIK3CA and TP53 as the most frequently mutated genes across studies and in our cohort reinforces their pivotal roles in the early stages of breast tumorigenesis.
Recurrent CNAs in regions such as 1q, 8q, and 17q gains, as well as 8p, 11q, and 16q losses, were observed in our study, consistent with prior DCIS findings, including those from Strand et al. (2022) [20] and Abba et al. (2015) [15]. For example, Strand et al. (2022) identified 29 recurrent CNAs in DCIS but found no single CNA predictive of recurrence [20]. In contrast, we identified twenty genomic regions significantly associated with 10-year LR risk, including regions containing known tumor suppressors and oncogenes. These differences may reflect the higher resolution of our sequencing approach (100 X whole-exome sequencing) compared to the low-pass sequencing used in prior studies. Our study also provides valuable new insights into molecular subtype-specific CNA patterns in DCIS. In our cohort, basal-like tumors exhibited gains on 8q, 13q, and 19q; Luminal A tumors displayed 16q loss; and Her2-enriched tumors showed 17q12 gains encompassing ERBB2. Aside from amplifications in HER2-positive subtypes, subtype-specific CNA analyses remain poorly represented in the DCIS literature but are well established in invasive breast cancer (see Supplementary Text). These findings suggest that genetic and molecular aberrations defining subtypes likely arise early and are at least partially established at the DCIS stage.
Finally, while several studies have explored prognostic markers of recurrence, few account for treatment variation, and none specifically examined markers of RT response (Supplementary Table 2). Our study uniquely identified genetic alterations within a gene network that integrates cytoskeletal integrity, cell-cell interactions, cell adhesion, and metabolism which are associated with an increased risk of LR within ten years following RT. These findings suggest that these alterations may play a critical role in resistance mechanisms activated by RT-induced stress.