The Fed should look at private-sector employment. Layoffs at the government are a political decision, not the result of economic weakness.
By Wolf Richter for WOLF STREET.
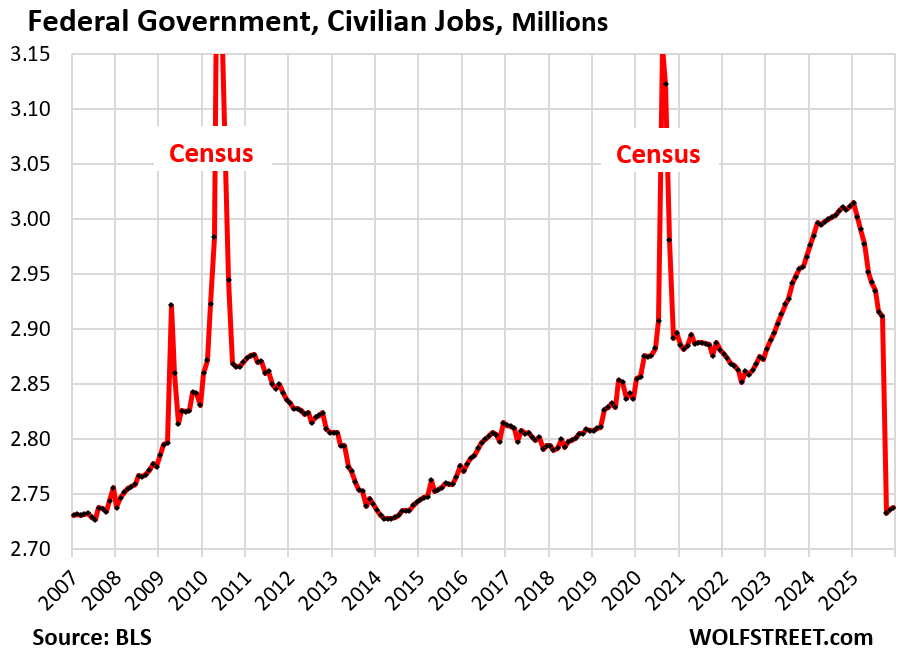
The job losses at the federal government and at state governments have hit nonfarm employment all year, and hard. In 2025, the federal government shed 264,000 jobs, and state governments shed 47,000 jobs, combined 311,000 jobs, according to the Bureau of Labor Statistics today.
In December, as well as in November, federal government jobs edged up, possibly on large-scale hiring by ICE, after the plunge in October when the federal government shed an upwardly revised 179,000 workers, largely the result of workers who’d volunteered to quit earlier in the year but who, as part of their incentives to quit, had continued to receive their salaries until September 30. Civilian employment at the federal government in December and November, at 2.74 million, was the lowest since 2014.
Companies that lost government contracts, or whose contracts were reduced or paused, also laid off people, and those were private-sector jobs included in private-sector employment below.
The Federal Reserve needs to look at private-sector jobs. Layoffs at the government impact consumers and the economy, obviously. But those layoffs are a political decision by the White House, and are not the result of weak demand, slow consumer spending, or other economic changes. The Federal Reserve can do nothing to stimulate hiring at the federal government. So for its monetary policy decisions, the Fed should look at private-sector employment.
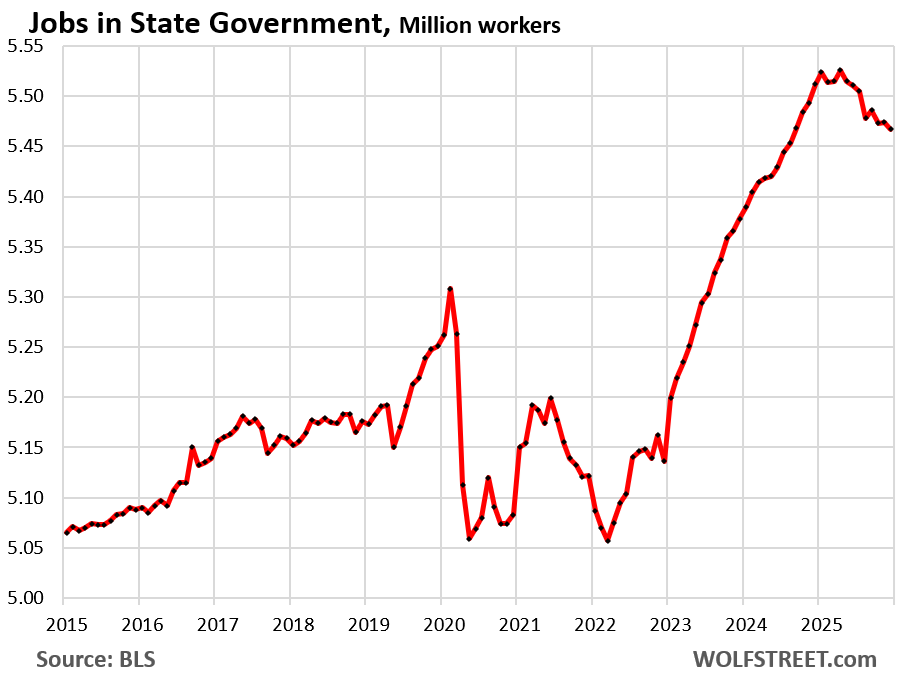
State governments shed 47,000 jobs in 2025, including another 7,000 in December, after the surge in the prior two years.
State government jobs are dominated by jobs at state universities, which are huge employers. For example, the University of California system employs 267,000 faculty and staff (data via University of California), nearly half of the state government’s total employees of 551,000 (data via BLS).
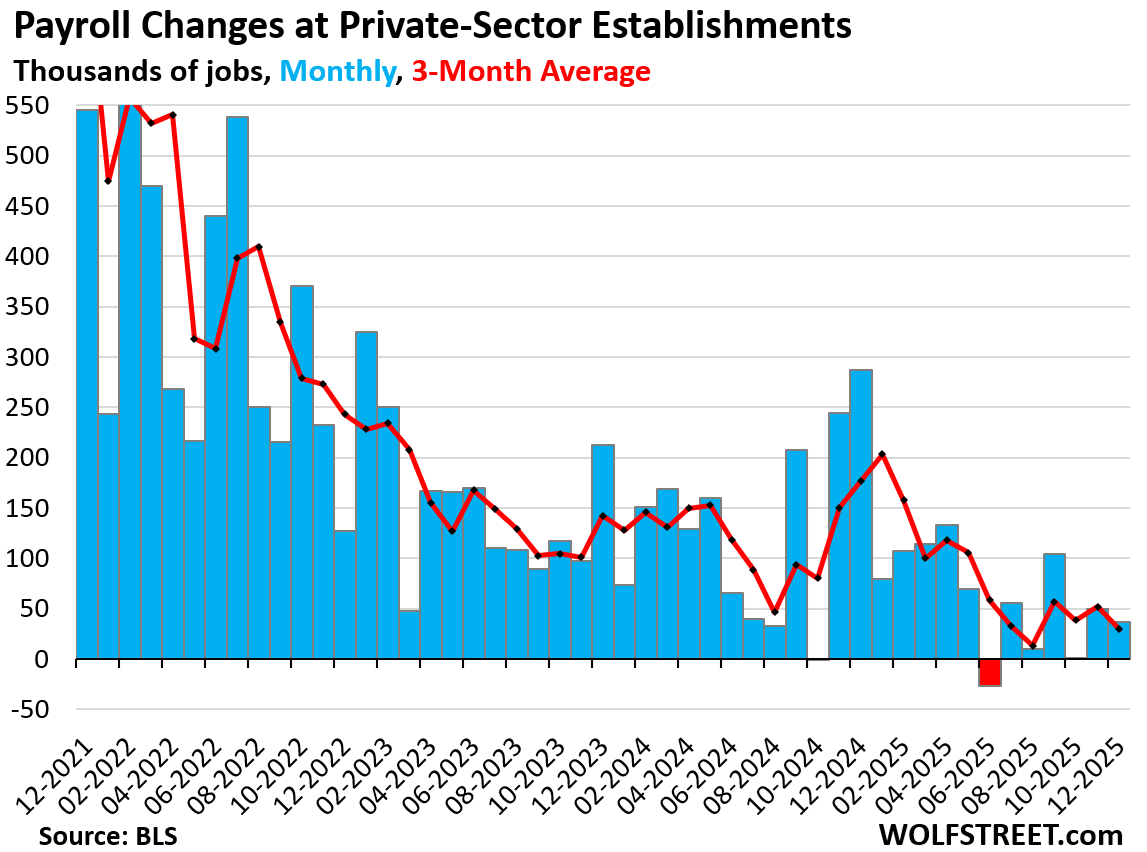
Job creation in the private sector has been weak, but positive in recent months.
Nonfarm private-sector jobs rose by 37,000 in December and by 50,000 in November. Over the past three months, they rose by 88,000 combined (even as total payrolls dropped by 67,000 over the same period).
The three-month average in December rose by 29,000 jobs (red line):
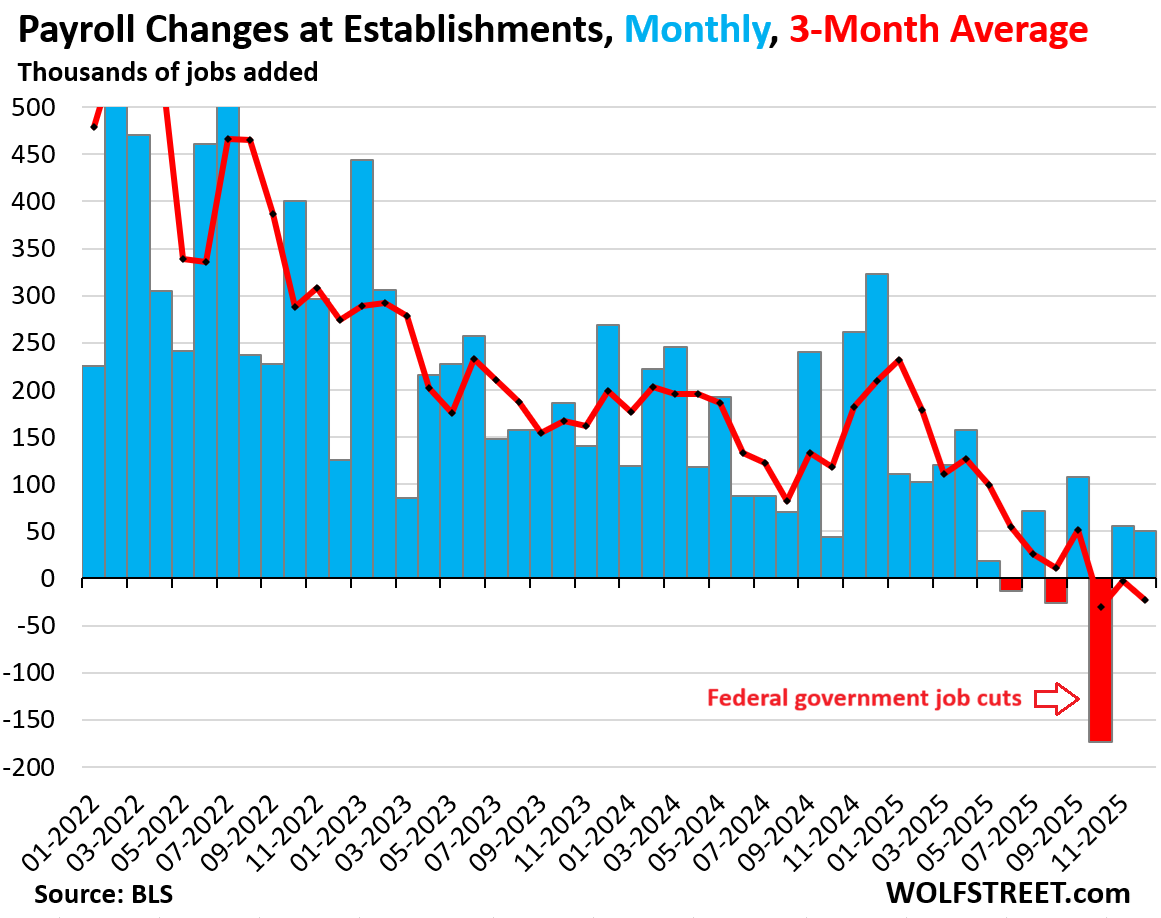
Total nonfarm payrolls, including government employment, rose by 50,000 in December from November.
October had been hit with the 179,000 federal government job cuts, which had caused overall nonfarm jobs in October to plunge by 173,000.
For the past three months combined, total nonfarm payrolls lost 67,000 jobs; the three-month average job loss in December was 22,000 (red line in the chart below).
Average hourly earnings rose by 0.33% in December from November (+4.0% annualized).
Three-month average hourly earnings rose by 4.1% annualized, at the top end of the 12-month range (red line):
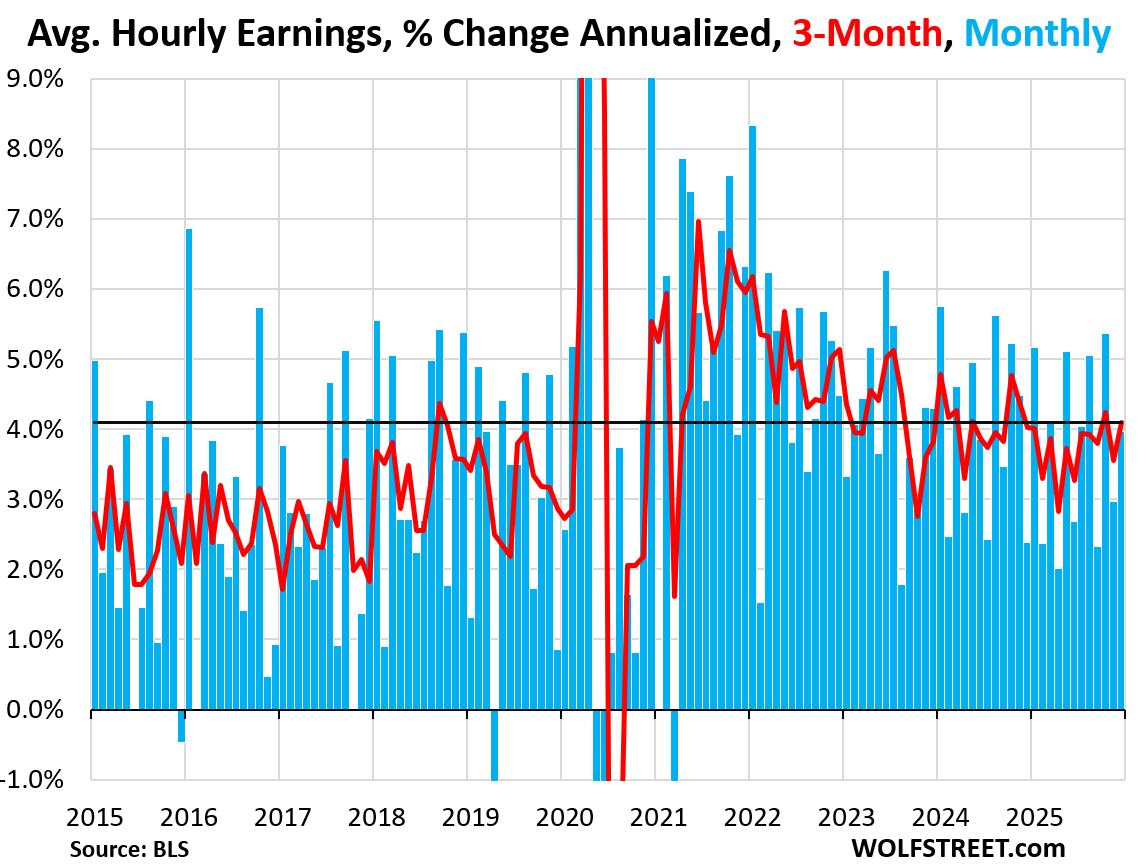
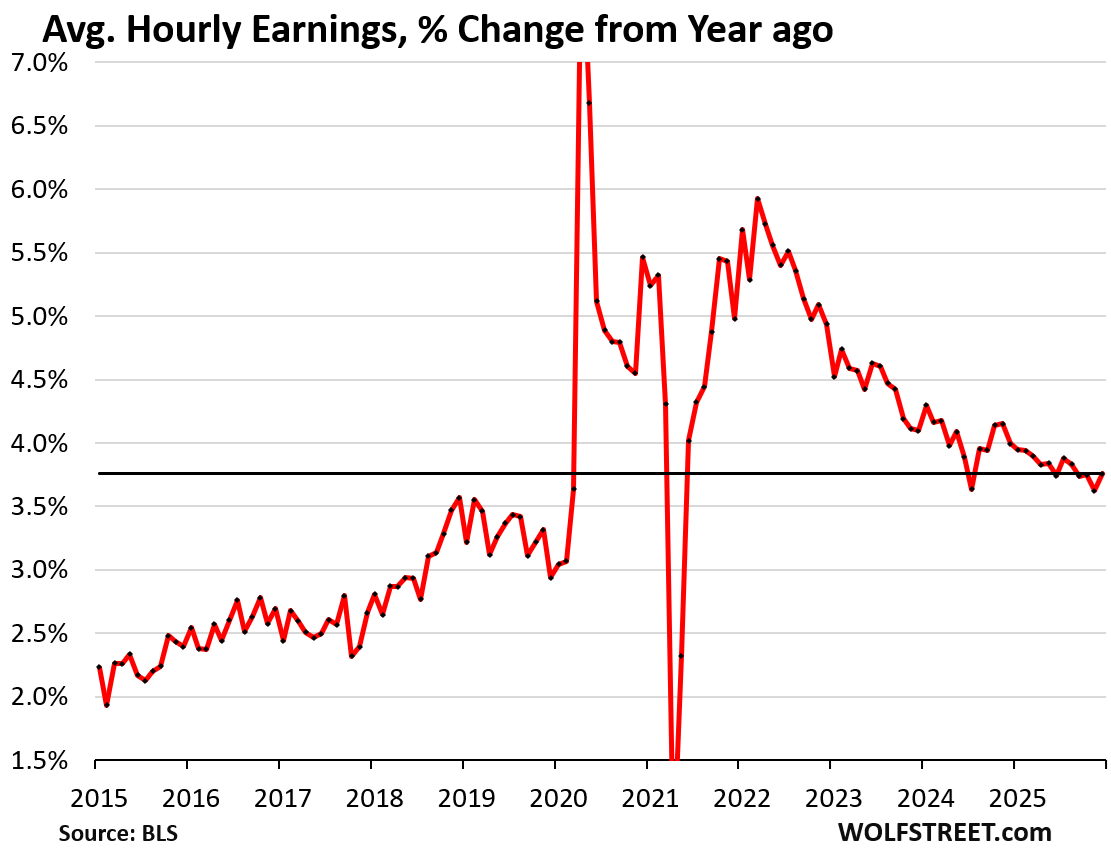
Year-over-year, average hourly earnings rose by 3.8% in December.
The Household Survey data in the Jobs Report.
The above data is from the survey of establishments, which submit much of the data electronically every month. So a lot of the October data was collected, and the BLS backfilled it.
But the data below on the unemployment rate, labor force, etc. is collected via surveys from households. Surveys were not conducted in October during the government shutdown, and the data is missing forevermore. The November and December surveys were conducted.
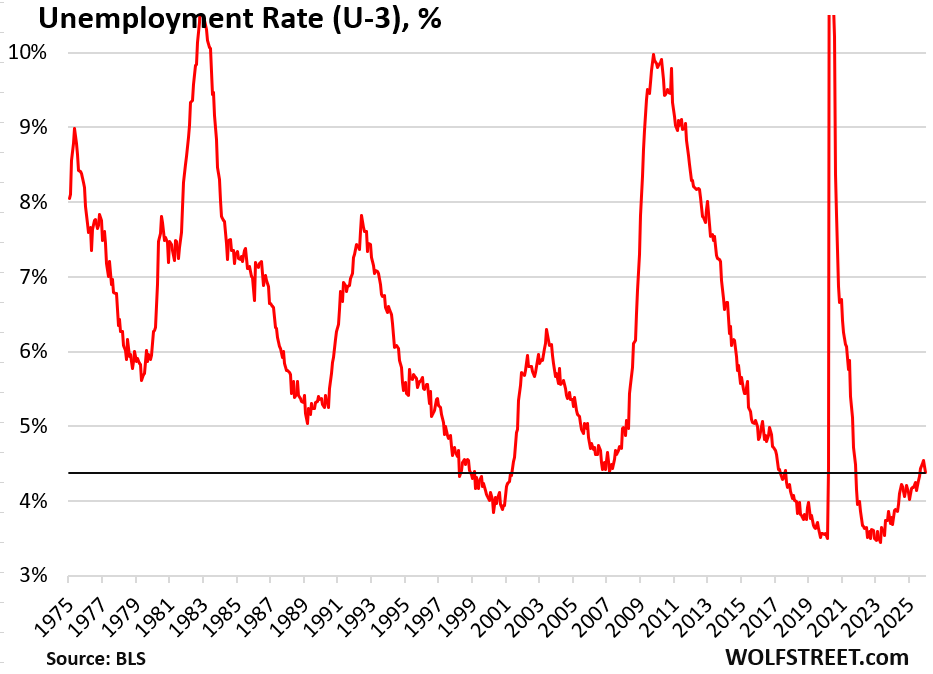
The unemployment rate dropped to 4.38% in December, the lowest since August – at the low end of the historical range.
The unemployment rate reflects the number of unemployed people who are actively looking for a job divided by the labor force (people working or looking for a job).
The decline in the unemployment rate was a function of declines of both, the unemployed and the labor force:
- Number of unemployed: -278,000, to 7.50 million, lowest since August.
- Labor force: -46,000 to 171.5 million.
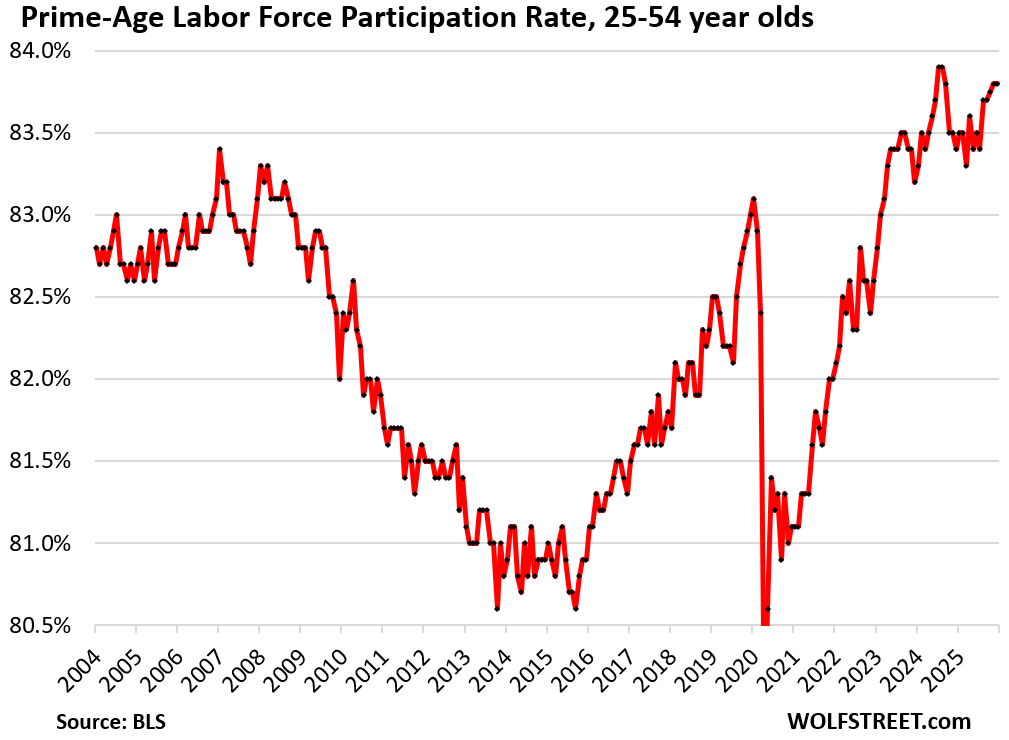
The prime-age labor force participation rate (25-to-54-year-olds) remained at a historically high 83.8% in December.
The prime-age labor force participation rate eliminates the issue of the retiring boomers. The overall labor force participation rate shows the percentage of the population that either has a job or is looking for a job. When people retire and stop looking for a job, they exit the labor force but remain in the population until they die. The surge of boomer retirements, which started about 15 years ago, has pushed down the overall labor force participation rate, as these retired boomers are still in the population but no longer in the labor force.
This very high prime-age labor force participation rate is a strong positive in the labor market.
Enjoy reading WOLF STREET and want to support it? You can donate. I appreciate it immensely. Click on the mug to find out how:

![]()
WOLF STREET FEATURE: Daily Market Insights by Chris Vermeulen, Chief Investment Officer, TheTechnicalTraders.com.