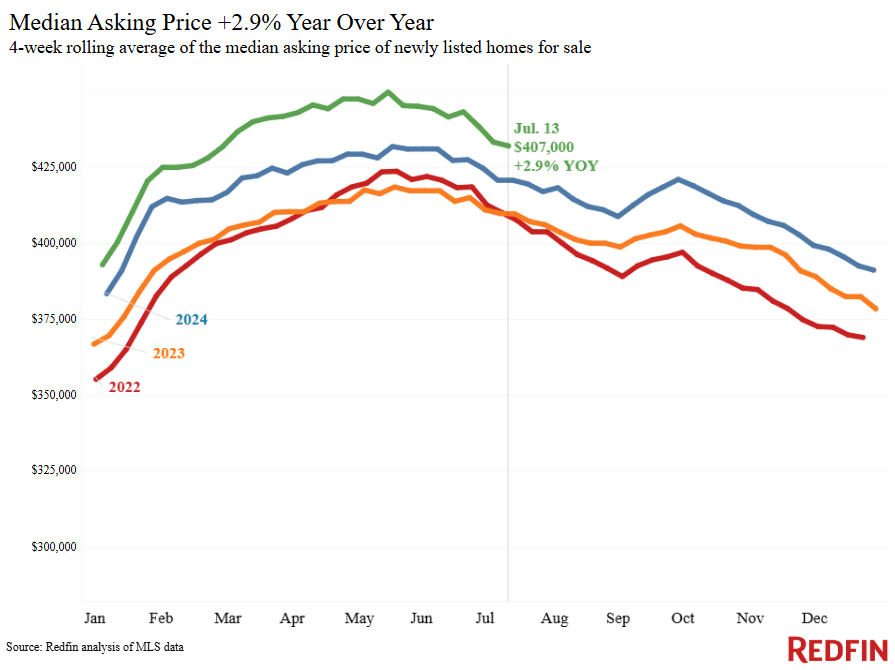
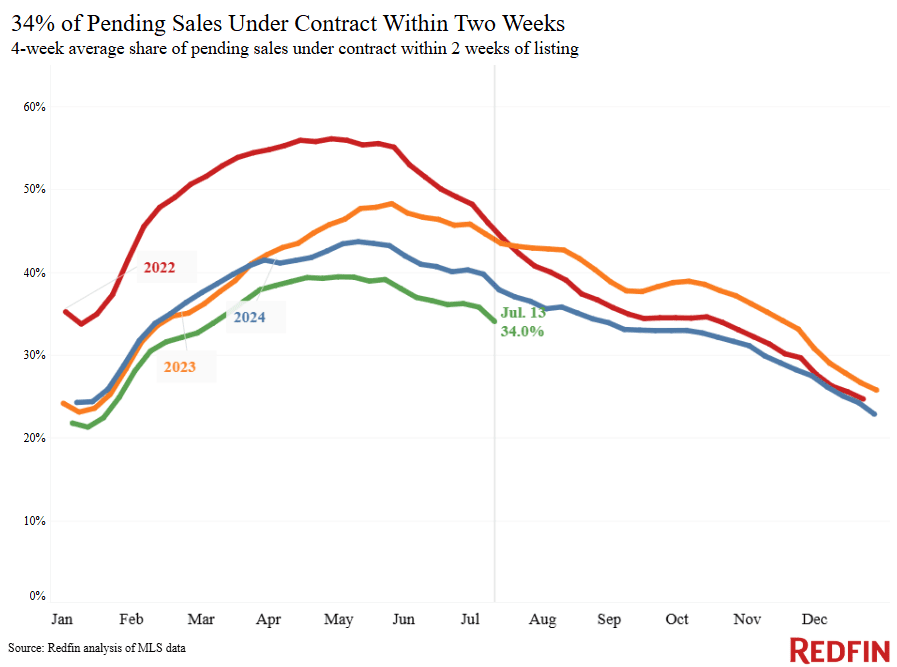
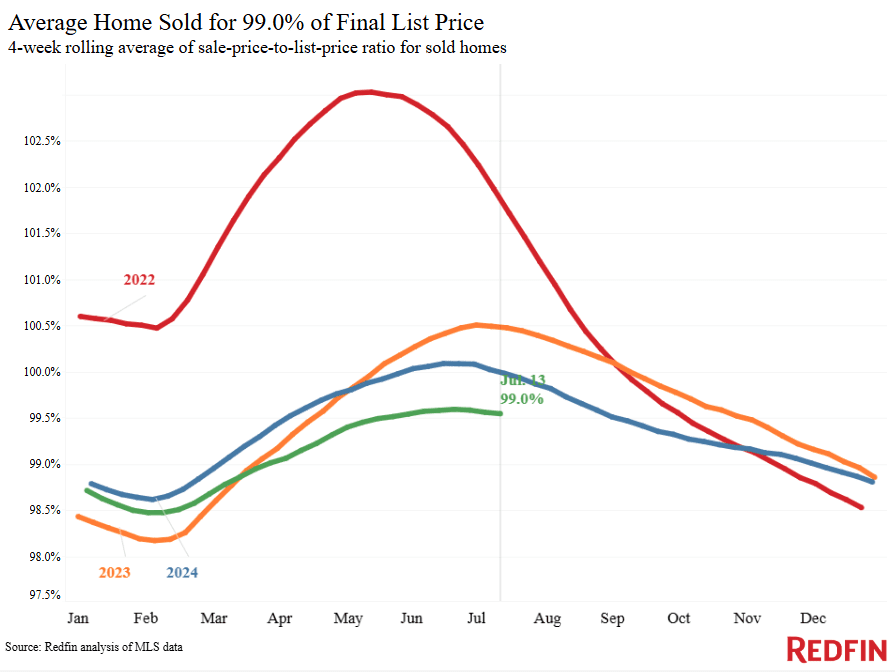
The median U.S. asking price posted its smallest increase since the start of 2025 as more sellers come to terms with the reality of today’s buyer’s market.
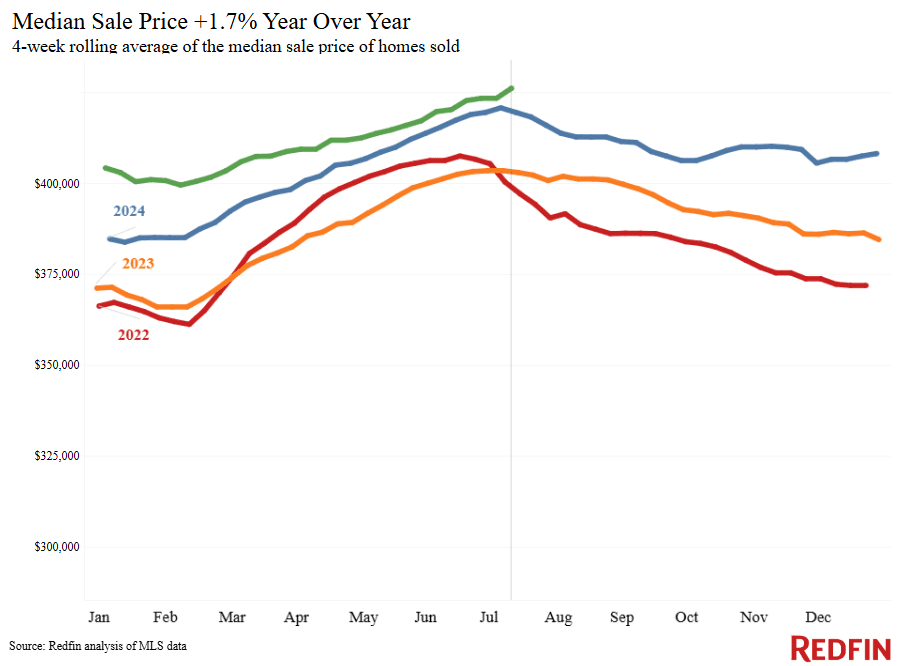
The median U.S. asking price was $407,000 during the four weeks ending July 13, up 2.9% year over year, the smallest increase in over four months. That’s just slightly higher than the median home-sale price of $401,120; the small size of that gap is a sign that sellers are starting to price their homes lower as they realize it’s a buyer’s market. The median sale price is up just 1.7% year over year; given that the average U.S. wage has increased by more than 4%, homes are more affordable than they were last year.
The housing market has been tilting in buyers’ favor for months, with buyers getting concessions from sellers and often successfully negotiating sale prices down. The slowdown in asking-price growth, along with the shrinking gap between the prices sellers want for their homes and the prices buyers are willing to pay, is a sign that sellers are coming to terms with the reality of today’s buyer’s market.
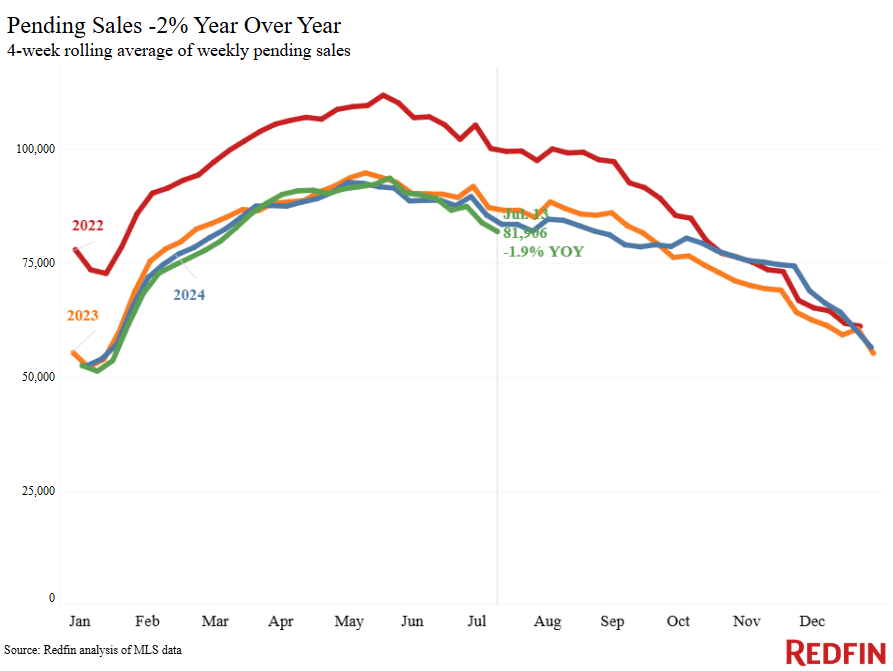
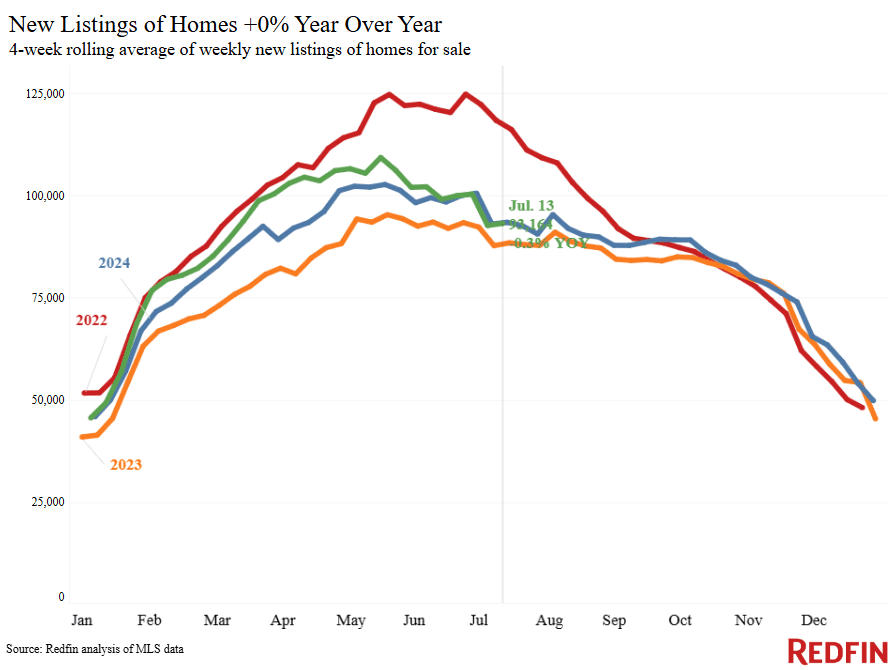
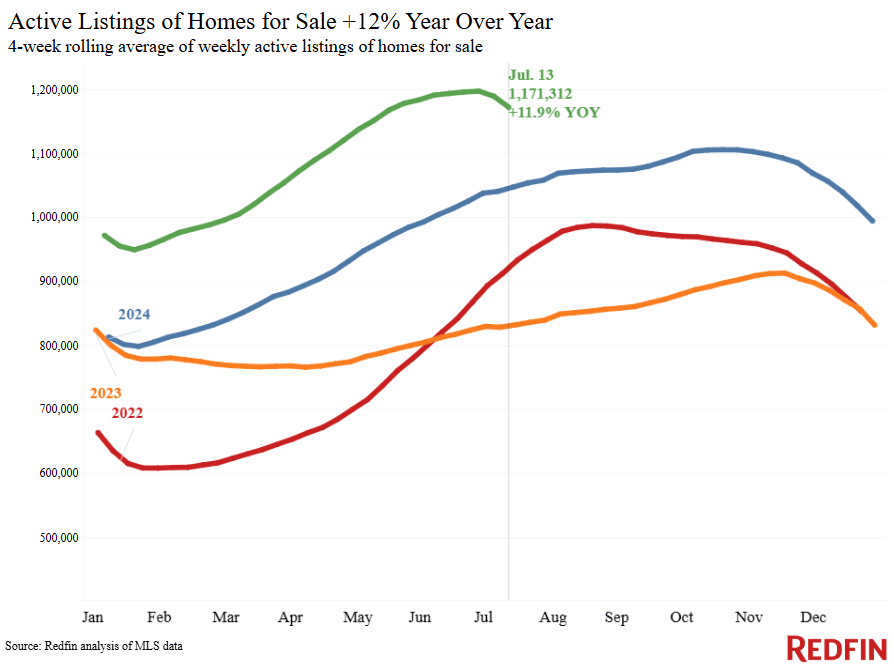
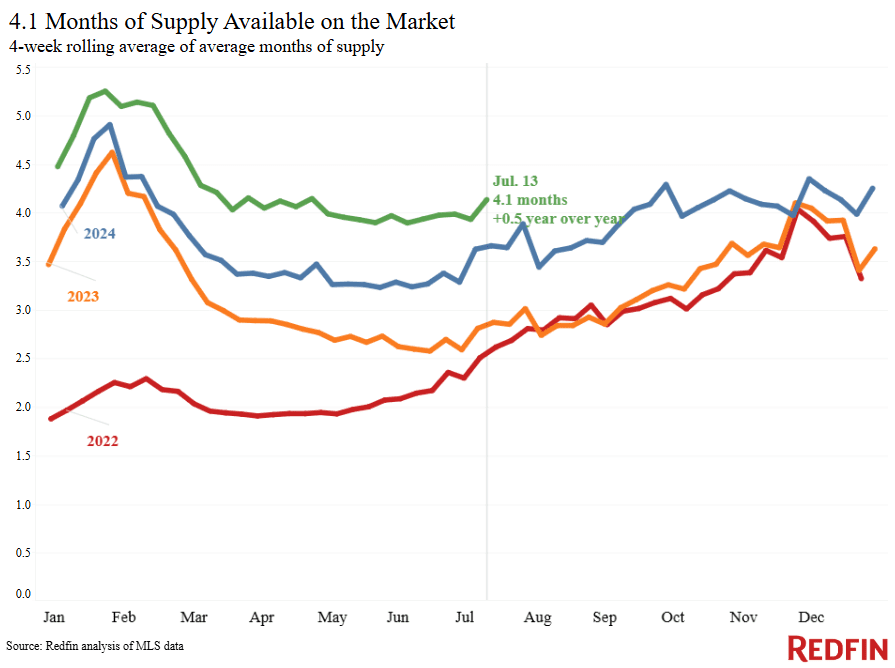
Another sign that homeowners have caught onto today’s market conditions: Listings are losing steam. New listings are down nearly 1% year over year, the biggest decline since the start of 2025. Still, there are hundreds of thousands more home sellers than buyers in the U.S. The total number of homes for sale is up 12%, while pending sales are down 2%.
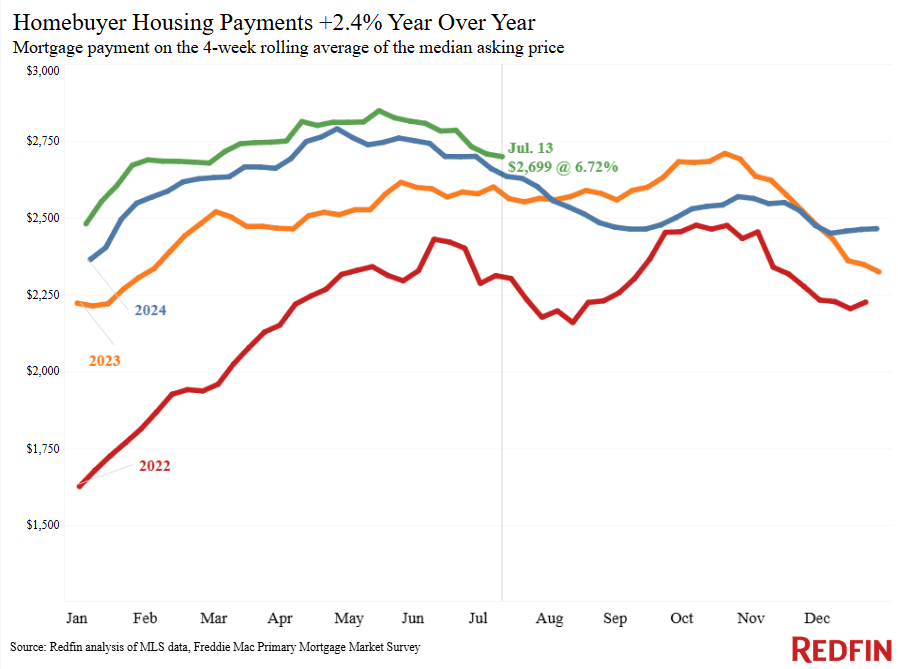
Sale prices are still at a record high, but they may decline soon; Redfin forecasts that the median U.S. home-sale price will fall 1% year over year by the end of 2025. And homebuyers’ median monthly housing payment is coming down, dropping to a four-month low this week as the weekly average mortgage rate sits near its lowest level since early spring.
The combination of a buyer’s market and falling monthly payments is encouraging some buyers to return to the market. Home tours are rising much faster this year than the same period last year, and Google searches of “homes for sale” are at their highest level in over a year.
“Buyers should look at a lot of homes and make a lot of offers–even if they’re low or below market value–as more and more sellers are willing to make a deal,” said Jim Fletcher, a Redfin Premier agent in Tampa, FL. “There’s a backlog of inventory, especially when it comes to condos, townhouses and newly built homes. Builders are giving all sorts of incentives, like mortgage-rate buydowns and covering closing costs, to get homes off their books. The one exception: desirable, move-in ready homes in the center of town where there aren’t as many new construction homes to compete with. Buyers will usually pick those up relatively quickly if they’re priced right.”
For Redfin economists’ takes on the housing market, please visit Redfin’s “From Our Economists” page.
Leading indicators
Key housing-market data
Redfin’s national metrics include data from 400+ U.S. metro areas, and are based on homes listed and/or sold during the period. Weekly housing-market data goes back through 2015. Subject to revision.
Metro-level highlights: Four weeks ending July 13, 2025
Redfin’s metro-level data includes the 50 most populous U.S. metros. Select metros may be excluded from time to time to ensure data accuracy.
Metros with biggest year-over-year increases
Metros with biggest year-over-year decreases
Notes
Cleveland (11.8%)
Newark, NJ (10.2%)
Detroit (7.7%)
Nassau County, NY(7.7%)
Cincinnati (7.6%)
Oakland, CA (-7.6%)
West Palm Beach, FL (-5.1%)
Tampa, FL (-2.6%)
Atlanta (-2.6%)
Austin, TX (-2.4%)
Declined in 12 metros
Phoenix (8.7%)
Warren, MI (8.2%)
Montgomery County, PA (5.1%)
Milwaukee (4.6%)
Miami (-15.1%)
Tampa, FL (-13.3%)
Las Vegas (-12.8%)
Orlando, FL (-12.7%)
Refer to our metrics definition page for explanations of all the metrics used in this report.
