Cu3 crystallizes in the P31c non-centrosymmetric polar space group32. Each copper(II) ion is coordinated by four nitrogen and one oxygen donor. It adopts a distorted trigonal bipyramidal (tbp) geometry, with the axis of the tbp lying in the plane of the triangle. The three-fold symmetry axis at the center of the triangle relates the three copper(II) ions. The unit cell contains two crystallographically independent copper triangles (labeled A and B in Fig. 1a) and two mirror symmetry-related molecules (A’ and B’) (Fig. 1b). We note that A’ and B (or A and B’) are almost centrosymmetric images of each other (see Supplementary Fig. 1), making their subtle differences32 crucial for detecting the SE effect by EFM-EPR. Nevertheless, A’ and B exhibit different packing along the polar c axis due to co-crystallized solvent molecules and the disordered perchlorate anions (see Supplementary Note 1).
Fig. 1: Structure, g-tensor orientation and experimental setup.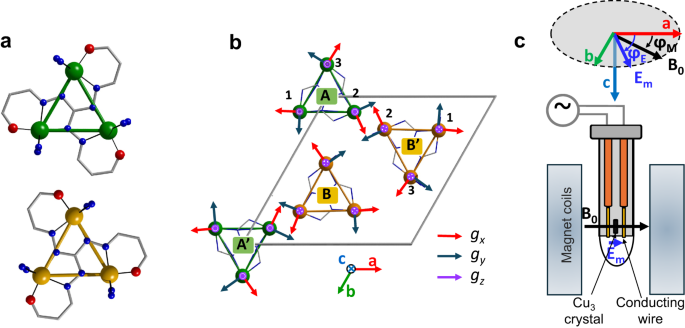
a Crystallographically independent molecules (A, green and B, orange) in the asymmetric unit of Cu3 viewed along the crystallographic c axis (hydrogen and carbon atoms of the aromatic rings in the pyridine and Schiff-base ligands are omitted for clarity). The A’/B families are related by pseudo-inversion symmetry with a small tilt angle of 1.2° between the triangular planes. b Unit cell content of Cu3. Triangles A and A’ as well as B and B’ are related by the glide reflection planes (100), (010) and (1-10), resulting in the absence of crystallographic chirality. For all triangles, the g reference frame of the copper ions has been reported (gx = red, gy = blue, gz = violet)32. Color code: Cu: green for triangles A and A’ and orange for triangles B and B’, O: red, N: blue, C: grey, H and pyridine rings are omitted for clarity. Green and orange lines between the copper ions emphasize the triangular structure of the molecules. c Schematic representation of the sample holder for the EFM-EPR measurements and related reference frame. Images of the crystal in three experimental configurations are shown in Supplementary Fig. 2.
EFM-EPR spectra
EFM-EPR experiments on a single crystal of Cu3 were performed by replacing the magnetic field modulation (Bm) of CW-EPR with a 30 kHz oscillating electric field (Em = 69 kV m−1). The long-wavelength Em was introduced in the comparatively small X-band cavity by means of a modified version of the standard sample-holder, consisting of a home-made propagating structure without cutoff given by two thin parallel conducting wires separated by ca. 1 mm30 (a scheme of the EFM-EPR sample holder is reported in Fig. 1c and Supplementary Fig. 2). Thanks to the phase-sensitive detection, a derivative signal is revealed in the EFM-EPR spectrum if the electric field affects the resonance field, i.e., if a linear SE effect is active. Consequently, contrary to standard EPR, the absorption resonance line is modulated by Em. Moreover, the first harmonic signal cancels when responses for positive and negative Em equalize, e.g., for random distribution of orientations, along specific symmetry directions, or when the effect is only proportional to an even power of the electric field. It is also worth noting that, although linear electric field effects can be observed in centrosymmetric crystals or frozen solutions using different techniques9,10,24, provided the active site lacks an inversion center, a first-order detection by EFM-EPR requires non-centrosymmetric crystals23,29,30,31.
The EPR and EFM-EPR spectra were acquired at 30 K for different mutual orientations between the crystal axes, the magnetic field B0, and the electric field Em. The experimental configurations in the ab plane are described in terms of the angles φM and φE, indicating the direction of the fields B0 and Em with respect to the a axis, respectively (see Fig. 1c). Experimental details are reported in Methods.
The top panel of Fig. 2a shows the standard EPR spectrum with B0 in the ab plane at φM = 0° (see Fig. 1c), which is centered at 3279 G (linewidth 160 G). The related EFM-EPR spectrum acquired with Em parallel to the a axis (φE = 0°, Fig. 2a) has the same phase and center. Reversing the direction of Em flips the phase (Fig. 2b), and the intensity scales linearly with Em (Supplementary Fig. 3), confirming a linear SE effect. The EPR spectrum is invariant with respect to the direction of B0 in the ab plane (Supplementary Fig. 4). On the contrary, when Em is applied at ±30° from the a or b axes, i.e., perpendicular to a glide plane, the EFM-EPR intensity drops to noise level (see Fig. 2c, Supplementary Fig. 5), matching the signal cancellation expected for A/A’ and B/B’ mirror-related pairs.
Fig. 2: EFM-EPR spectra.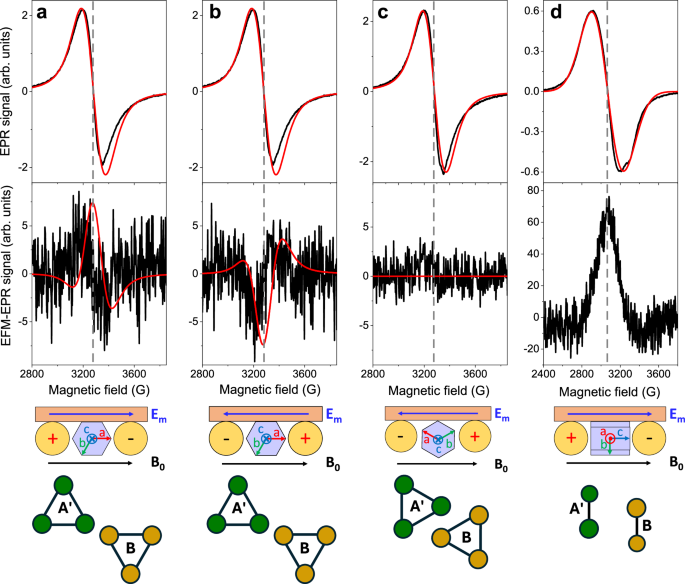
EPR spectra (top panels) and corresponding EFM-EPR spectra (bottom panels) acquired on a single crystal of Cu3 at 30 K in different experimental configurations (a schematic representation of the crystal in the sample holder for EFM-EPR viewed from the top and orientation of A’/B triangles are reported at the bottom of the figure. For the conventional EPR spectra the Em is not present, and replaced by Bm || B0): (a) The a crystallographic axis, B0, and Em all are oriented toward the same direction (φM = 0°, φE = 0°); (b) The a axis is parallel to B0 and antiparallel to Em (φM = 0°, φE = 180°); (c) A –150° rotation of the crystal about the c axis and B0 parallel to –Em (φM = 150°, φE = –30°); (d) The c axis, B0, and Em all are oriented toward the same direction. The EFM-EPR spectra intensities are rescaled by the number of acquisitions n (n = 15, 16, 59, and 8, respectively), necessary to achieve a reasonable signal-to-noise ratio. Gray dash lines indicate the EPR resonance field. In the top panels, red lines represent the simulations with the SH model given in Eq. (1) with parameters reported in Table 1. In the bottom panels, red lines represent the simulations performed using the SH model from Eq. (1) with the δg and δJ from ab initio and DFT calculations (see Table 2). Source data are provided with this paper.
Finally, a broader line (320 G) is observed at ~3060 G when B0 aligns with the c axis (Fig. 2d). When Em is also applied along c a stronger EFM-EPR signal is observed than when Em is in the plane of the triangles. The phase changes when Em is reversed (Supplementary Fig. 6a), and the signal exhibits an absorption-like shape, differing from the ab plane response. When Em is along the c axis and B0 perpendicular to it, the signal shifts to high field, but the EFM-EPR line shape remains unchanged (Supplementary Fig. 6b).
Spin Hamiltonian model
To simulate the EPR spectra, the spin Hamiltonian (SH) used for each C3 symmetric triangle of the unit cell includes the Zeeman term and isotropic exchange term:
$$\hat{H}={\sum }_{i=1}^{3}{{{{\rm{\mu }}}}_{{{\rm{B}}}}{{\bf{B}}}}_{{{\boldsymbol{0}}}} \, {\cdot \, g}_{i}\cdot {{{\bf{S}}}}_{{{\bf{i}}}}+{\sum }_{{ij}=1{i}\ne j}^{3} \, J{{{\bf{S}}}}_{{{\bf{i}}}}\cdot {{{\bf{S}}}}_{{{\bf{j}}}}$$
(1)
Ab initio calculations previously performed23 revealed a rhombic g tensor for each copper(II) center, with slight differences between the two crystallographically independent triangles. The rhombicity of g in the spin Hamiltonian framework is related to a residual spin–orbit interaction. The smallest g value (gx) aligns with the Cu–O bond corresponding to the axis of the tbp polyhedron oriented approximately in the ab plane (see Fig. 1), while the largest value (gz) is along the c axis, collinear for all three ions. DFT calculations revealed strong, nearly identical isotropic antiferromagnetic coupling between the copper(II) ions for the two triangles, consistent with magnetic data32. The DM interaction was not considered as magnetic measurements suggested that |Gz/J | 32. Additionally, the EPR spectra do not show the typical g 325 and other Cu3 systems with different bridging ligands21,22. This assumption was validated by theoretical calculations of the energy splitting in zero field of the two ground-state Kramers doublets, ca. 0.004 cm−1 (see Computational studies). The vanishing DM interaction results from the negligible overlap of the singly occupied orbital in the ground configuration of a spin site and the SOC-admixed excited state of the neighboring spin site21,33. This confirms that we are exploring a different regime in Cu3 compared to previous studies on AF triangles.
To reproduce the single-crystal EPR spectra (Fig. 2, top panels), we summed the contributions of the four molecules in the unit cell (Fig. 1b). The g values were fitted while keeping the g-principal axes and J values fixed to the computational values. The simulation parameters used are reported in Table 1, and Supplementary Note 2 contains a detailed model description. The unresolved hyperfine coupling with copper nuclear spins was neglected for the x and y components and treated as a magnetic field strain for the z direction (see Table 1). The fitting procedure for the orientational dependence of the EPR spectra is reported in Supplementary Note 3.
Table 1 Spin Hamiltonian parametersSimulation of the spin-electric effect: phenomenological model
The orientational dependence of the EFM-EPR spectra was phenomenologically rationalized by considering the electric field perturbation of the g-tensor and exchange coupling J in the SH described by Eq. (1). The modulated spectra were simulated as the difference between absorption spectra at +Em and –Em using a MATLAB script with EasySpin34 (see Methods). This approximation is valid if the shift of the resonance field is much smaller than the linewidth, as clarified by Mims23.
Considering the SE effect as a perturbation of the g-tensor, we introduced a variation Δgα (α = x, y, z) for each copper(II) center:
$${g}_{\alpha,E}={g}_{\alpha }+(\hat{{{\boldsymbol{\alpha }}}}\cdot {\hat{{{\bf{E}}}}}_{{{\bf{m}}}})\Delta {g}_{\alpha }$$
(2)
where \({\hat{{{\bf{E}}}}}_{{{\rm{m}}}}\) is the unit vector of Em. The scalar product in Eq. (2) marks a simplification, as an electric field directed along the \(\hat{{{\boldsymbol{\alpha }}}}\) principal direction may also influence other components of the g-tensor.
According to theoretical predictions14, the effect of Em on J is proportional to the scalar product between Em and the electric dipole moment \({{{\bf{p}}}}_{{{\bf{ij}}}}\) (ij = 12, 13, 23; as depicted in Fig. 3a), which is associated with spins flipping from parallel to antiparallel configuration (see Computational studies), and can be expressed as follows:
$${J}_{{ij},E}=J+({\hat{{{\bf{E}}}}}_{{{\bf{m}}}}\cdot {\hat{{{\bf{p}}}}}_{{{\rm{ij}}}})\Delta J$$
(3)
where the unit vectors of \({\hat{{{\bf{E}}}}}_{{{\bf{m}}}}\) and \({\hat{{{\bf{p}}}}}_{{{\rm{ij}}}}\) are considered, and ΔJ is the phenomenological parameter accounting for SE coupling.
Fig. 3: Schematic representation of the spin-electric effect inside a spin-frustrated triangle.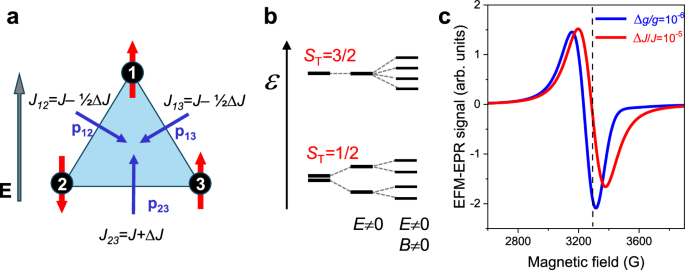
a Effect of an electric field E applied in the plane of the triangle on the exchange coupling constant of each Cu–Cu pair, with the simplifying assumption of the relevant dipole moment being perpendicular to the Cu–Cu direction and pointing towards the center of the triangle, i.e., assuming a D3h symmetry for the system, which does not alter the ground-state characteristics in terms of chirality compared to the real C3 molecular symmetry of Cu3. b Energy levels of the spin triangle showing the two ground-state Kramers doublets15,. If only isotropic exchange is active, the two doublets are degenerate and the eigenvalue of the spin chirality operator is zero. In the absence of DM, the degeneracy can be lifted by applying an in-plane electric field E or by simultaneously applying an additional magnetic field B, as illustrated. c, EFM-EPR spectra for a single triangle (A) with Em and B0 in the plane of the triangle and perpendicular to one Cu–Cu vector, simulated by using the SH parameters reported in Table 1, and different SE mechanisms. The blue line is computed assuming that the electric field induces Δgx/gx = Δgy/gy = 10−6 for each Cu ion according to Eq. (2), while the red line is obtained assuming a variation ΔJ/J = 10−5 for each Cu pair according to Eq. (3). The dashed black line shows the center of the EPR spectrum of the triangle.
When Em is applied in the triangle plane, the J couplings increase or decrease, depending on the direction and sign of Em, lifting the degeneracy of the two ground doublets (Fig. 3b). If Em is applied along the three-fold symmetry axis, g tensors can be influenced, but any out-of-plane component of \({\hat{p}}_{{ij}}\) pij affects all three J couplings identically, retaining the degeneracy of the two doublets. Simulated spectra for one triangle with applied Em as shown in Fig. 3a are depicted in Fig. 3c considering either a ∆g or ∆J variation. The computed angular dependence of the complete EFM-EPR signal is reported in Supplementary Fig. 7 and shows the expected 120° symmetry and the phase inversion at 60°.
This scenario remains substantially unaltered when the three-fold symmetry is removed, and two different J are assumed. Notably, the EFM-EPR detection of the variation of J induced by the electric field in the triangle requires an initial rhombicity of the g-tensor (see Supplementary Fig. 8). In extension to previous predictions12, SOC in the case of EFM-EPR is necessary to make the individual spins distinguishable due to the different orientation of the g-tensors and to induce a resonance shift with the electric field E, but it does not play any role in the SE coupling. The phenomenological model qualitatively describes the SE effect for an individual triangle; if all triangles were symmetry-related, a quantitative estimation of a linear SE effect would be possible by comparing the rescaled EFM-EPR and EPR intensities30. However, the EFM-EPR signals of the two families in the unit cell must be considered (Supplementary Figs. 9, 10 and Supplementary Note 4). The result is that for Cu3 crystals, the EFM-EPR signal is much weaker than the contributions of the individual triangles due to cancellation by superposition and is highly sensitive to subtle SH parameter differences between the two sets of pseudo-inversion symmetry-related triangles, preventing direct SE parameter quantification. To resolve this issue and separate the contributions to the SE effect, we performed ab initio computational studies.
Computational studies
An electric field affects a spin system through both electronic and ionic components, originating from electron density deformation and atomic displacement, respectively35,36. Computational studies for the exchange-coupled triangular complex Cu3 allow us to disentangle these contributions and quantify their impact on the g-tensor δg(Em) and coupling constants δJ(Em).
The prerequisite for SE coupling is the presence of electric dipole moments in the spin-frustrated ground state of the Cu3 molecule, which were investigated using the broken-symmetry (BS)-DFT ansatz. After calculating the high-spin (HS) state (| ↑↑↑⟩), a spin-flip procedure was applied to break the wavefunction symmetry. The charge rearrangement in the BS state and the resulting in-plane dipole moment \({{{\bf{p}}}}_{{{\bf{xy}}}}\) (\(|{p}_{{xy}}|=\sqrt{{p}_{x}^{2}+{p}_{y}^{2}}\) = 2.61 × 10⁻³¹/2.55 × 10−31 C m for A’/B) are shown in Fig. 4. As each BS state represents only one possible spin configuration, whereas each doublet of the spin-frustrated ground state consists of an equally weighted linear combination of all three configurations (| ↓↑↑⟩, | ↑↓↑⟩, and | ↑↑↓⟩), there is no permanent dipole in the ab plane. However, the application of an external electric field unbalances the energy and weight of the three BS configurations, resulting in the EFM-EPR signal. In a chemical picture, the SE effect originates from the presence of an in-plane C3-symmetric radial charge disparity in the electronic ground state of the spin-frustrated triangular molecule. In contrast, the C3 symmetry allows a permanent dipole moment \({{{\bf{p}}}}_{{{\bf{z}}}}\) along c in the BS state (\(\left|{p}_{z}\right|\) for A’/B: 1.07 × 10⁻³⁰/1.25 × 10−30 C m), with a similar value for the HS state, which is about five times larger than the in-plane moment \({{{\bf{p}}}}_{{{\bf{xy}}}}\).
Fig. 4: Ab initio calculated charge distribution.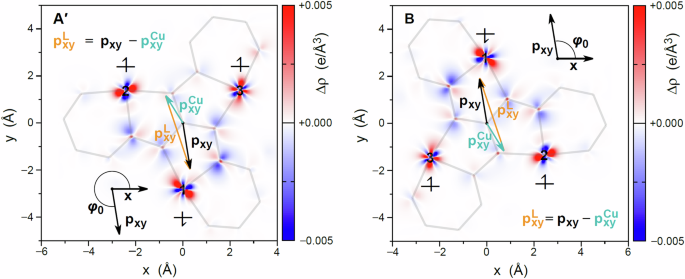
Contour plots representing the computed change in charge density within the trinuclear copper plane for the molecular species A’ (left) and B (right) in Cu3 after flipping the spin of Cu1 (\(|\downarrow \uparrow \uparrow \rangle\)), starting from the C3 symmetric ferromagnetic state (\(|\uparrow \uparrow \uparrow \rangle\)). Grey lines represent chelate rings in the molecular structures. The in-plane dipole moment \({{{\bf{p}}}}_{{{\bf{xy}}}}\) is shown as a black arrow. The insets define the angle φ0 between the x-axis and \({{{\bf{p}}}}_{{{\bf{xy}}}}\), where x corresponds to the Cu2-Cu3 direction. The dipole moment \({{{\bf{p}}}}_{{{\bf{xy}}}}^{{{\bf{Cu}}}}\) (cyan vector) of the three copper centers was obtained by a charge separation procedure utilizing natural atomic orbitals (see Supplementary Note 5). The dipole moment \({{{\bf{p}}}}_{{{\bf{xy}}}}^{{{\bf{L}}}}\) (orange vector) corresponding to the ligand system was determined by the difference \({{{\bf{p}}}}_{{{\bf{xy}}}}^{{{\bf{L}}}}={{{\bf{p}}}}_{{{\bf{xy}}}}-{{{\bf{p}}}}_{{{\bf{xy}}}}^{{{\bf{Cu}}}}\).
In Fig. 4, it is apparent that after flipping the spin of Cu1 (| ↑↑↑⟩ → | ↓↑↑⟩), the orientation of the dipole moment \({{{\bf{p}}}}_{{{\bf{xy}}}}\) does not fully coincide with the position vector of the flipped spin center, as schematized in Fig. 3. This is related to the lower C3 symmetry and can be rationalized by the electron density of the bridging diazine moiety, which is asymmetric with respect to Cu–Cu vectors (Supplementary Fig. 11). Separation of \({{{\bf{p}}}}_{{{\bf{xy}}}}\) into a metal (\({{{\bf{p}}}}_{{{\bf{xy}}}}^{{{\bf{Cu}}}}\)) and ligand part (\({{{\bf{p}}}}_{{{\bf{xy}}}}^{{{\bf{L}}}}\)), are depicted in Fig. 4 and their calculation is discussed in Supplementary Note 5. As expected, the more pronounced changes in electron density upon spin-flipping are localized on the copper sites. However, having both negative and positive signs, they weakly impact the induced dipole moment. On the contrary, the atoms on the bridging ligands exhibit clear electron depletion on the saltag arms bound to the flipped spin, thus providing the leading contribution to \({{{\bf{p}}}}_{{{\bf{xy}}}}.\) This suggests that ligand modifications influencing the radial charge disparity could eventually allow tuning the SE effect. Indeed, the computed \({{{\bf{p}}}}_{{{\bf{xy}}}}\) are around two orders of magnitude larger than the one computed for a Cu3 polyoxometalate structure14.
The electric field dependence δJij(Em) of the individual magnetic Cu–Cu pair interactions required for the EFM-EPR simulation were computed using electric-field-dependent broken-symmetry (EFD-BS) DFT (Supplementary Note 6). Under experimental conditions (69 kV m−1, the largest |δJ| was calculated to be 6.0 × 10⁻⁴ cm−1 (A’) and 5.9 × 10⁻⁴ cm−1 (B) (Table 2 and Supplementary Note 6), yielding relative magnitudes of |δJ/J | = 2.14 × 10⁻⁶ and 2.15 × 10⁻⁶ for the two triangles, respectively. The quadratic Stark effect, depending on the polarizability, was found negligible for the applied experimental field (Supplementary Note 6).
Table 2 Calculated SE coupling parameters
While DFT methods are known to provide accurate estimates of magnetic exchange interactions at an affordable computation cost, more demanding ab initio CASSCF/RASSI-SO calculations in the presence of electric fields were necessary to compute the SE effect on the local g-tensor of the individual copper ions, denoted as δg(Em) (Supplementary Note 7). The influence of the electric-field components \({E}_{k}\) (k = {X, Y, Z}), expressed in the orthogonal crystal reference frame (ab’c), on the single-ion g-tensor can be quantified by the SE coupling-tensor components \({T}_{k}=\frac{\partial g}{\partial {E}_{k}}\) within the frame of the local magnetic axes (α = {x, y, z}). Due to the low local symmetry, all \({T}_{k}\) are non-zero, indicating a strong anisotropy (Supplementary Note 7). Notably, \({T}_{k}({{\bf{A}}}^{{{\prime }}}){\approx -T}_{k}({{\bf{B}}})\) are consistent with the pseudo-inversion center. The largest in-plane absolute tensor component is \({{|T}}_{{Xy}}|\) = 1.8 × 10⁻¹² m V−1 (A’) and 1.6 × 10⁻¹² m V−1 (B), leading to a |δg| of approximately 1.2 × 10⁻⁷ (A’) and 1.1 × 10⁻⁷ (B) under the experimentally applied electric field. The relative effect |δg/g| is ~ 6 × 10⁻⁸, significantly smaller than |δJ/J | . \(|{{{\bf{p}}}}_{{{\bf{xy}}}}^{{{\bf{Cu}}}}| .
The permanent pz dipole allows for atomic displacement under an electric field35,36. To investigate the extent of the phenomenon and its effect on SH parameters, DFT geometry optimizations under applied electric fields along the c axis and subsequent ab initio CASSCF/RASSI-SO calculations were performed (Supplementary Note 8). The resulting effect, represented by δgdisp(Em), is shown in Table 2. Clearly, along c the atomic displacement dominates over the effect on the electronic cloud, being one order of magnitude larger (largest |δgdisp| at 69 kV/m: 6.0 × 10⁻⁶ (A’), 5.2 × 10⁻⁶ (B)). Furthermore, this effect strongly depends on the modeling of the disorder in the perchlorate anions near the trinuclear cationic complexes.
Simulation of the EFM-EPR spectra
The ab initio calculated field-dependent quantities δg(Em), δgdisp(Em), and δJ(Em) were used to simulate the EFM-EPR spectra (Supplementary Note 9).
Concerning the effect on the g-tensor, Eq. (2) was modified (∆gα → δgα(Em)) according to the calculated Tij matrix elements (Supplementary Note 7) as in Eq. (4), which also includes the deformation effect along the z axis, represented by \({{\bf{T}}}^{{\bf{disp}}}\). Note that all three gα values are affected by a general orientation of the electric field.
$${g}_{\alpha }\left({{{\bf{E}}}}_{{{\bf{m}}}}\right)={g}_{\alpha }+\,\delta {g}_{\alpha }\left({{{\bf{E}}}}_{{{\bf{m}}}}\right) \; {{\rm{with}}}\,\delta g\left({{{\bf{E}}}}_{{{\bf{m}}}}\right)=({\bf{T}}+{{{\bf{T}}}^{{\bf{disp}}}})\cdot {{{\bf{E}}}}_{{{\bf{m}}}}$$
(4)
The effect on the exchange constant of each Cu–Cu pair was adapted from Eq. (3) (∆Jij → δJij(Em)) to incorporate EFD-BS-DFT results, leading to Eq. (5).
$${J}_{{ij}}\left({{{\bf{E}}}}_{{{\bf{m}}}}\right)=J+\delta {J}_{{ij}}({{{\bf{E}}}}_{{{\bf{m}}}})$$
(5)
The modulation of exchange constants by the electric field (δJ12, δJ13, and δJ23) for each copper triangle is given in Supplementary Note 6, considering the dipole moment orientations.
Using the ab initio calculated parameters, the intensity of the single-crystal EFM-EPR spectra in the ab plane is correctly simulated, while the shape, as well as the center of the spectrum, are only approximately reproduced (Fig. 2a–c). Despite that, it is evident that for in-plane EFM-EPR spectra the effect induced by δJ(Em) dominates over the one induced by δg(Em) (Supplementary Figs. 12 and 13), as |δJ/J| is about 35 times larger than |δg/g | . Moreover, the comparison of the simulated EFM-EPR signals between individual triangles and the crystal unit cell shows that, in the ab plane, only ca. 25% of the signal of the individual triangles is left due to the partial cancellation resulting from pseudo-inversion symmetry between the two families of molecules (Supplementary Fig. 14).
When electric and magnetic fields are oriented along the polar c axis, atomic displacements by the electric field due to the permanent dipole moment \({{{\bf{p}}}}_{{{\bf{z}}}}\) become dominant. The best agreement with experimental data was found with one perchlorate species per trinuclear complex (Supplementary Note 8). The distinct shape of the EFM-EPR signal compared to that in the ab plane is attributed to the vanishing \(|\delta {g}_{z}^{{disp}}|\), resulting in no shift of the individual signals. Simultaneously, the larger in-plane \(|\delta {g}_{x,y}^{{disp}}|\) values alter transition probabilities and EPR intensity, resulting in the absorption-like EFM-EPR signal, in contrast to the first derivative shape of the weaker purely electronic δg(Em) contribution (Supplementary Fig. 15). Including both δg(Em) and δgdisp(Em) effects, the simulated spectrum reproduces the experimental shape but with lower intensity (Supplementary Fig. 16). This discrepancy could arise from approximations in the theoretical calculation and/or unresolved hyperfine interactions with the copper nuclear spin. Generally, hyperfine interactions in metal ions correlate with g values and are expected to be affected by electric fields37,38 (Supplementary Note 9). A tentative simulation addressing the implications of electric field effects on unresolved copper hyperfine interactions is reported in Supplementary Fig. 16.