Knowing how much of their safety net can be relied upon—and how much they need to have saved to maintain a comfortable lifestyle—is of crucial importance to Americans as they plan and manage their finances before and during retirement.
A new report from LendingTree has detailed the cities where retirees are able to stretch their Social Security payments the furthest, as well as those where local costs mean they must rely more heavily on other sources of income.
Why It Matters
According to the study, Social Security on average covers 30 percent of retirees’ spending, reaching more than a third in only one of the 100 largest metropolitan statistical areas.
The regional differences in cost of living mean where Americans choose to live and retire can significantly affect how far these benefits go—dictating whether their retirement is defined by security or financial strain—which is of critical importance to those with limited supplemental savings.
A Social Security Administration office in Mount Prospect, Illinois, in 2022.
A Social Security Administration office in Mount Prospect, Illinois, in 2022.
Nam Y. Huh/AP
What To Know
According to LendingTree, across the 100 largest metro areas, retirees require on average $71,407 pretax. By comparison, Social Security income in these areas accounts for about $21,500, therefore covering 30.1 percent of spending.
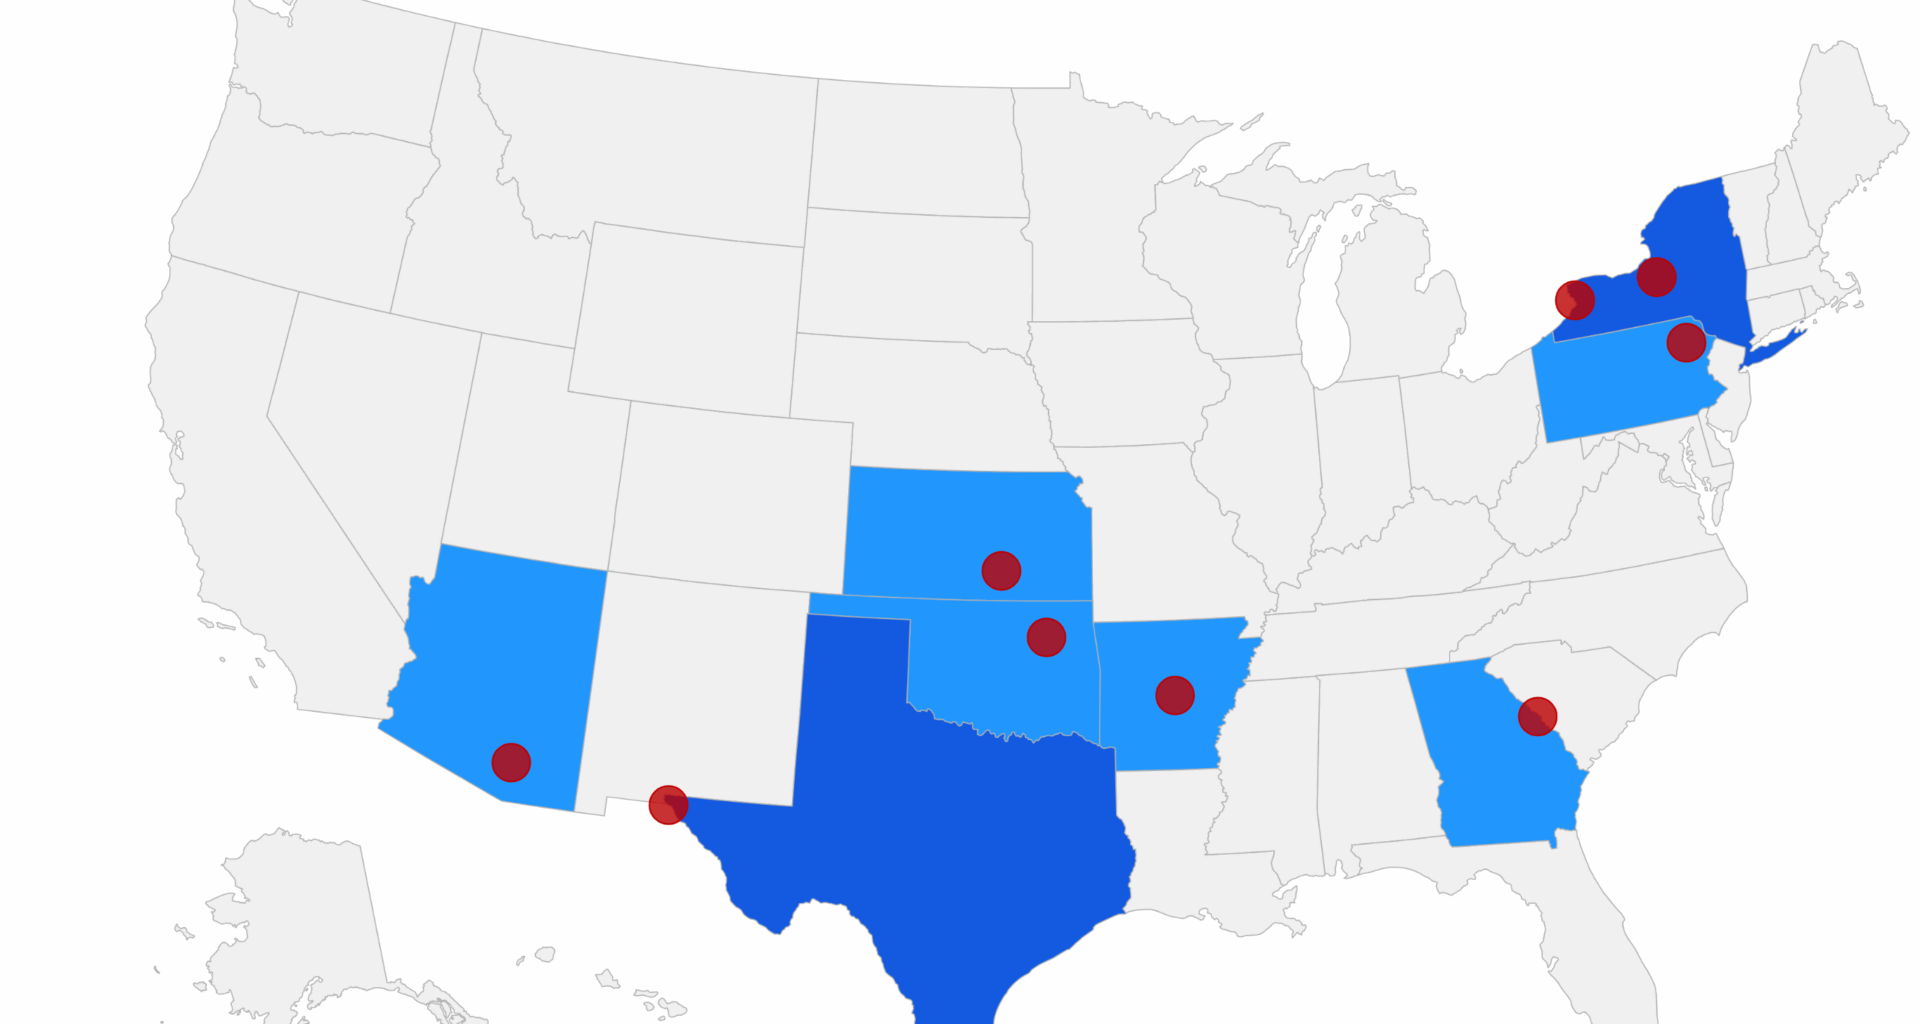
LendingTree examined these areas based on data from the Bureau of Labor Statistics, the Bureau of Economic Analysis, the Census Bureau, the Social Security Administration and the Tax Foundation. Its analysis of financial needs versus income allowed for a ranking of the top 10 states where Social Security covers the highest percentage of retirees’ spending, seen on a map below created by Newsweek.
McAllen, Texas, ranked first. With its low cost-of-living, Social Security covers 34.6 percent of spending.
The other nine cities in the top 10 of LendingTree’s rankings are these:
- Buffalo, New York. Percentage covered: 33.1
- El Paso, Texas. Percentage covered: 32.9
- Syracuse, New York: Percentage covered: 32.8
- Scranton, Pennsylvania. Percentage covered: 32.7
- Wichita, Kansas. Percentage covered: 32.6
- Augusta, Georgia. Percentage covered: 32.4
- Tucson, Arizona. Percentage covered: 32.3
- Little Rock, Arkansas. Percentage covered: 32.3
- Tulsa, Oklahoma. Percentage covered: 32.3
Perhaps predictably, given the upward pressure of housing prices on the state’s overall cost of living, most of the cities at the bottom of the list are in California.
San Francisco ranked last on the list of 100 metros. With $85,364 in average estimated annual expenditures before tax and $20,726 in social security retirement income, retirees would see 24.3 percent of their spending covered.
The other nine cities in the bottom 10 of LendingTree’s rankings are these:
- Los Angeles, California. Percentage covered: 24.9
- Washington, D.C. Percentage covered: 24.9
- Oxnard, California. Percentage covered: 25.3
- San Jose, California. Percentage covered: 24.4
- San Diego, California. Percentage covered: 25.7
- Sacramento, California. Percentage covered: 26.4
- Riverside, California. Percentage covered: 26.6
- Stockton, California. Percentage covered: 26.7
- Miami, Florida. Percentage covered: 26.9
What People Are Saying
Matt Schulz, LendingTree’s chief consumer finance analyst, said: “Most aren’t fortunate enough to have a seven-figure nest egg or a pension to lean on. Most people have tight budgets, limited expendable income and low retirement account balances. It’s all going to add up to a challenging situation for retirees and their loved ones in the next 15 to 20 years.”