
For the first week data is collected, bat speed tells you more about what to expect for a batter’s rest-of-season power than any other metric. A few weeks into the season, Barrel rate tells you a little bit more. But now we’re more than a month into the season and there are players with good bat speed and good Barrel rates, and no power to show for it. What do we make of those players?
We can put together a list of players with high Barrel rates but low slugging numbers. And we can even show that nine out of the 10 biggest outliers are just not pulling the ball in the air (the league average in Pull Air percentage is just above 18 percent). And we can point out that the slugging percentage on a pulled fly ball was 250 points higher than an opposite field fly ball, or a straightaway fly ball. Here’s that list.
Better days ahead for these bats?
4
0.141
15.9%
10.1%
3
0.115
14.6%
16.3%
2
0.119
13.6%
13.3%
3
0.143
12.8%
11.0%
1
0.115
12.7%
12.7%
2
0.099
12.7%
10.7%
3
0.150
12.6%
15.1%
2
0.126
12.2%
19.4%
0
0.053
12.0%
5.0%
4
0.135
11.5%
12.4%
So the problem here for everyone on this list is just that they need to start pulling the ball in the air, right? Maybe. But of course it’s not that simple.
If it were that simple, putting a player’s Pull Air percentage into expected slugging stats would make those numbers more predictive, which it doesn’t. If it were that simple, these players could all just try to pull the ball in the air more. As it turns out, that’s not so simple either.
After watching Mitch Haniger hit ball after ball to the opposite field in batting practice, I asked him why he practiced that if we both knew that pulled balls in the air were the best batted ball type.
“If I practice hitting balls to the opposite field, I’ll pull them in the game,” he said.
Padres hitting coach Steven Souza Jr. might have been telling Dennis Lin something similar the other day.
“One of the interesting things about pulling the ball or just driving the ball is it actually is less effort, to be honest,” Souza said. “It’s trusting the fluidity of your swing, knowing when to take your shots, knowing how to stay through the ball. And being able to catch the ball deeper, which is kind of counterintuitive, because I know all the metrics say, ‘Hey, when you hit the ball out front, you hit it in the air, it’s the best possible outcome.’”
Despite having a list of players who (other than Ronald Acuña Jr.) seemingly all have the same problem, we’re probably looking at different diagnoses for each player. Let’s take a look at four of those players on the list and what might specifically be impacting the power numbers for each of them.
(All stats through Wednesday, May 6)
Bobby Witt Jr., SS, Kansas City Royals
It looks like Witt has lost a tick of bat speed. But has he really? He’s seeing fewer fastballs and more sweepers and cutters. What if he’s just swinging a little slower at slower pitches? Take a look at Witt’s swing against fastballs in the zone last year compared to this year.
Bobby Witt Jr. vs in-zone fastballs
2025
74.1
28
2
22.7
2026
73.6
28
0
22.3
It’s hard to make much of any slight differences on this table. Yes, a higher attack angle is better, but there’s nothing to the shape of his swing that suggests that he’s doing something wrong. Maybe the fact that he’s letting fastballs travel less than half an inch further means he’s not lifting the fastball as well as he did last year, but these are tiny differences in timing.
Maybe there’s a few milliseconds of timing missing for Witt right now. Or perhaps most of the change this year comes from the fact that he’s been a little bit unlucky. Last year, he slugged .661 on fastballs in the zone, and he was expected to slug .691 given the exit velocities and launch angles of those balls. This year, he’s slugged .571 on fastballs in the zone against an .855 expected number.
Fernando Tatis Jr., RF, San Diego Padres
The change in spray charts for the homerless Tatis is stark. Look at all the missing pull-side fly balls on these FanGraphs spray charts:

Given the history with his shoulder, injury could be a factor, but the bat speed is still there. He’s a notorious tinkerer, and thanks to Baseball Savant you can see just how different his stance this year (right) is versus a year ago (left).

Two things stand out. One, his back toe has been drifting back towards the catcher, which lines Tatis up to hit the ball to right field. Secondly, as much as he looks more similar at the end of his swing now than he did at the beginning, Tatis’ front foot in 2026 is more open and closer to the plate when he lands. This might lead to the paradoxical feeling from many fans that he’s trying to pull everything while the numbers say he’s pulling nothing. He’s pointing towards right field (back foot) and diving into the ball a little (front foot) and working against his body.
That might just be what it looks like from the outside. But it does illustrate how a few inches here or there can make a huge difference. Through this lens, it seems likely that he can make these adjustments and at least get back to the post-suspension, post-injury baselines he’s established over the last few years. Maybe just re-aligning his stance a little will help him get there.
Jarren Duran, LF, Boston Red Sox
Again, from the top level, Duran’s issues look simple: He’s just hitting more ground balls. He should hit those in the air. Boom.
Of course, it isn’t that simple. Pitchers have a say in this, after all. They’re throwing Duran fewer four-seamers, for instance. Generally, they’re throwing him fewer pitches up in the zone, which makes sense. He has a flatter swing than most, meaning he should be a little vulnerable down in the zone. Last year, which was Duran’s best year for pulling the ball in the air, he did most of his damage up in the zone.

Unlike Tatis, though, Duran has had a career-long issue with pulling the ball in the air and has never done it at an above-average rate. He’ll hit for power because he swings hard and hits the ball hard, but there’s no real reason to think that his Barrel rate presages more power than usual. He’ll likely end up with his 16-20 homers and numbers that look more like last year than anything else.
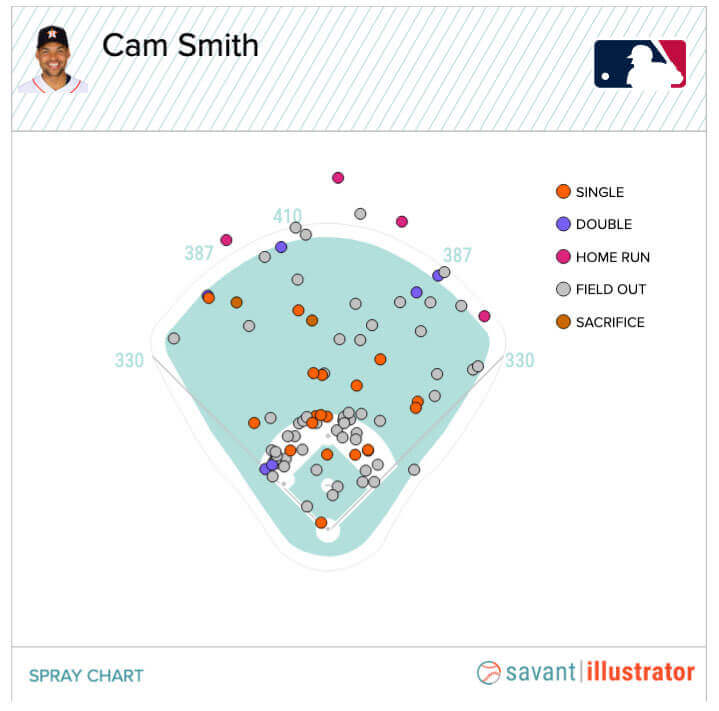
Cam Smith, RF, Houston Astros
If most of these adjustments are a game of inches and milliseconds, Smith’s adjustment looks like it might be even smaller. His expected production on balls in play is in the top 10 percent of the league currently, and while he’s not pulling it in the air right now, look how much of what he’s doing is going to center field.
He’s getting the ball out in front with a good average attack angle and plus-plus bat speed. His swing is a little longer this year, and he’s doing nothing against changeups, but this looks like the progression of a young player figuring out what the league is trying to do to him and exactly when to swing. He’s swinging less at pitches in the zone and more outside the zone, practically the only negative peripheral on his docket. But players generally swing less at pitches outside the zone as they age, which would put just the right finish on Smith’s game.
I continue to think that he’s one of the most exciting young five-tool players who you might still be able to acquire in fantasy leagues, and a particularly strong play in keeper leagues where you get the benefit of a bigger window during which he could take that leap. Watching him approach that next level of play is one of the few bright spots on this Astros team right now, too.