
Release date: February 5, 2025
On this page
Text begins
Start of text box
Overview of the study
Using data from the 2023 National Graduates Survey (class of 2020), this study examines the early labour market outcomes of international student graduates relative to Canadian graduates who remained in Canada three years after completing their education.
- The vast majority (90.3%) of graduates who remained in Canada three years after completing their education were employed three years after graduation. However, international student graduates (88.6%) generally had lower employment rates than their Canadian counterparts (91.0%).
- At the undergraduate level (college or bachelor’s), international student graduates were more likely to be employed within sales and service occupations than Canadian graduates, while they were more likely employed in the natural and applied sciences than their Canadian counterparts at the graduate level (master’s or doctorate).
- International student graduates earned, on average, 19.6% less than Canadian graduates three years after graduation. The difference in income between international student graduates and Canadian graduates held at all levels of study, and those with a bachelor’s (48.7%) or master’s degree (50.5%) were less likely to be satisfied with their salary than Canadian graduates (58.0% and 60.3%, respectively).
- International student graduates with a college diploma (44.3%) or a bachelor’s degree (33.8%) were less likely than Canadian graduates (63.6% and 62.4%, respectively) to feel that their jobs were closely related to their field of study. Further, international student graduates with a college diploma (30.9%) were more likely to perceive themselves to be overqualified for their job than Canadian graduates (20.7%) with the same level of study.
End of text box
Introduction
Until recently, the number of international students studying in Canada has increased substantially in recent decades, more than doubling (142,200 to 388,800) from 2010 to 2019.Note However, international student graduates may face more challenging school-to-work transitions (e.g., lower employment rates, lower employment income) at least initially, than Canadian graduates with the same level of education.Note In particular, the graduating class of 2020 faced unique challenges to their labour market entry during the COVID-19 pandemic.Note More than half reported changes to their employment status or employment plans due to the pandemic, and nearly one-third (30.6%) lost their job or were laid off in 2020.
Using data from the 2023 National Graduates Survey (class of 2020), this study compares the early labour market outcomes of international student graduates with those of Canadian graduates. The analysis is limited to graduates who completed their postsecondary education program in 2020, who were living in Canada three years after graduation, and who did not pursue further postsecondary education after graduation in 2020. For more information on the data used in this study, please refer to the text box “Data sources, methods and definitions”.
Differences between the early labour market outcomes of international student graduates and Canadian graduates are examined by level of study (college, bachelor’s, master’s or doctorate). In some instances, results are aggregated by undergraduate (college or bachelor’s) versus graduate (master’s or doctorate) education to simplify the general trends.
The literature shows that completing studies in Canada is associated with advantages in the labour market (e.g., earnings).Note Yet, international student graduates who have completed their most recent studies in Canada still face employment-related challenges (e.g., lower employment rates, lower employment income), relative to Canadian graduates.Note Despite this understanding, less is known about the various occupations international students pursue, and their perceptions of various metrics relating to job quality (e.g., satisfaction with salary, job security, job relatedness) which is what this study aims to shed light on.
About 6 in 10 international student graduates of 2020 were South Asian or Chinese
In 2023, there were approximately 83,300 international student graduates who remained in Canada after completing their studies in 2020, comprising 24.0% of all 2020 graduates.
Over half (56.0%) of international students who graduated in 2020 completed a college diploma compared with 40.0% of Canadian graduates (Table A.1). Another quarter (24.7%) completed a bachelor’s degree, about half the rate observed among Canadian graduates (45.3%). Similar proportions of international student and Canadian graduates completed a master’s degree (16.9% compared with 13.1%, respectively) or a doctorate (2.4% compared with 1.5%, respectively).
The majority of international students who graduated in 2020 were South Asian (48.1%) or Chinese (12.0%). A significant proportion were also Black (10.0%) or Latin American (7.2%). In comparison, the largest proportion of Canadian graduates were white (63.8%), although a significant proportion were also South Asian (7.3%) or Chinese (6.1%).
A slightly higher percentage of international student graduates identified as men (54.1%), while conversely, there were slightly more women (54.2%) in the Canadian graduate population. The median age of international student graduates at the time of graduation was 25 years, the same as Canadian graduates.
In regard to field of study, business, management, and public administration was the most common program for both international student graduates (36.3%) and Canadian graduates (24.9%). This was followed by architecture, engineering and related technologies (20.8%) and mathematics, computer and information sciences (11.6%) for international students, and by health and related fields (15.9%), architecture, engineering and related technologies (14.2%) and social behavioural sciences and law (14.1%) for Canadian graduates across all levels of study.
International student graduates were less likely to be employed 3 years after graduation than their Canadian counterparts
The majority (90.3%) of graduates who did not continue their studies and remained in Canada were employed three years after graduation. However, there were differences between the employment rates of these international student graduates and Canadian graduates, which may indicate more challenging school-to-work transitions for some international student graduates.
In 2023, that is three years after graduation, the employment rate of international student graduates was 88.6%, while it was 91.0% among Canadian graduates (Table 1). In addition, a greater proportion of international student graduates (7.8%) than Canadian graduates (4.2%) were looking for work 3 years after graduation.
The employment rate also varied by education level and was often higher among Canadian graduates. Indeed, the employment rate of international student graduates was lower than that of Canadian graduates at the bachelor’s (84.5% compared with 91.9%), master’s (91.3% compared with 94.6%), and doctoral (90.6% compared with 94.2%) levels. There was however no significant difference in the employment rates of international student graduates (89.6%) and Canadian graduates at the college level (88.6%).
Table 1
Labour force status of international student graduates and Canadian graduates who graduated in 2020, by level of study, 2023
Table summary
The information is grouped by Labour force status (appearing as row headers), All education levels, College, Bachelor’s, Master’s and Doctorate, calculated using percentage units of measure (appearing as column headers).
Labour force status
All education levels
College
Bachelor’s
Master’s
Doctorate
percentage
Source: Statistics Canada, National Graduates Survey, 2023.
International student graduates
Employed
Unemployed
Not in the labour force
Canadian graduates (ref.)
Employed
Unemployed
Not in the labour force
International student graduates at the college and bachelor’s level were more likely to work in sales and service occupations
Differences also emerge when examining the occupations of the international student graduates and Canadian graduates. Among international student graduates with an undergraduate education, employment was heavily concentrated within sales and service occupations. Indeed, international student graduates with a college diploma were two times more likely to work in sales and service occupations than Canadian graduates (34.8% vs. 17.4%), and those with a bachelor’s were over three times more likely to work in this type of occupations than Canadian graduates (30.6% vs. 9.5%) (Table 2).
In comparison, Canadian graduates with an undergraduate education were less concentrated in any single occupational group, and instead were evenly dispersed across a greater number of occupational groups. They were also more likely to be employed in health occupations and occupations in education, law, social, community, and government services than international student graduates with the same level of study. For example, the percentage of Canadian graduates employed in health occupations with a college diploma was more than two times that of international student graduates (16.1% vs. 6.1%), as well as those with a bachelor’s (22.6% versus 8.5%).
At the graduate level (master’s, doctoral), international student graduates and Canadian graduates were concentrated in a small number of occupational groups. The employment of international student graduates was greatly concentrated in the natural and applied sciences. In 2023, nearly half of international student graduates with a master’s (44.5%) and doctorate (45.8%) were employed in the natural and applied sciences, compared with around one-fifth of Canadian graduates with a master’s (18.2%) or doctorate (21.0%). More specifically, over half of the international student graduates with a graduate degree who were employed in this occupational group were computer and information systems professionals (22.7%), computer, software and web designers and developers (21.3%), or mathematicians, statisticians, actuaries and data scientists (12.4%). In comparison, Canadian graduates with a graduate education were more likely to be employed in education, law, social, community, and government services. For example, over one-third (38.0%) of Canadian graduates with a master’s were employed within this occupational group, compared to 8.4% of international student graduates.
Table 2
Broad occupational category for job of 2020 graduates, by level of study and student/resident status, 2023
Table summary
The information is grouped by Broad occupational category (appearing as row headers), All education levels, College, Bachelor’s, Master’s and Doctorate, calculated using percentage units of measure (appearing as column headers).
Broad occupational category
All education levels
College
Bachelor’s
Master’s
Doctorate
percentage
- Note x
-
suppressed to meet the confidentiality requirements of the Statistics Act
Source: Statistics Canada, National Graduates Survey, 2023.
International student graduates
Management occupations
Business, finance and administration
Natural and applied sciences and related
Health occupations
Occupations in education, law, social, community, and government services
Occupations in art, culture, recreation and sport
Sales and service occupations
Trades, transport, equipment operators and related occupations
Natural resources, agriculture, related production occupations
Occupations in manufacturing and utilities
Canadian graduates (ref.)
Management occupations
Business, finance and administration
Natural and applied sciences and related
Health occupations
Occupations in education, law, social, community, and government services
Occupations in art, culture, recreation and sport
Sales and service occupations
Trades, transport, equipment operators and related occupations
Natural resources, agriculture, related production occupations
Occupations in manufacturing and utilities
Education-job match is similar among college graduates, but differs between international student graduates and Canadian graduates with a bachelor’s or master’s degree
One way to determine whether graduates obtain jobs aligned with their level of study is to examine the training, education, experience, and responsibility (TEER) required for their position. The measure of the TEER used in this study is derived from the 2021 National Occupational Classification (NOC), which transitioned from the four previous “skill levels” into the redesigned six TEER categories.Note
According to the TEER, education-job match of international student graduates and Canadian graduates with a college diploma was similar. In 2023, over half of international student graduates (53.6%) and Canadian graduates (58.2%) with a college diploma held jobs that typically require the completion of a postsecondary program at a community college, institute of technology, or CEGEP (TEER 2 or 3). The remainder of international student graduates and Canadian graduates with a college diploma were either employed in jobs that do not require a postsecondary certificate, diploma, or degree (TEER 4 and 5) (25.7% and 21.9%, respectively) or in jobs that usually require a university degree (20.7% and 19.9%, respectively).
However, at the bachelor’s and master’s levels, international student graduates were less likely than Canadian graduates to be employed in jobs that typically require the completion of their level of study, which may indicate a more challenging career entry for some international student graduates. At the bachelor’s level, just over one-third of international student graduates (36.6%) were employed in jobs that typically require the completion of a degree from a university (bachelor’s, master’s, or doctorate), compared with over half (58.8%) of Canadian graduates. A similar trend is found at the master’s level, as international student graduates (66.9%) were also less likely to be employed in jobs that are aligned with their level of study than Canadian graduates (85.1%). There was no significant difference at the doctoral level.
Rates of self-perceived overqualification were similar between many international student graduates and Canadian graduates
International student graduates were less likely to feel that their job was closely related to their field of study. Indeed, a lower proportion of international student graduates with a college diploma, bachelor’s, and master’s felt that their job was “closely related” to their field of study compared to Canadian graduates with the same level of education (Table 3). This difference was particularly pronounced at the bachelor’s level, where one third (33.8%) of international student graduates felt that their job was closely related to their field of study, compared with nearly two-thirds (62.4%) of Canadian graduates.
The rates of self-perceived overqualification were similar between international student graduates and Canadian graduates, except among those with a college diploma. In 2023, three in ten (30.9%) international student graduates with a college diploma felt that they were overqualified for their job, compared to one-fifth (20.7%) of Canadian graduates with the same level of study.
Table 3
Perceived job alignment of international student graduates and Canadian graduates who graduated in 2020, by level of study, 2023
Table summary
This table displays the results of Perceived job alignment of international student graduates and Canadian graduates who graduated in 2020, by level of study, 2023 All education levels, College, Bachelor’s, Master’s and Doctorate, calculated using percentage units of measure (appearing as column headers).
All education levels
College
Bachelor’s
Master’s
Doctorate
percentage
Source: Statistics Canada, National Graduates Survey, 2023.
International student graduates
Job relatedness
Closely related
Somewhat related
Not at all related
Job qualification
Overqualified
Qualified
Underqualified
Canadian graduates (ref.)
Job relatedness
Closely related
Somewhat related
Not at all related
Job qualification
Overqualified
Qualified
Underqualified
International student graduates had lower median employment income than Canadian graduates with the same level of study
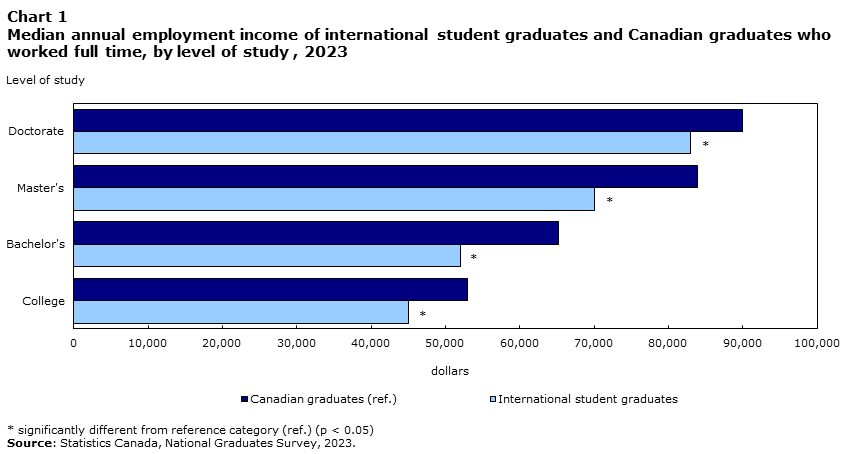
Consistent with past researchNote and the previous findings on education-job match, the median annual employment income of international student graduates who worked full time in 2023 was lower than that of Canadian graduates.
This held at all levels of study, but the difference was most notable at the bachelor’s and master’s levels. In 2023, the median annual employment income of international student graduates ($52,000) with a bachelor’s degree working full-time was 20.2% lower than that of Canadian graduates with a bachelor’s degree ($65,200) (Chart 1). At the master’s level, international student graduates ($70,000) earned 16.6% less than their Canadian counterparts ($83,900).
These findings may be related in part to the occupations international student graduates are employed within, particularly at the college and bachelor’s level. Indeed, in 2023, a greater proportion of international student graduates were employed within the sales and service sector, which had lower median income than the national median. However, the occupational sector does not necessarily explain the difference in income observed at the master’s and doctoral levels, where a large proportion of international student were employed in the natural and applied sciences, a sector where incomes are usually higher than the national median.
Data table for Chart 1
Chart 1
Median annual employment income of international student graduates and Canadian graduates who worked full time, by level of study, 2023
Table summary
The information is grouped by Level of study (appearing as row headers), Employment income, International student graduates and Canadian
graduates (ref.), calculated using dollars units of measure (appearing as column headers).
Level of study
Employment income
International student graduates
Canadian
graduates (ref.)
dollars
Source: Statistics Canada, National Graduates Survey, 2023.
College
Bachelor’s
Master’s
Doctorate
International student graduates had similar job satisfaction and satisfaction with job security as Canadian graduates, but were less satisfied with their salary
Despite some of the labour market challenges identified above, international student graduates had similar levels of perceived job satisfaction (81.0% compared with 82.0%) and job security (75.8% compared with 79.1%) when compared to Canadian graduates (Table 4).
However, their lower annual employment income may have contributed to their lower rates of salary satisfaction. Indeed, international students with a bachelor’s (48.7% compared with 58.0%), master’s (50.5% compared with 60.3%), or doctorate (56.8% compared with 62.6%) were less likely to be satisfied with their salary than Canadian graduates. The difference in terms of satisfaction with salary was greatest at the bachelor’s and master’s levels, where the proportions of international student graduates satisfied with their salary were 9.3 and 9.8 percentage points lower, respectively, than those of their Canadian counterparts.
Table 4
Satisfaction with job, salary, and job security of international student graduates and Canadian graduates who graduated in 2020, by level of study, 2023
Table summary
This table displays the results of Satisfaction with job, salary, and job security of international student graduates and Canadian graduates who graduated in 2020, by level of study, 2023 All education levels, College, Bachelor’s, Master’s and Doctorate, calculated using percentage units of measure (appearing as column headers).
All education levels
College
Bachelor’s
Master’s
Doctorate
percentage
Source: Statistics Canada, National Graduates Survey, 2023.
International student graduates
Satisfaction with Job
Satisfied
Neither satisfied nor dissatisfied
Dissatisfied
Satisfaction with Salary
Satisfied
Neither satisfied nor dissatisfied
Dissatisfied
Satisfaction with Job Security
Satisfied
Neither satisfied nor dissatisfied
Dissatisfied
Canadian graduates (ref.)
Satisfaction with Job
Satisfied
Neither satisfied nor dissatisfied
Dissatisfied
Satisfaction with Salary
Satisfied
Neither satisfied nor dissatisfied
Dissatisfied
Satisfaction with Job Security
Satisfied
Neither satisfied nor dissatisfied
Dissatisfied
Conclusion
Using data from the 2023 National Graduates Survey, this study provided an overview of select early labour market outcomes of international student graduates relative to Canadian graduates.
The study shows that the vast majority of international student graduates and Canadian graduates who remained in Canada were employed three years after graduation. However, international student graduates generally had lower employment rates than their Canadian counterparts. They also had a different occupational profile from Canadian graduates. International student graduates with an undergraduate degree were more likely to be employed in sales and service occupations than Canadian graduates, whereas those with a graduate degree were most often found within the natural and applied sciences.
The education-job match of international student graduates and Canadian graduates was similar. However, at the bachelor’s and master’s levels, international student graduates were less likely than Canadian graduates to be employed in jobs that typically require the completion of their level of study, which may indicate a more challenging career entry for some international student graduates.
Although international students were overall less often employed in jobs that were related to their level and field of study, their satisfaction with job and job security was similar to that of Canadian graduates. However, international student graduates were less satisfied with their salary than Canadian graduates, which is consistent with the fact that they earned less per year than their Canadian counterparts.
Brittany Etmanski is a senior analyst at the Centre for Labour Market Information at Statistics Canada.
Appendix
Table A.1
Selected demographic characteristics of international student graduates and Canadian graduates who graduated in 2020
Table summary
The information is grouped by Characteristics (appearing as row headers), All graduates, International student graduates and Canadian graduates (ref.), calculated using percentage units of measure (appearing as column headers).
Characteristics
All graduates
International student graduates
Canadian graduates (ref.)
percentage
Source: Statistics Canada, National Graduates Survey, 2023.
Sex
Men
Women
Education level
College
Bachelor’s
Master’s
Doctorate
Population group
White
South Asian
Chinese
Black
Filipino
Arab
Latin American
Southeast Asian
West Asian
Korean
Japanese
Other
Program of Study
Education
Visual and performing arts, and communications technologies
Humanities
Social and behavioural sciences and law
Business, management and public administration
Physical and life sciences and technologies
Mathematics, computer and information sciences
Architecture, engineering, and related technologies
Agriculture, natural resources and conservation
Health and related fields
Personal, protective and transportation services
Other
Data sources, methods, and definitions
Data sources
This study uses data from the 2023 National Graduates Survey (NGS). The target population for the NGS, class of 2020, corresponds to graduates of public postsecondary educational institutions in Canada during the 2020 calendar year who were living in Canada at the time of the interview in 2023.
Only graduates from programs at a college or university level which are three months’ duration or longer are in-scope for NGS. Graduates with a trades or vocational certificate or diploma are not included in the NGS.
All analysis on labour market outcomes excludes graduates who pursued further postsecondary education between graduation and the time of the interview.
Employed respondents are those who did any work for pay or profit or had a job and were absent from work at the time of interview in 2023. Working full time refers to usually working 30 hours or more per week at a single job or business.
Definitions
International student graduate includes graduates who held a study or work permit when they started the program from which they graduated in 2020.
Canadian graduate includes graduates who did not hold a study or work permit when they started the program from which they graduated in 2020.
College includes college or other non-university certificates, college or other non-university diplomas, CEGEP certificates, and CEGEP diplomas.
Bachelor’s includes bachelor’s degrees, degrees in medicine, dentistry, veterinary medicine and optometry, university certificates below bachelor’s degrees, and university diplomas below bachelor’s degrees.
Master’s includes master’s degrees, university diplomas above bachelor’s degrees, and university certificates above bachelor’s degrees.
Doctorate includes those who obtained a doctoral degree (which usually takes a minimum of three or more years to complete) after receiving a master’s degree. It excludes “Honorary” doctorates awarded as an honour to important persons.
Undergraduate education includes graduates who completed either a college diploma or a bachelor’s degree.
Graduate education includes graduates who completed either a master’s or doctorate.
Notes
- Note
-
Crossman, Choi, Lu, and Hou, 2022.
- Note
-
Frenette, Lu, & Chan, 2019.
- Note
-
Statistics Canada, 2024.
- Note
-
Crossman, Choi, Lu, and Hou, 2022.
- Note
-
Frenette, Lu, & Chan, 2019.
- Note
-
Graduates’ training, education, experience, and responsibility (TEER) categories are derived from the 2021 National Occupation Classification (NOC). More information about the TEER categories can be found in the references. Management occupations (TEER 0) were excluded from the analysis given the ambiguity of the level of study of these respondents.
- Note
-
Choi, Hou, and Chan, 2021.
Related information
Related Articles
Data sources
Bibliographic references