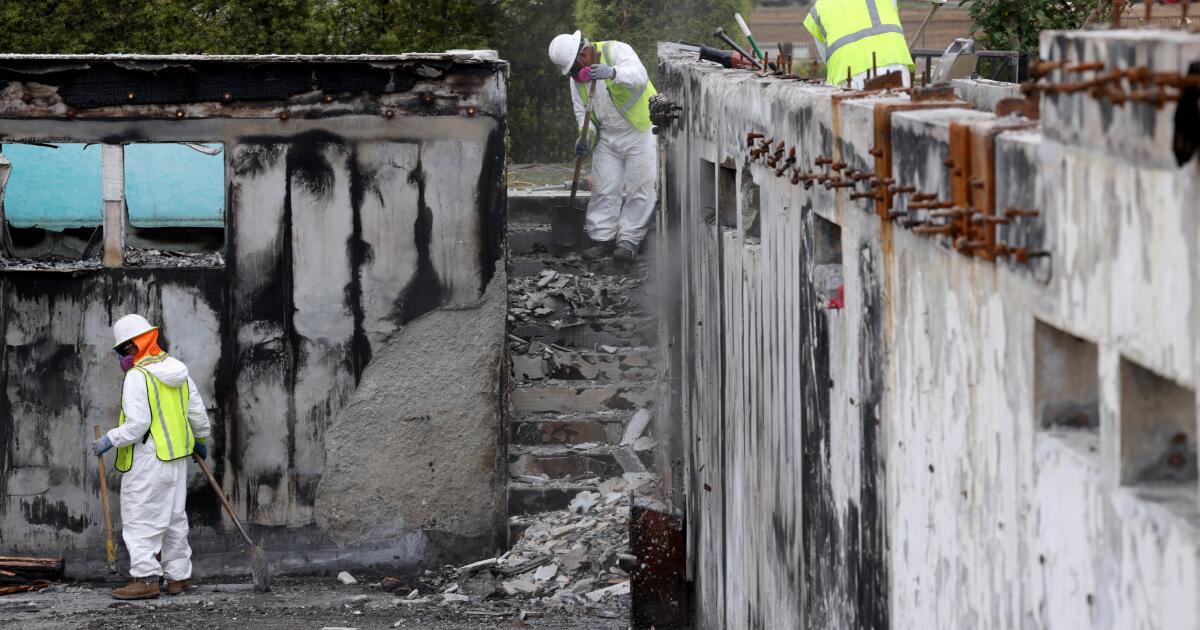
LOS ANGELES — UCLA researchers have launched 20 new air pollution monitors across northwest Los Angeles County to better understand how much fine ash and coarse dust are being kicked up in the Palisades fire burn area as reconstruction advances. The network stretches from Topanga State Park through Brentwood and Santa Monica, updating every five to ten minutes on an online map.
“We heard clear community needs — real-time data, user-friendly design, and granular neighborhood coverage,” said Yifang Zhu, a professor in the UCLA Department of Environmental Health Sciences and director of the project. Zhu had seen that Caltech had put up a similar network for areas affected by the Eaton fire.
The new sensors track airborne particulate matter — a complex mix of substances such as soil, dust, and metals — in two main sizes: fine, PM 2.5, no larger than 2.5 microns, or roughly 1/30 the width of a human hair, and coarser particles, PM 10, roughly the size of a cotton fiber.
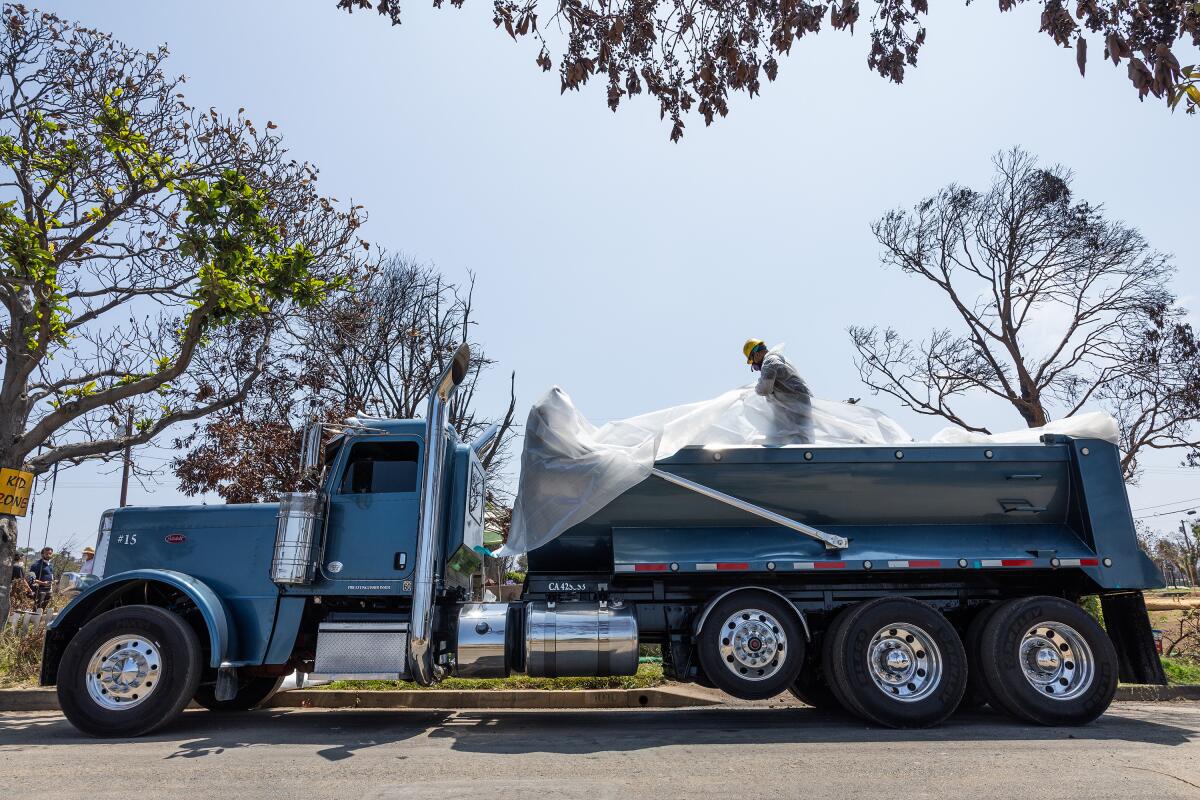
A worker folds and tapes a tarp carrying debris from a house in Pacific Palisades on June 25, 2025.
(Myung J. Chun / Los Angeles Times)
All are small enough to be inhaled into the nose, throat, and upper airways and can cause a wide range of health issues. PM 2.5 is linked to asthma attacks, premature death as well as acute and chronic bronchitis. Although less studied, PM 10 has been tied to adverse health effects, especially among infants, children, and older people who have lung or heart conditions.
The public already can see real-time air pollution levels on several websites, including those of the U.S. Environmental Protection Agency, the South Coast Air Quality Management District, Purple Air and IQAir. The problem, researchers say, is that these often do not track the larger PM 10 particles, the kind more likely to be kicked up into the air by construction.
“The January wildfires were massive and they highlighted gaps that we in the air pollution science community knew about, but the larger community wasn’t necessarily aware of,” said Rima Habre, an associate professor of environmental health sciences at USC and collaborator on the project. After the fires, people were looking at air quality readings from the existing network, and couldn’t tell how much of the dirty air was due to the larger particles.
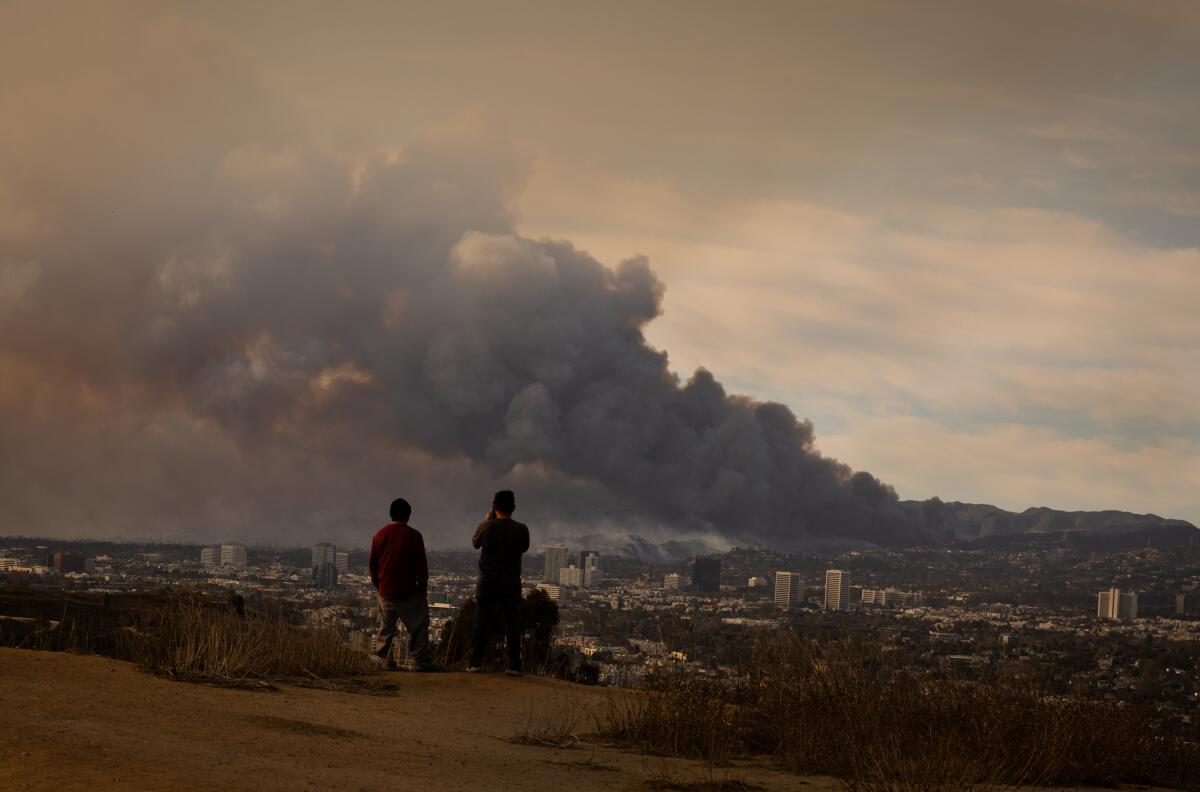
Wildfire smoke from the Palisades and Eaton fires Jan. 8, 2025, blankets Los Angeles County, prompting school closures and triggering air quality advisories across the region.
(Allen J. Schaben / Los Angeles Times)
The new network, known as CAP AIR, was designed to provide hyperlocal and real-time data. The dashboard is color coded from green for good air to dark red for hazardous air to help residents quickly interpret the risk.
“You can see PM 10 levels spike if trucks are hauling debris nearby, and wait until they drop again to go out and jog along the road,” Habre said.
Bill Magavern, policy director of the Coalition for Clean Air, pointed out that California has the worst air in the country. “It’s important for people to know how much particle pollution they’re being exposed to. So we strongly support expanded monitoring and making the information available as widely as possible so people can make informed decisions about when and if they spend a long time outside, when they’re doing strenuous activities like exercising, when they might want to not have their children be outside playing.”
Residents can also sign up for email updates when sensors near their home show particle levels surge.
“Sometimes people are anxious or scared about what’s going on — it’s just because of a lack of information,” Zhu said. “Now, this network can provide that information.”