Some 80,000 students in 96 public schools across San Diego County go to class in areas deemed a high or very high fire hazard – the second highest amount in the state.
The fresh data analysis by partner newsroom EdSource follows the release of updated Fire Hazard Severity Zone maps by Cal Fire earlier this year. Those showed an increase in hazardous land within almost every city’s boundaries in San Diego County between 2014 and 2025.
For perspective: That’s only 5,600 students and 31 schools less than in Los Angeles, which leads California counties having the most students and schools in these high hazard zones. And that’s despite L.A. having 6.7 million more residents than San Diego County.
Not just the backcountry: 15 schools are in North County coastal areas. Another 12 are in the South Bay, and dozens more are scattered across the city of San Diego.
Wildfire preparedness optional: The California Department of Education doesn’t require schools to include a wildfire response in their safety plan, an addition some counties such as San Diego have strongly encouraged, Tracy Schmidt, the senior director of attendance, safety and student engagement for the county’s Office of Education, told EdSource.
Zooming out: The Palisades and Eaton fires in L.A. County damaged or destroyed a combined nine schools in January. Before that, the 2018 Camp Fire in Northern California scorched 13.
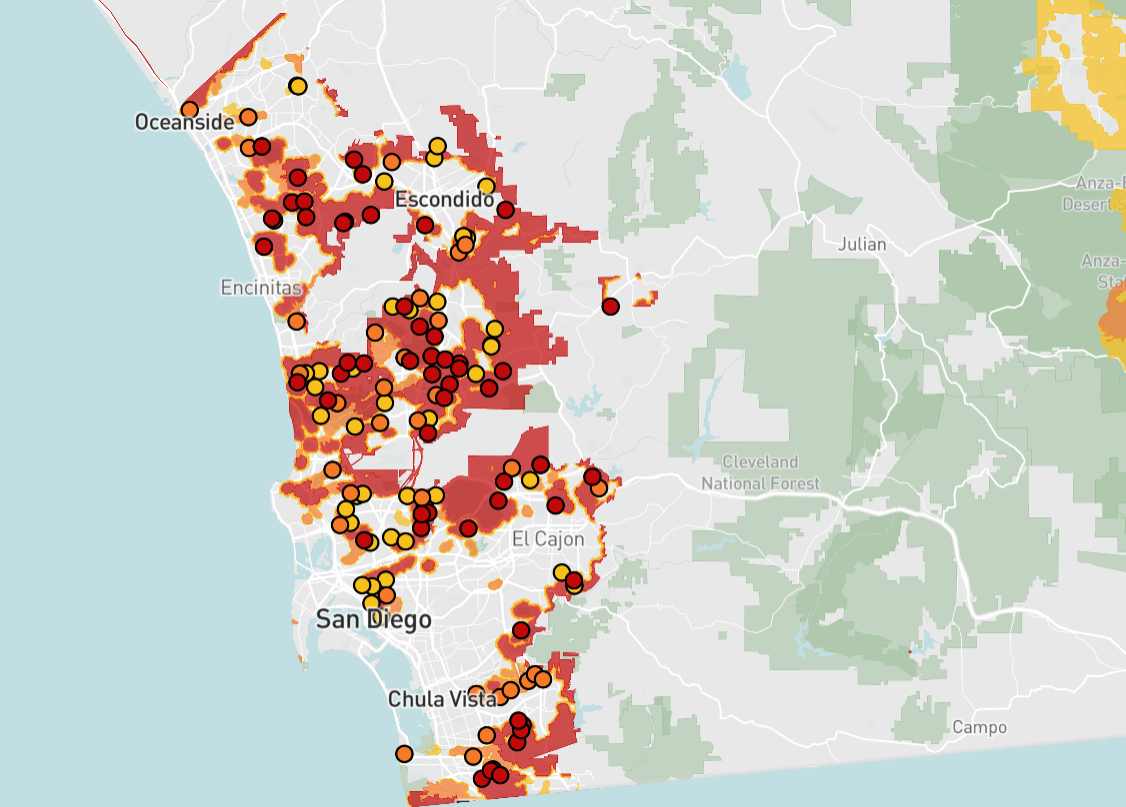
Map: San Diego public schools located in or near fire hazard severity zones
The Office of the State Fire Marshal (OSFM) classifies Fire Hazard Severity Zones as Moderate, High, or Very High, based on factors like fuel load, slope, fire weather and wind patterns that increase wildfire spread.
Use the map to check whether your local schools are in these zones, and filter by Moderate, High, or Very High to explore further.
Understanding hazard vs. risk
Fire Hazard Severity Zone maps evaluate “hazard,” not “risk,” Cal Fire says. Here’s the agency’s definition of both:
“‘Hazard’ is based on the physical conditions that create a likelihood and expected fire behavior over a 30 to 50-year period without considering mitigation measures such as home hardening, recent wildfire, or fuel reduction efforts. ‘Risk’ is the potential damage a fire can do to the area under existing conditions, accounting for any modifications such as fuel reduction projects, defensible space, and ignition resistant building construction.”
In other words, the maps are much more about assessing future fire likelihood than projecting imminent risk.
Data source: Cal Fire, the Office of the State Fire Marshal (OSFM) and EdSource data analysis
Type of Content
News: Based on facts, either observed and verified directly by the reporter, or reported and verified from knowledgeable sources.
![]()
Giovanni joined us October 2022 and manages the overall user experience across our suite of news products and integrations. His love for UX came from a background of innovation in journalism, including 360 video production and social media. Giovanni is a native San Diegan, proud University of Southern…
More by Giovanni Moujaes