Amazing turn of events: From desperate “housing shortage” to massive inventory pile-up in four years.
By Wolf Richter for WOLF STREET.
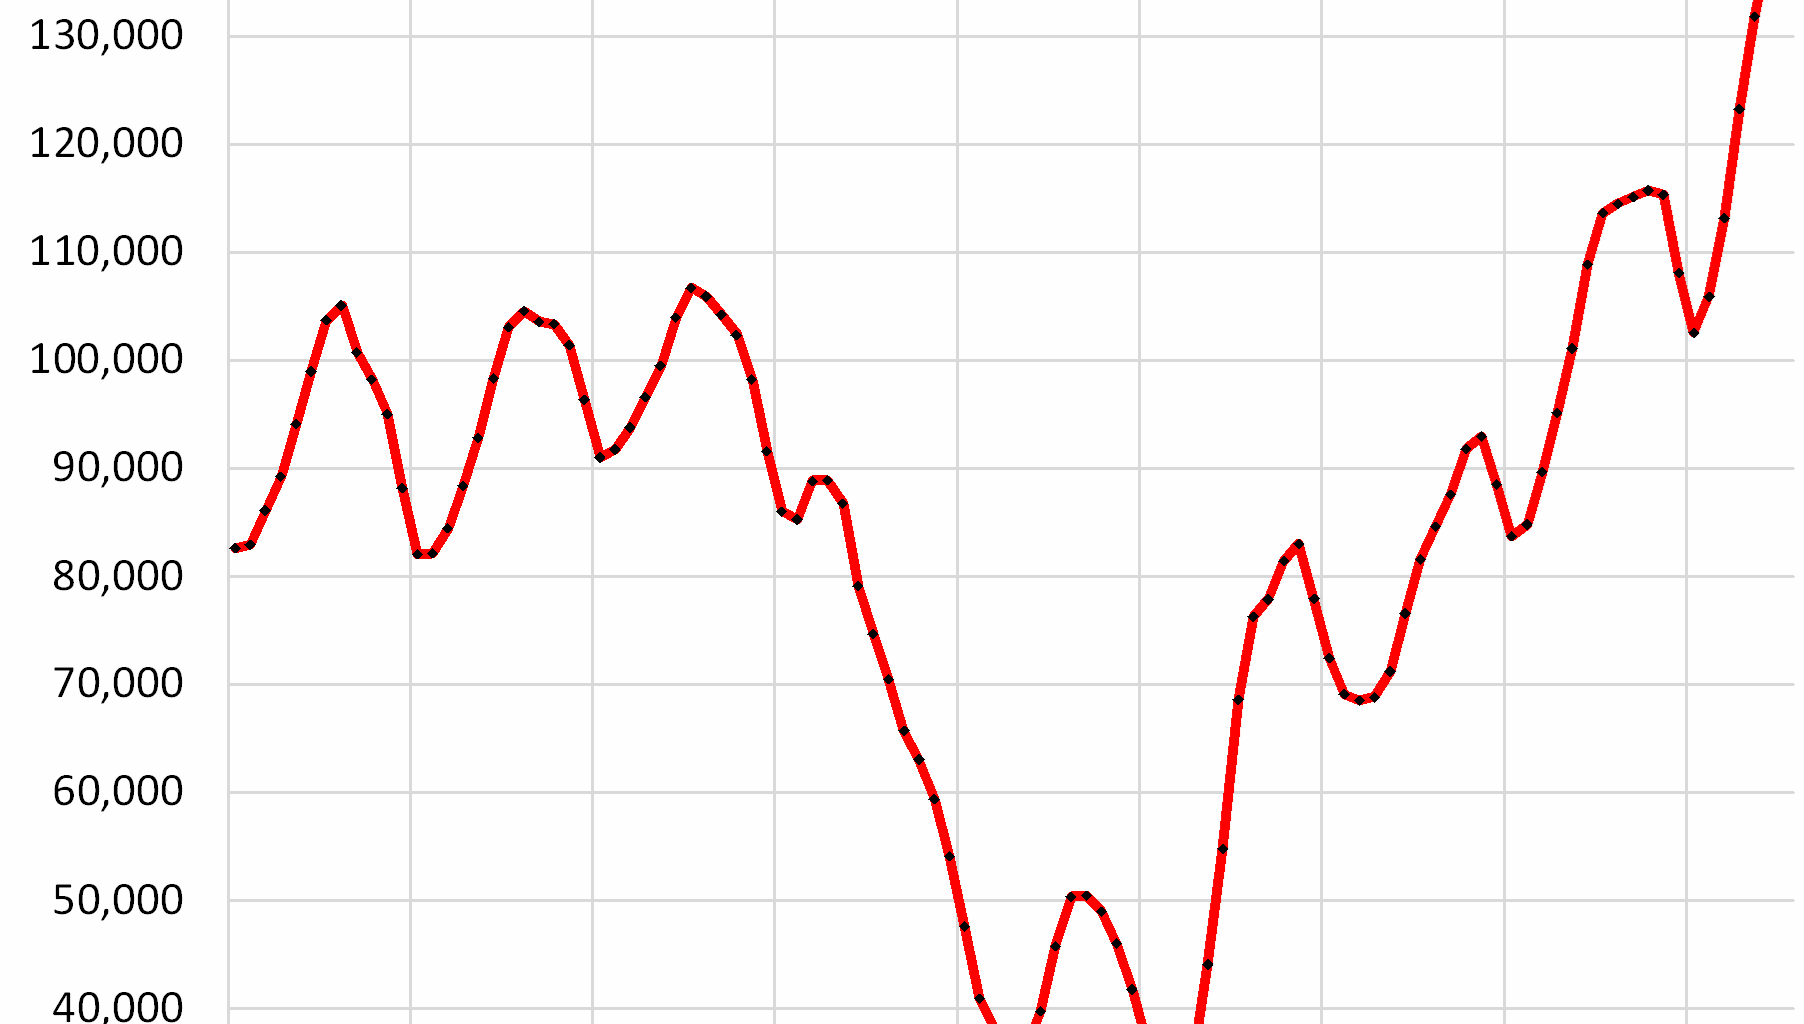
Inventory of existing homes for sale in Texas jumped by 24% in July year-over-year, by 73% from July 2023, and by 208% from July 2021 – the period of inventory depletion – to 140,980 homes, the highest in at least the decade of data from Realtor.com. Compared to the Julys in 2017-2019, active listings were up by 32-37%.
What a turn of events after the housing frenzy in 2020 through the first half of 2022, when inventory plunged to very low levels! At the time, enough buyers with access to cheap mortgages, and seeing the price-explosion underway, bought a new home and moved into it without putting their old home on the market. The goal was to ride up the price-explosion all the way up. The result was that inventory collapsed.
Now the buyers are gone because prices are too high, while some of those homes came out of the woodwork, inventory piled up and sits.
The median number of days that a home sits on the market before it gets pulled off the market or is sold jumped to 60 days in Texas, the highest for any July in the decade of data. The runner-up was July 2024 with 55 days.
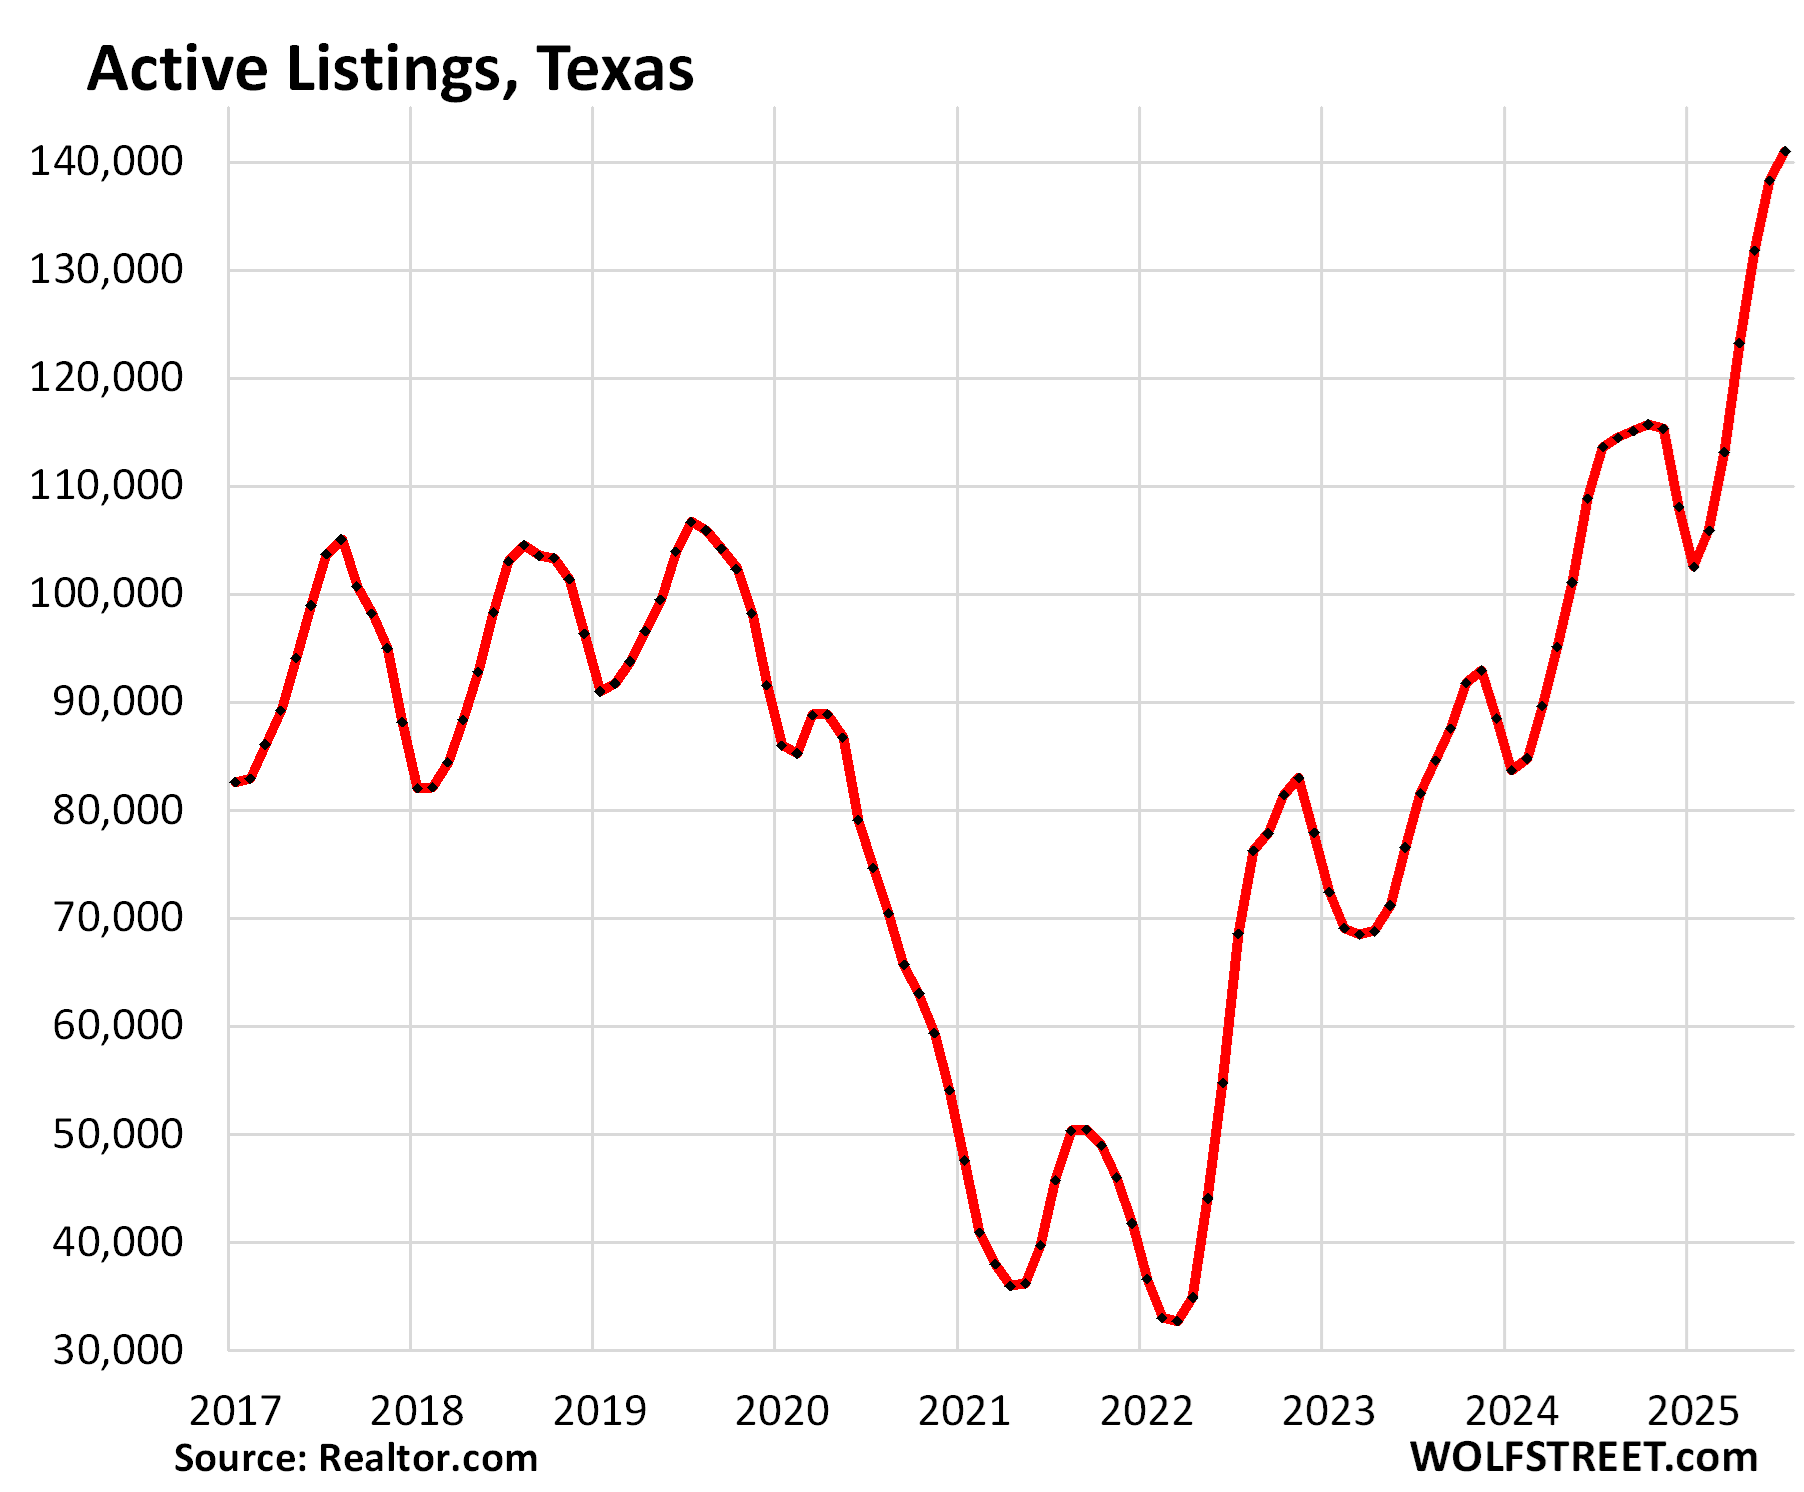
In the Dallas-Fort Worth-Arlington metro, active listings spiked by 58% year-over-year, by 142% from July 2023, and by 430% from July 2021 – the period of depletion – to 31,819 homes, the highest in at least the decade of the data by Realtor.com.
Compared to 2017, active listings are up by 104%, compared to 2018 by 75%, and compared to 2019 by 43%! Summers are the seasonal high points in terms of inventory.
During the final paroxysm of the buying frenzy in early 2022 – it began dying in mid-2022 – active listings dropped below 5,000, which was essentially near-zero for a huge housing market like the Dallas-Fort Worth metropolitan area.
The median number of days that a home spent on the market before it sold or was pulled off the market jumped to 53 days, the highest for any July in the decade of data.
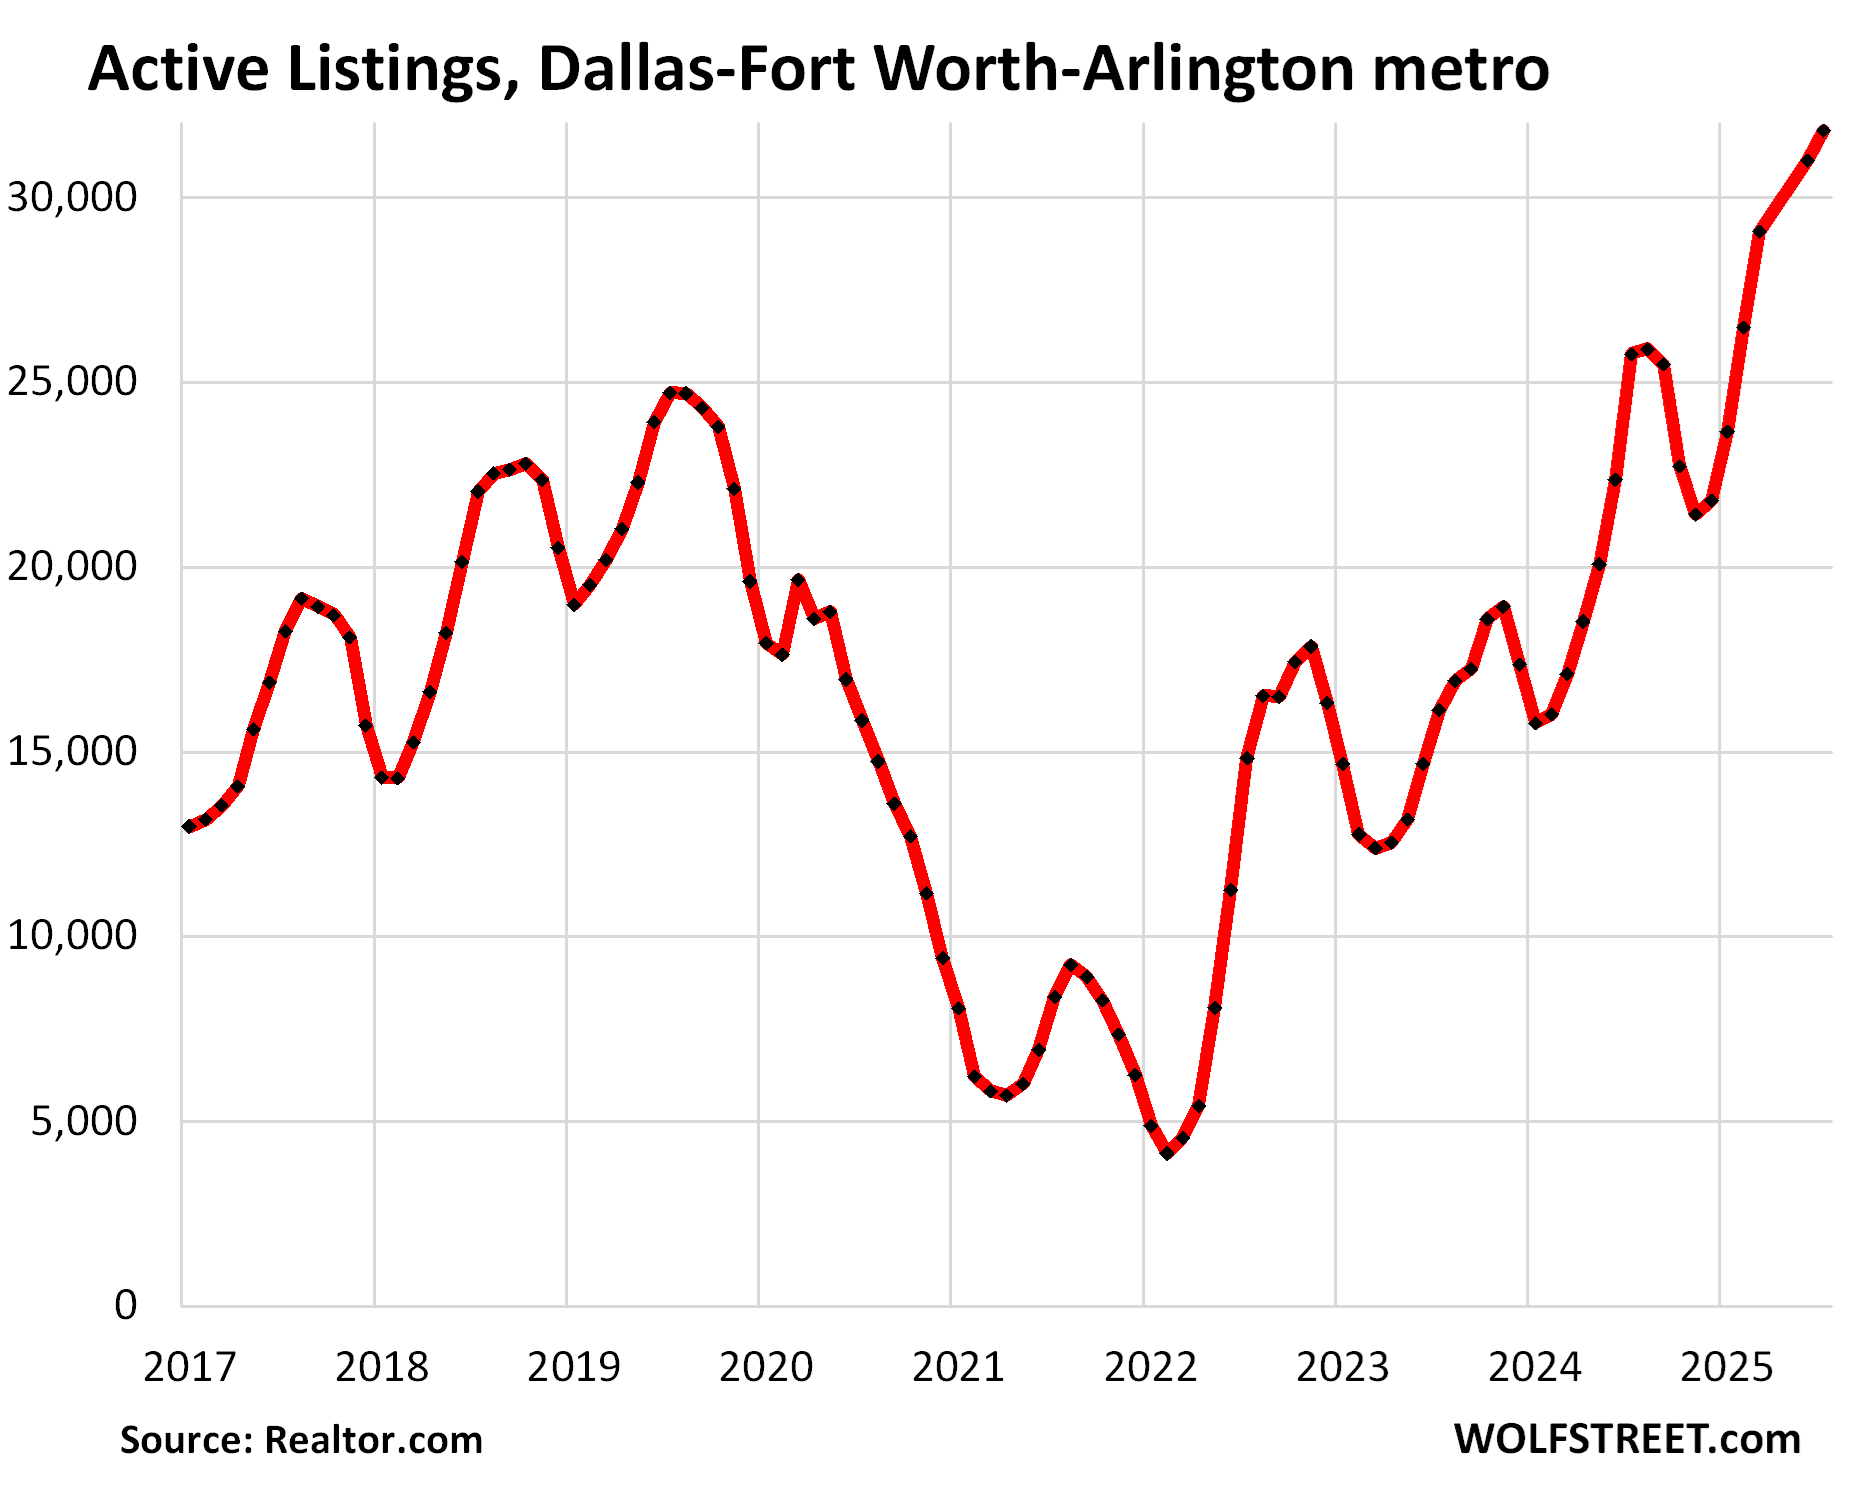
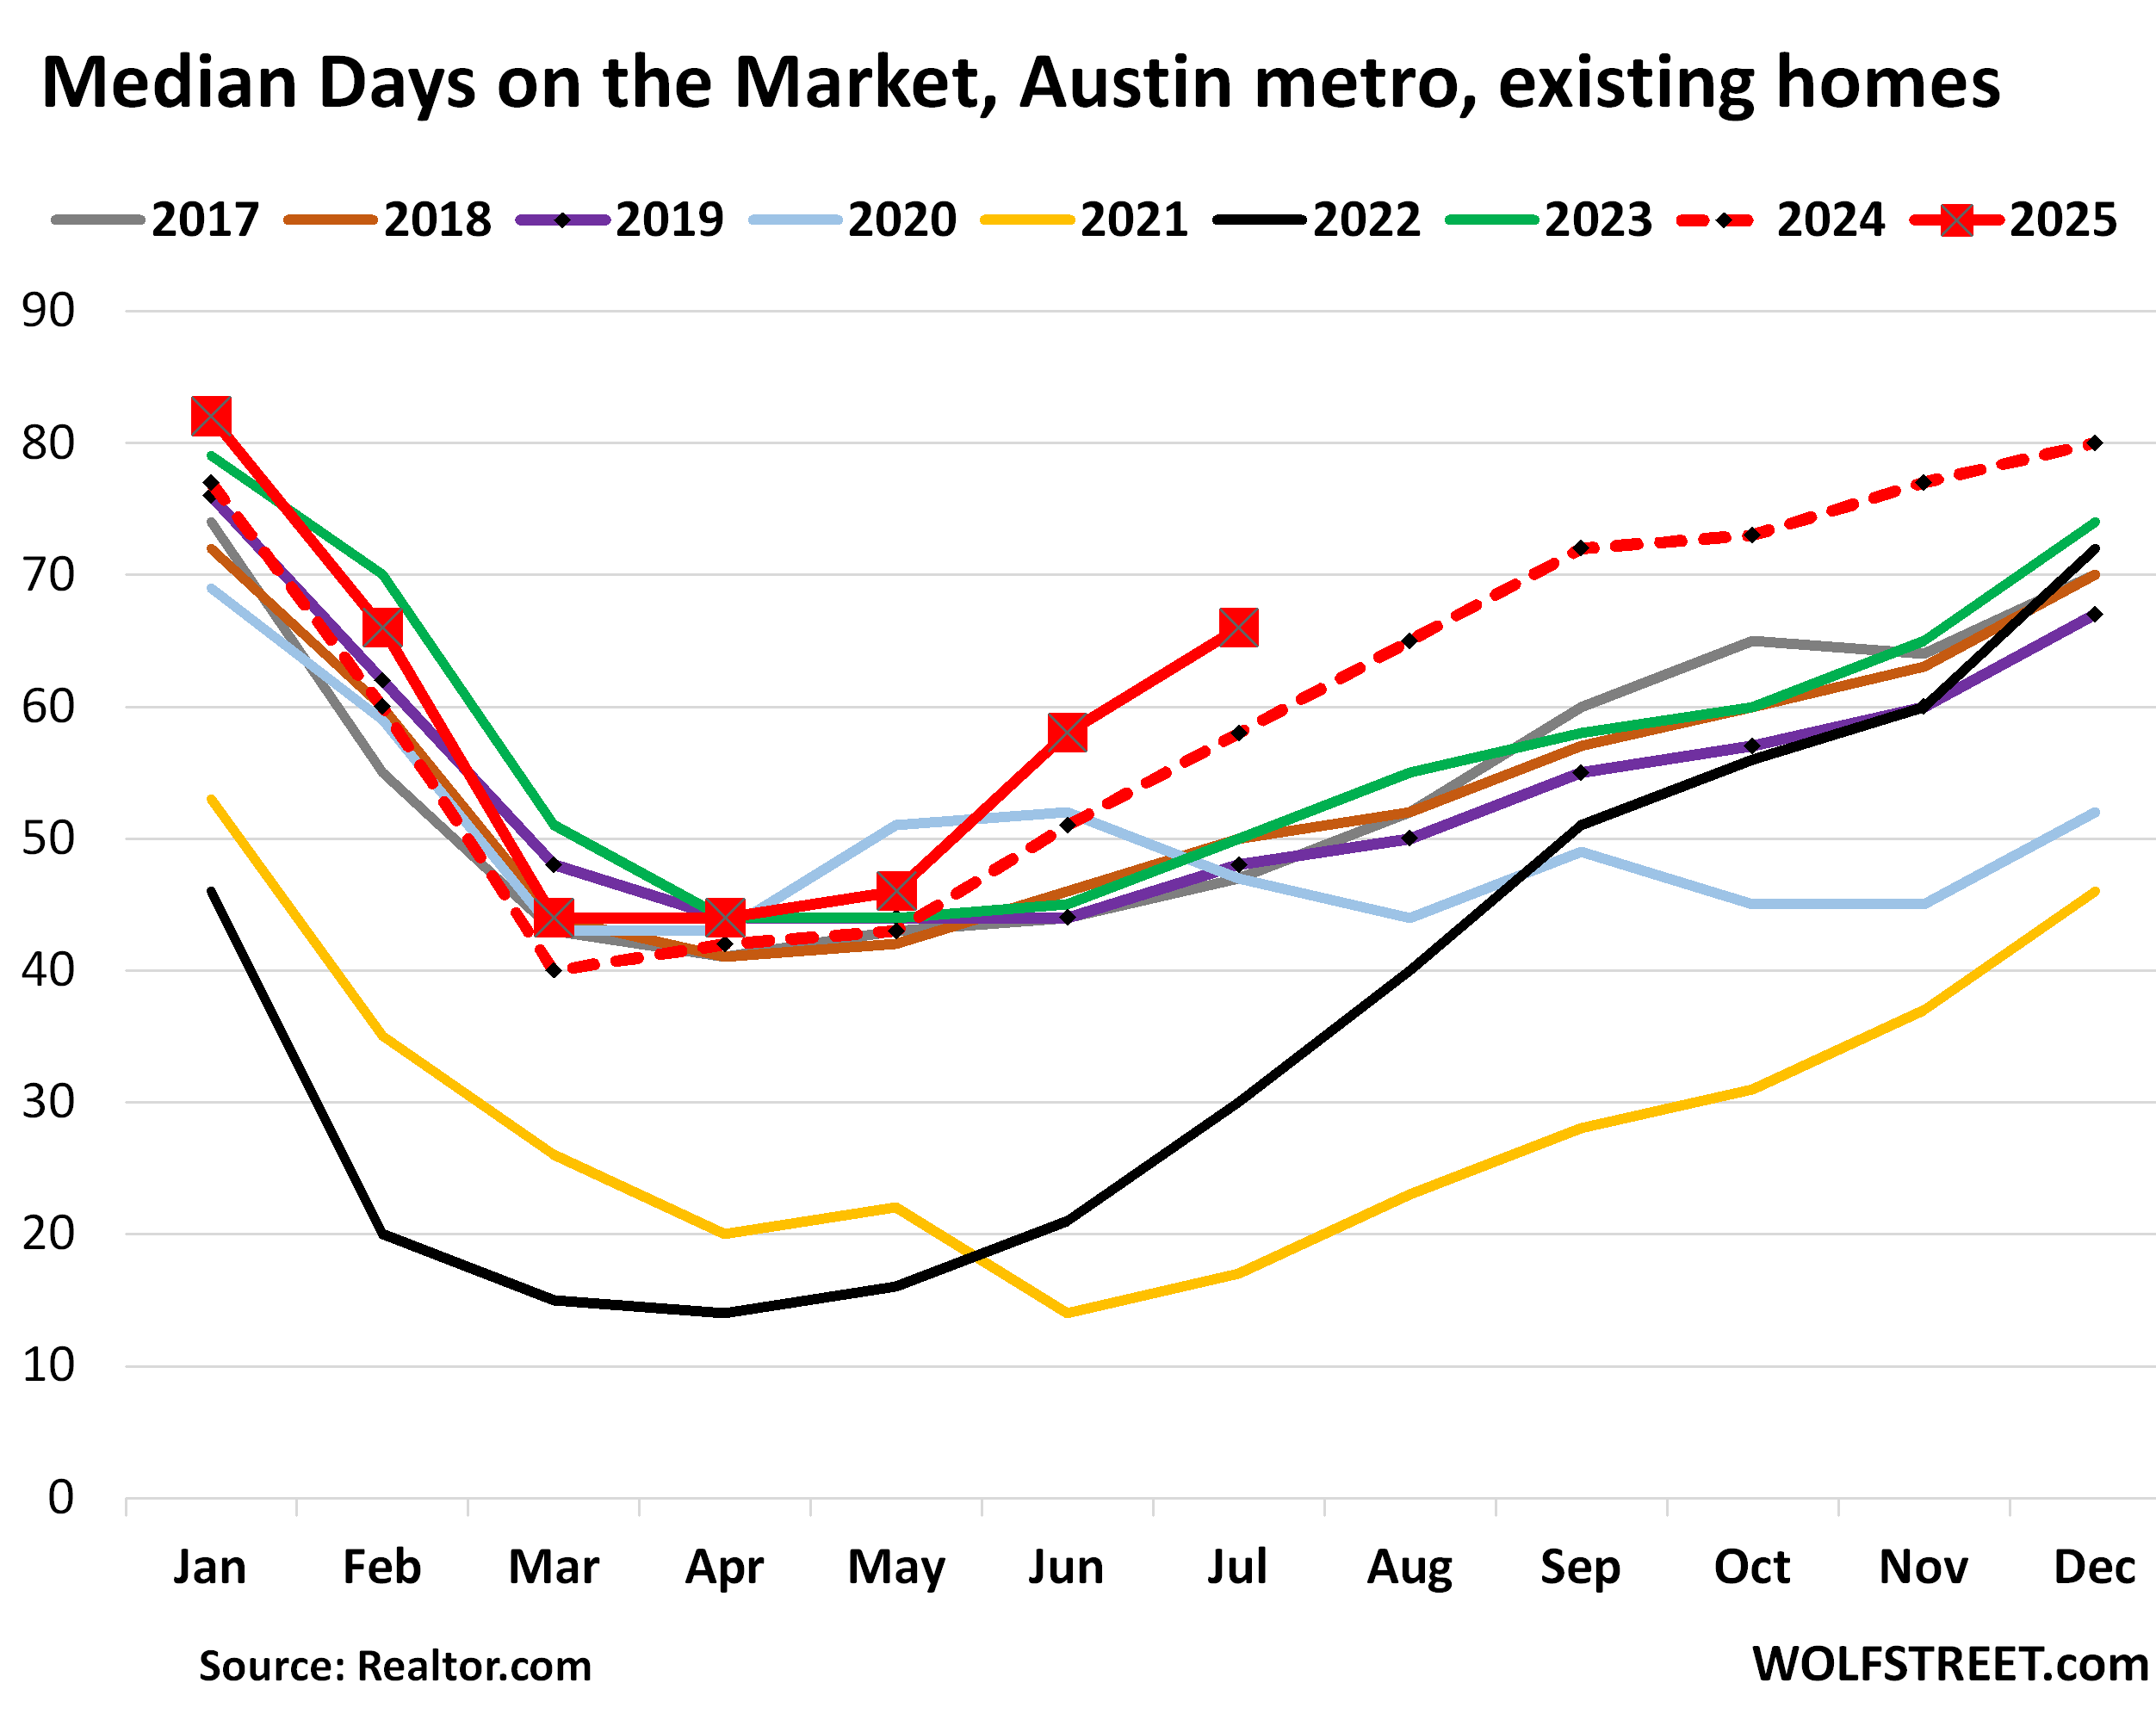
In the Austin-Round Rock-San Marcos metro, active listings jumped by 18% from July last year, when inventories had already carved out a record in the decade of data from Realtor.com; and by 327% from July 2021 when the buying frenzy had depleted inventories; and by 64% from July 2019; to 13,123 homes, the highest in the decade of data by Realtor.com.
The median number of days a home spent on the market before it sold or was pulled off the market jumped to 66 days, the highest for any July in the decade of data.
Home prices are skidding lower across Texas, but the Austin metro is ahead again of the other big metros in Texas. From mid-2019 through mid-2022, over those three years, prices had exploded by 78%. Since then, transaction prices in the Austin metro have dropped already by over 23% from the peak, having given up now roughly half of the 78% three-year price explosion.
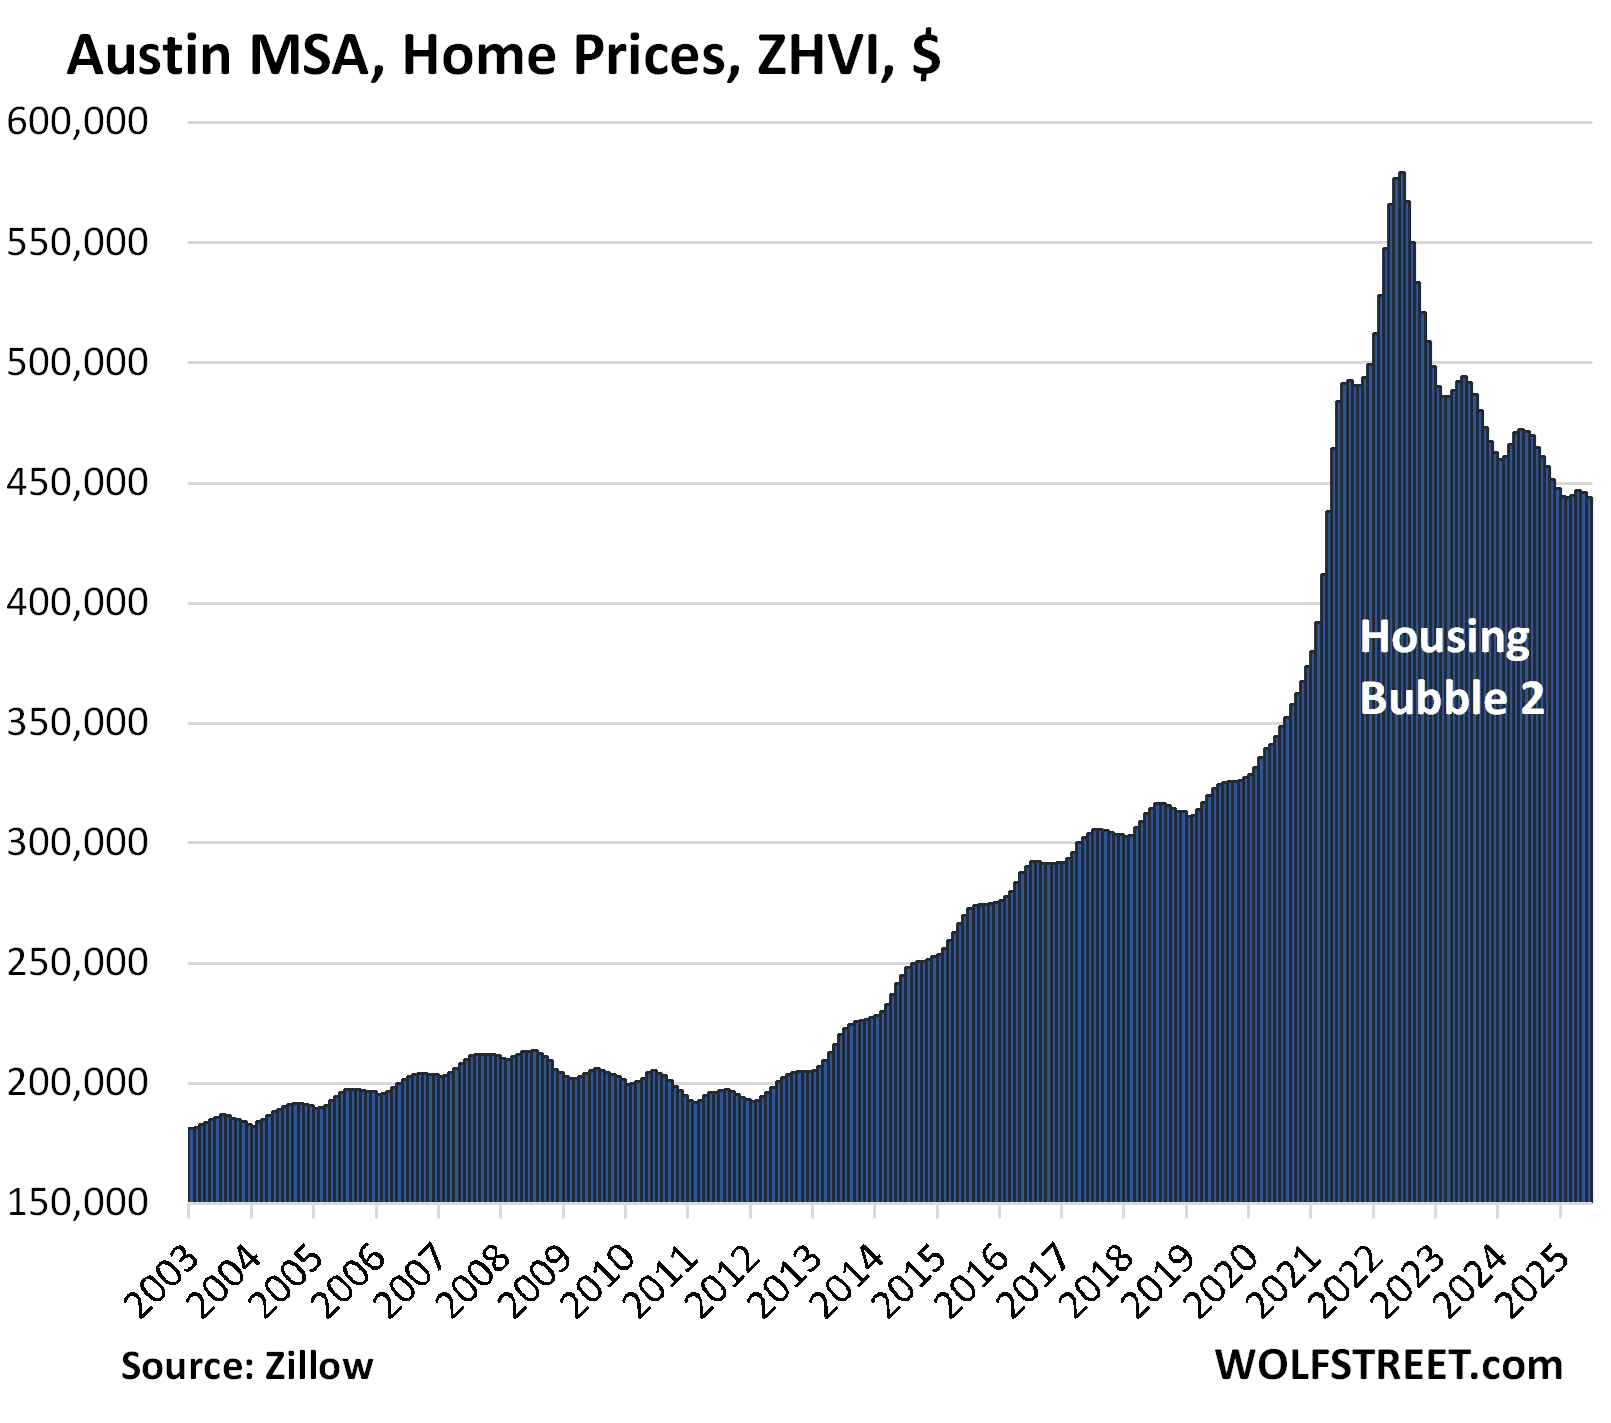
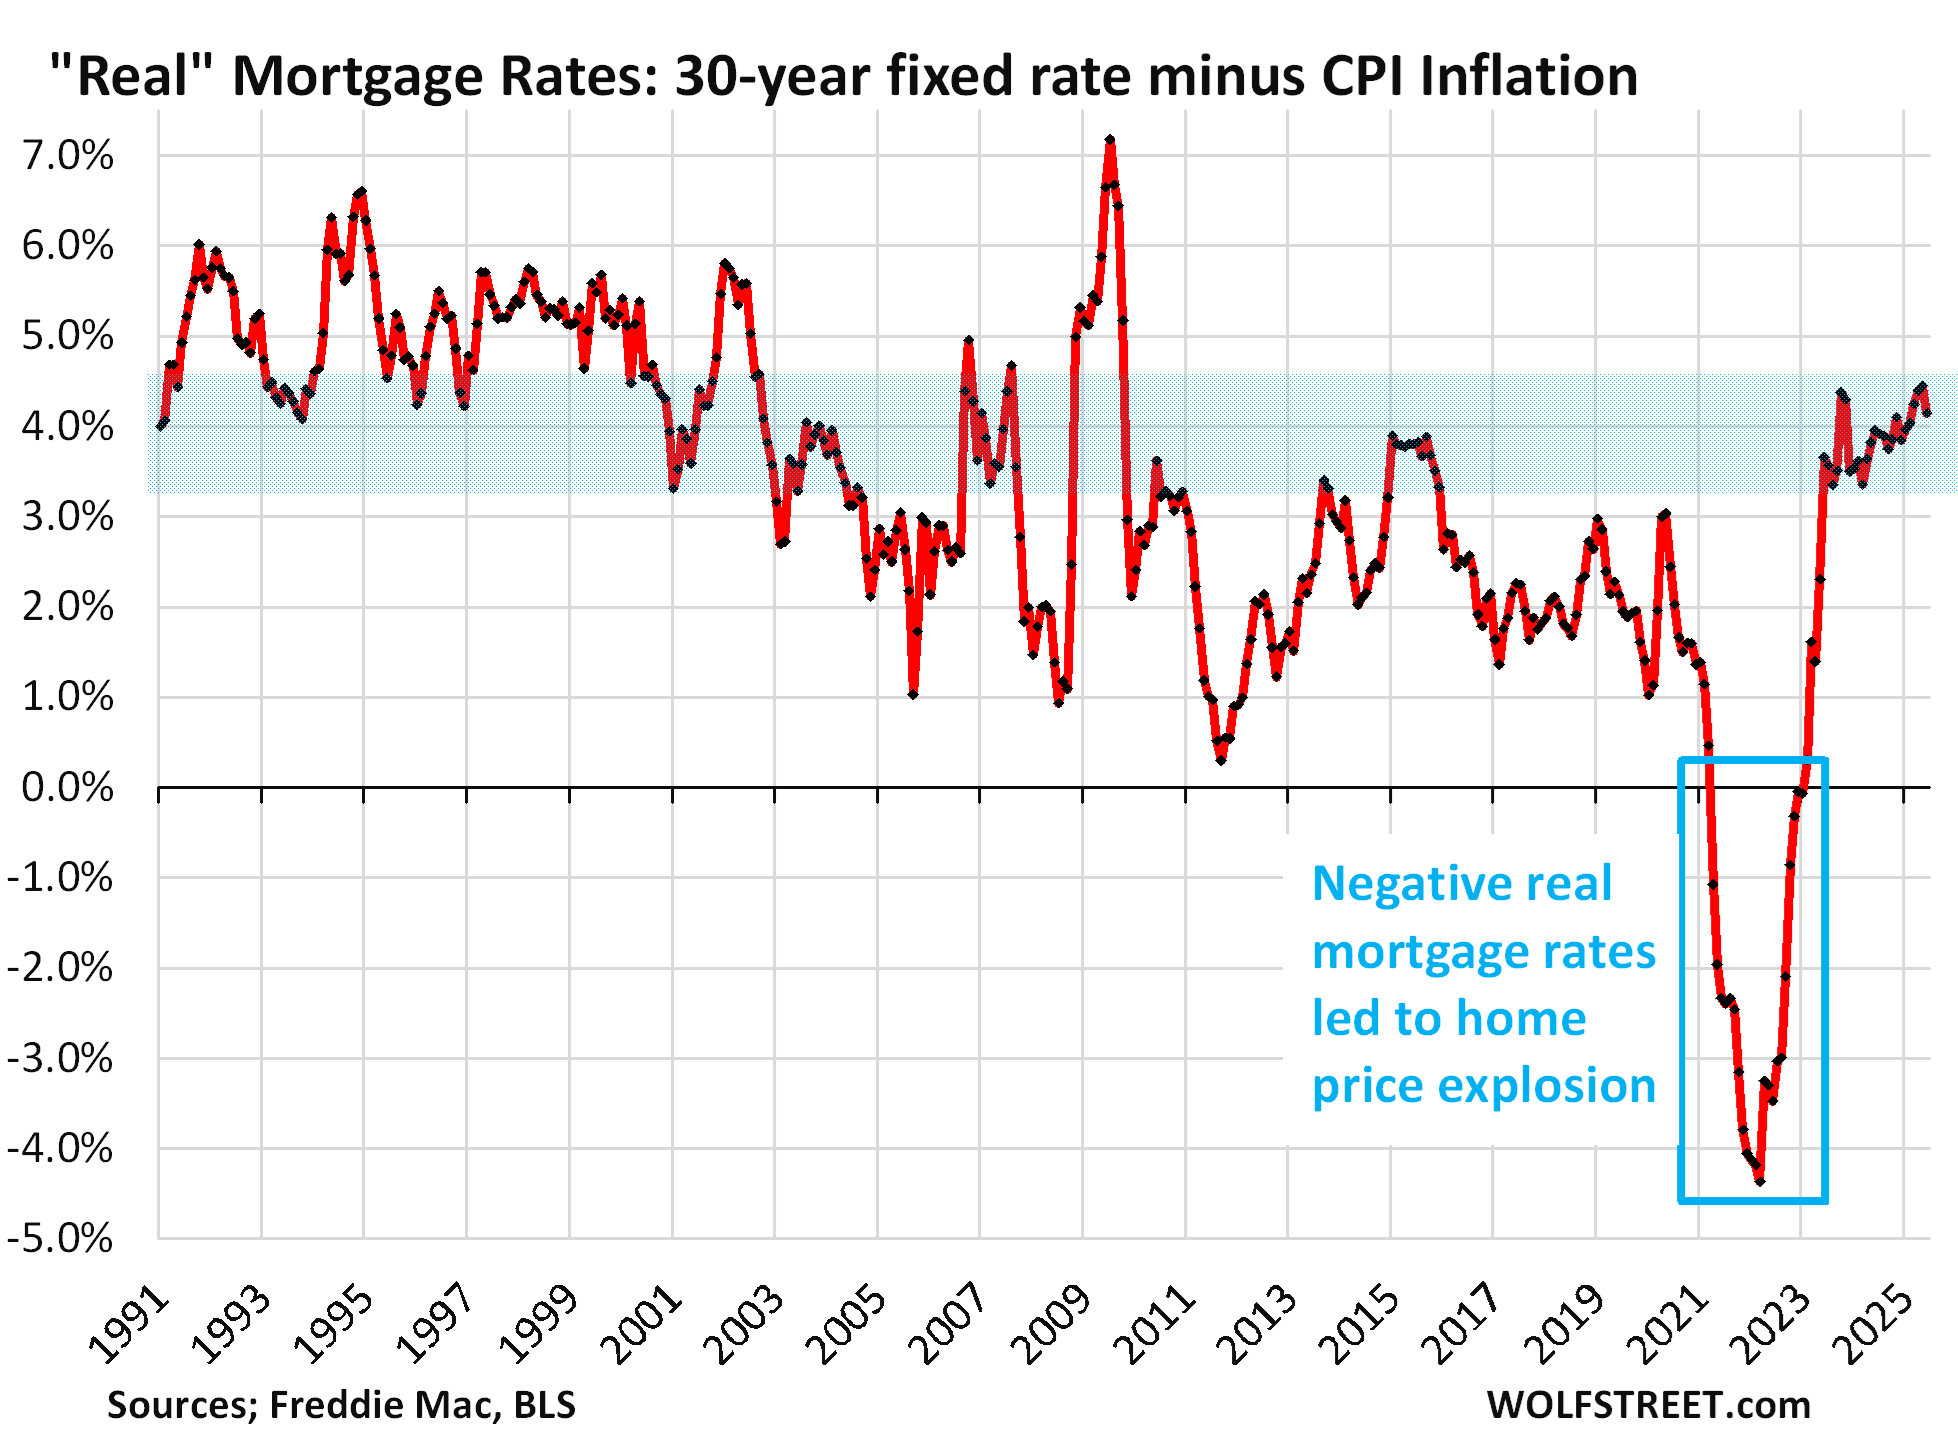
Housing price explosions like these – in Austin, 78% in three years – are indictments of the Fed’s monetary policies whose interest-rate repression via near-0% short-term rates and trillions of dollars of QE to push down long-term rates, flooded the land with liquidity and pushed down mortgage rates far below the rate of inflation (blue box in the chart below).
These negative “real” mortgage rates – mortgage rates minus CPI inflation – were as close to free money as it gets, and when money is free, prices no longer matter, and people pay whatever, and prices explode. And now there’s the hangover from those policies.
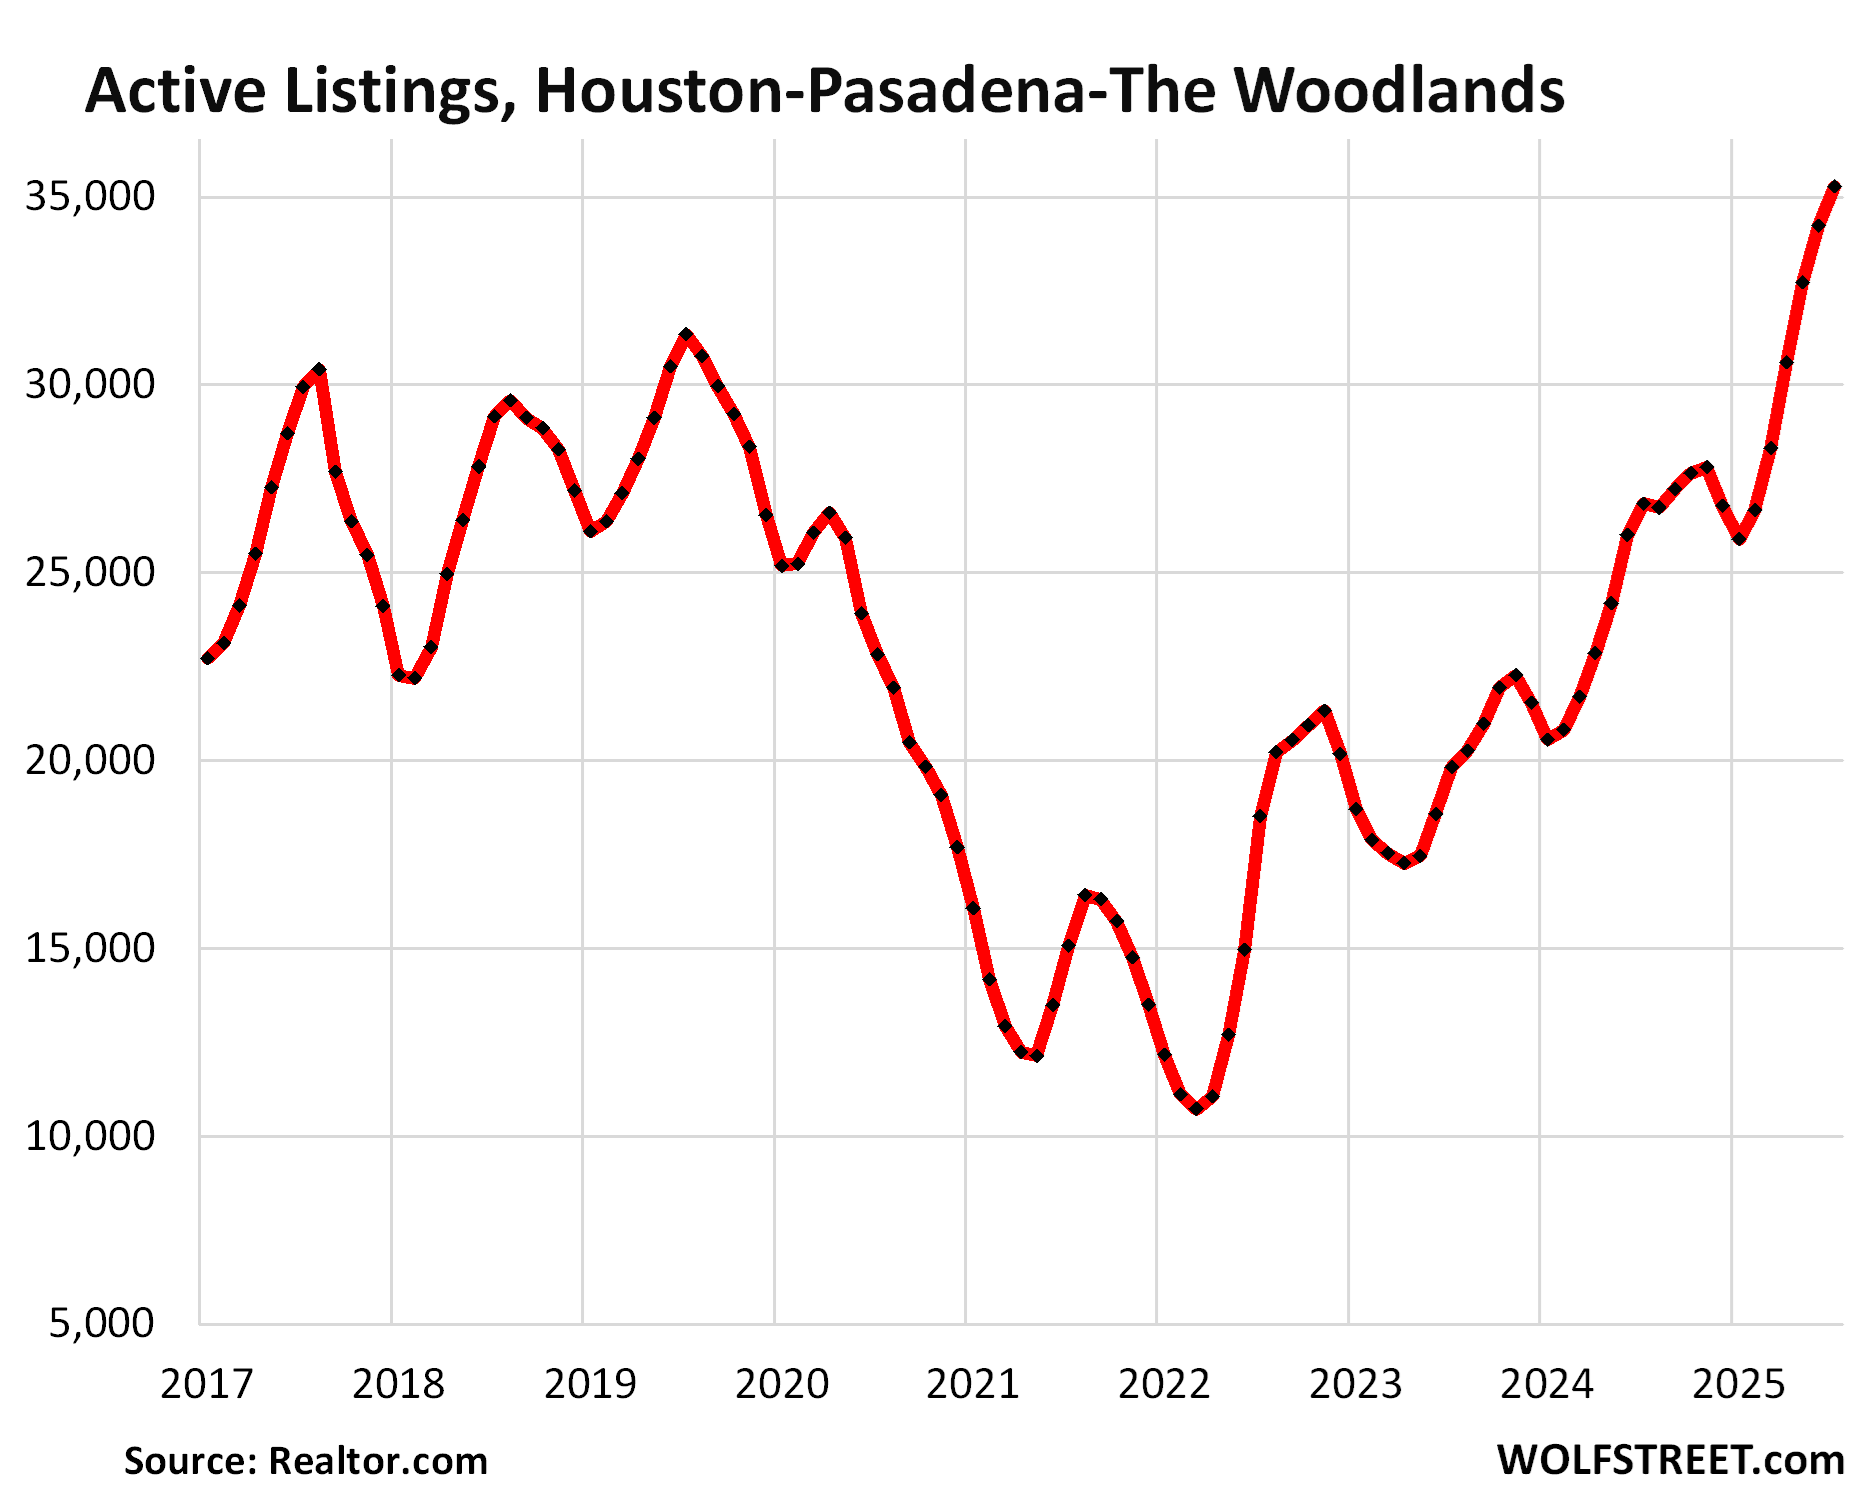
In the Houston-Pasadena-The Woodlands metro, active listings jumped by 31% year-over-year, and by 78% from July 2023, to 35,273 homes, the highest in the decade of data from Realtor.com.
The median number of days on the market before the home got pulled off the market or was sold rose to 50 days, right there with the years 2017-2020 (51 days).
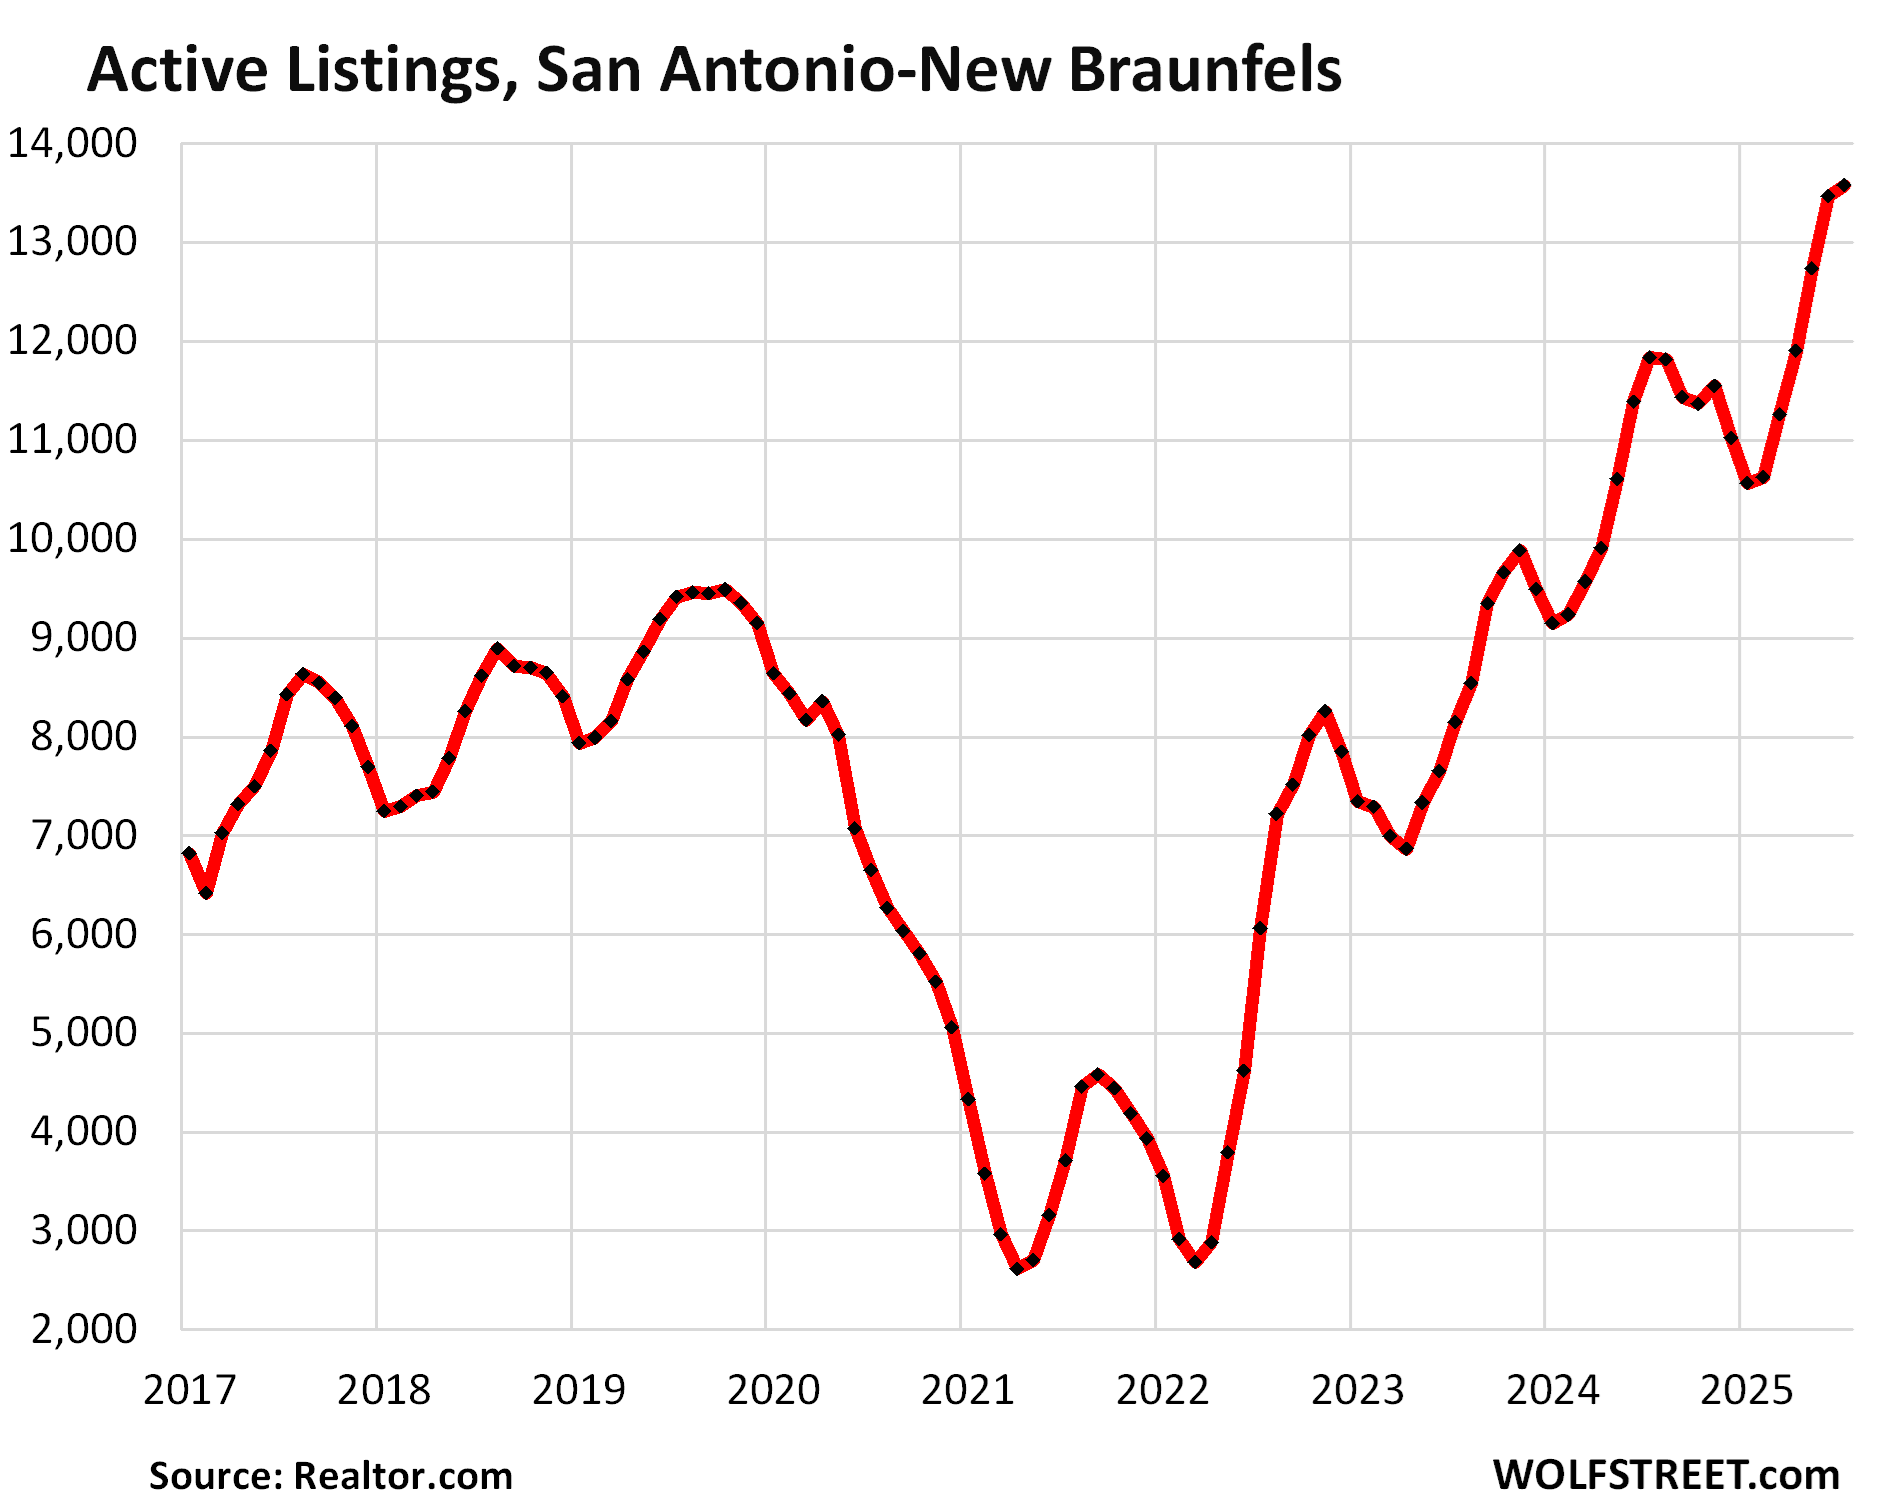
In the San Antonio-New Braunfels metro, active listings jumped by 15% from the already bloated levels a year ago, and by 66% from July 2023, and by 266% from July 2021, to 13,467 homes.
Compared to the Julys of 2017-2019, listings were up by 44% to 61%.
The median number of days on the market jumped to 65 days, the highest for any July in the decade of data. The runner-up was July 2024 at 57 days. In 2017 through 2019, days on the market ranged from 50-53 days.
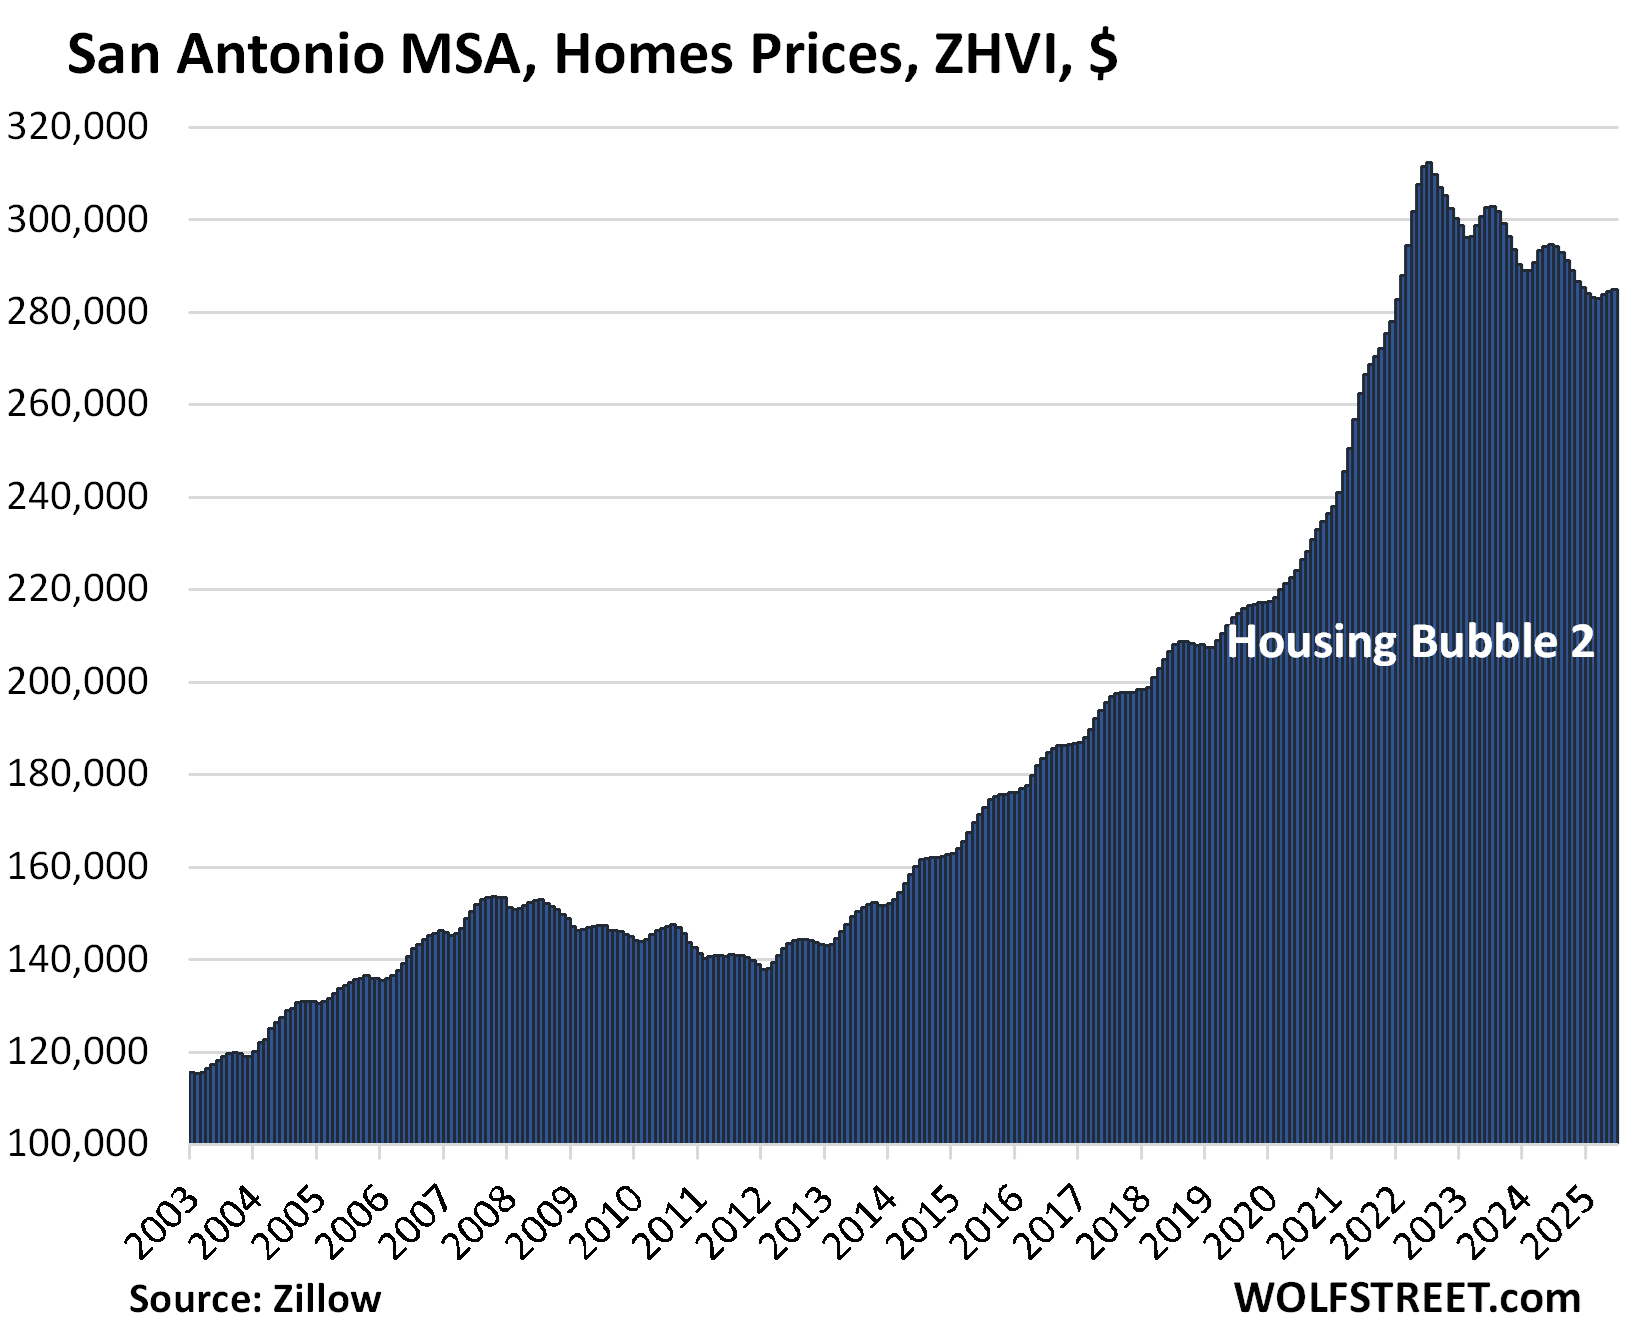
Home prices in the San Antonio metro have declined by 9% from their mid-2022 peak, far behind Austin (-23%), but ahead of Dallas (-7%) and Houston (-3%).
Enjoy reading WOLF STREET and want to support it? You can donate. I appreciate it immensely. Click on the mug to find out how:

![]()
WOLF STREET FEATURE: Daily Market Insights by Chris Vermeulen, Chief Investment Officer, TheTechnicalTraders.com.