Framework for intelligent analysis of greening policy texts based on text mining and AI big models
In this study, we developed an intelligent analysis framework for greening policy texts based on text mining and AI big models, aiming to improve the rationality and practicality of policy analysis. The framework consists of the following seven main components (Fig. 1). 1) Automated timed data collection and preprocessing, which allows automatic collection of greening policy texts from government gazettes and related agencies to ensure real-time data update and consistency for subsequent analysis. 2) Policy keyword extraction, which employs NLP techniques to extract keywords and phrases from the texts to reveal the core content of the policy. 3) Policy topic categorization, which allows automatic identification and classification of the main topics in policy documents with topic modeling techniques to quickly understand the policy focus. 4) Extraction of greening core indicator: which means identification and extraction of key greening planning indicators from the policy documents, such as green space area and greenway construction, and is a key to assessing the effectiveness of policy implementation. 5) Policy AI interpretation, which uses AI big models to deeply interpret the policy text, analyze its main goals, and predict the possible outcomes of policy implementation. 6) Real-time policy tracking, which can collect dynamic data related to greening policies to provide real-time feedback to policy makers. 7) Visualization of the intelligent analysis results, which can display all analysis results through user-friendly interfaces, including charts, timelines, and maps, to facilitate the intuitive understanding of policy makers and researchers on the policy trends and specific objectives. Overall, the framework integrates seven functions to create a multi-level system for analyzing urban greening policies across macro, meso, and micro dimensions, addressing the time-consuming nature and interpretive biases of traditional methods in processing large-scale policy texts. These functions are interconnected through multidimensional analysis logic: (1) automated data collection and preprocessing establish the data foundation; (2) keyword extraction and thematic categorization identify macro trends and meso-level priorities of greening policies; (3) core indicator extraction and AI-driven interpretation assess micro-level indicators and policy outcomes; and (4) visualization integrates multi-level results into intuitive decision-making insights. This multi-layered design ensures comprehensive and systematic analysis while addressing specific policy needs, thereby enhancing the scientific rigor, timeliness, and practicality of policy formulation.
Fig. 1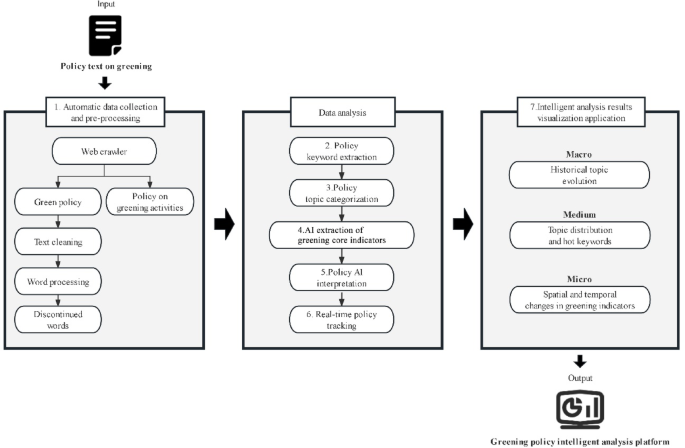
Framework for intelligent analysis of greening policy texts based on AI big models and text mining.
Study area
Wuhan was chosen as the study area for this study due to its unique urban characteristics and environmental challenges. As an important industrial and commercial center in central China, Wuhan is characterized by abundant water resources and vast green spaces, but it is also faced with great environmental pressures due to rapid urbanization37. In recent years, urban heat island effect and air pollution have become increasingly serious38,39. Official data indicate that Wuhan’s average annual temperature increased significantly from 1951 to 2018, with a warming rate of 0.30 °C per decade40,41. The average annual PM2.5 concentration in 2023 was 38 μg/m3, exceeding the national ambient air quality secondary standard by 9% and rising 8.6% from 202242, highlighting the urgent need for effective greening policies. In this context, Wuhan government has implemented several greening and ecological policies43,44,45,46 to increase the green space area, improve the ecological environment, and enhance the sustainable development of the city. These policies make Wuhan an ideal city to study the impact and effectiveness of urban greening policies and provide a good basis for this study. Therefore, this study explores the rationality, design effectiveness, and core content of these policies, to facilitate future informed urban greening policymaking.
Automatic data collection and pre-processing
In the automatic data collection and data pre-processing stage, this study focuses on systematic collection and organization of urban greening policy texts in Wuhan. The data were mainly obtained from two official platforms: Wuhan Municipal People’s Government Portal (https://www.wuhan.gov.cn/) and the official website of the Wuhan Municipal Bureau of Landscape and Forestry (https://ylj.wuhan.gov.cn/). By searching these websites using the keywords “greening program”, “greening”, and “parks”, the relevant policy documents can be precisely located. The specific steps are as follows.
-
(1)
Automated data collection. This study develops automated crawler scripts via Python, which can automatically crawl the corresponding text data in the specified websites. The captured text data include 12 greening policy texts (2009–2024) for thematic analysis, and 10 additional greening-related activity records from the past six months for real-time information delivery (Table 1). The acquired textual data were subsequently stored into a MySQL database with records including document source, year, and textual content to ensure that the data are organized and searchable.
Table 1 Policy documents related to greening in Wuhan.
-
(2)
Data pre-processing. The following steps are taken to process the data in order to improve the accuracy of the analysis.
-
Text cleaning Python’s standard and RE libraries are used to remove HTML tags, spaces, special characters, and numbers, as these are irrelevant in most text analysis.
-
Segmentation processing Text segmentation can split continuous text into individually manageable lexical units. Chinese text segmentation is particularly critical because Chinese writing is not separated by distinct spaces like English. This study utilizes a specialized Chinese word-splitting tool, Jieba, to ensure efficient and accurate recognition of Chinese words33,47.
-
Removal of stop words The common stop words that do not contribute to the analysis are removed, such as “and” and “is”, and the list of stop words in the field of greening are customized to exclude specialized but unrecognizable words, such as “hectare” and “area”.
-
These preprocessing steps are aimed to optimize the dataset and provide clean and accurate input data for subsequent topic modeling and keyword extraction.
Policy keyword extraction
TF-IDF (Term Frequency-Inverse Document Frequency) is a common weighting technique used in information retrieval and text mining to assess the importance of a word to a set of documents or one document in a corpus48. In this study, the TF-IDF model was used to extract keywords from policy texts. The algorithm involves two concepts: term frequency (TF) and inverse document frequency (IDF).
TF represents the occurrence frequency of a word in a document and is normalized to the number of words. For the word \(t\) in document \(d\), its TF is calculated as follows49:
$$\begin{array}{*{20}c} {TF_{ij} = \frac{{{\text{n}}_{ij} }}{{\mathop \sum \nolimits_{{\text{k}}} {\text{n}}_{kj} }}} \\ \end{array}$$
(1)
where \({\text{n}}_{ij}\) is the number of occurrences of the word \(t\) in document \(d\), and the denominator is the sum of occurrences of all words in document \(d\).
IDF measures the general importance of a word in a document collection. To calculate the IDF value of a particular word, the total number of documents in the document collection is first divided by the number of documents containing the word, and then the natural logarithm is taken to obtain the IDF value for the word:
$$\begin{array}{*{20}c} {IDF_{i} = \log \frac{\left| D \right|}{{\left| {\left\{ {j:t_{i} \in d_{j} } \right\}} \right|}}} \\ \end{array}$$
(2)
where \(\left| D \right|\) represents the total number of texts in the document collection and \(\left| {\left\{ {j:t_{i} \in d_{j} } \right\}} \right|\) denotes the number of documents containing the particular word \(t\). In order to prevent the denominator from becoming zero if \(t\) does not appear in any document, the denominator is usually added by one to ensure the stability of computation and avoid the error of dividing by zero.
Finally, TF-IDF can be obtained by multiplying the two:
$$\begin{array}{*{20}c} {TF – IDF_{ij} = TF_{ij} \times IDF_{i} } \\ \end{array}$$
(3)
The TF-IDF score can indicate the importance of the word in the document, with a higher value indicating higher uniqueness of the word in the document.
The TF-IDF model was chosen because it can effectively distinguish between high-frequency words and key words in a document, and is particularly powerful in analyzing policy texts containing specialized terminology, which can accurately identify highly indicative words. This model improves the accuracy and depth of text analysis by attenuating the influence of common words and emphasizing key thematic vocabulary50. Specifically, this study calculates the TF-IDF value of each word in a policy document and selects the top 30 words with the highest TF-IDF value as the keywords of the document, which are used to reveal the policy content and tendency in depth. This method not only improves the accuracy of keyword extraction, but also enhances the systematicity of policy text analysis.
Policy topic classification
Latent Dirichlet Allocation (LDA) is a statistical model that contains a three-layer structure of words, topics, and documents, and is designed to identify implicit topics in large-scale document sets. In this study, we used LDA as a core tool for policy topic classification. The model assumes that each document is generated by a set of implicit topics, with each being defined by a probability distribution of words51. It can reveal the statistical patterns of texts, and deeply parse the structure and topic content of policy texts26. The LDA model can be applied to a wide range of policy documents. Although the framework supports dynamic analysis, we selected traditional LDA with topic similarity analysis (Step 4) over Dynamic Topic Modeling (DTM) to track policy topic evolution, as LDA is more computationally efficient and balances complexity and dynamism effectively52,53. Additionally, LDA reduces computational costs with limited data, minimizing the overfitting risk associated with DTM51.
Topic modeling with LDA has significant advantages over traditional text analysis methods such as frequency statistics or manual classification. First, it can automatically extract topics through probability distribution, which significantly reduces human error and subjectivity. Second, the model can handle unstructured text and reveal deep semantic connections by simulating the text generation process. In addition, LDA supports categorization of multi-theme documents, which can accurately reflect the complexity of documents and provide a dynamic and precise analytical perspective for complex policy texts26.
The operation process of the LDA model can be divided into the following steps. First, the text is preprocessed (such as word splitting and deactivation removal) to construct a document-vocabulary matrix. Next, topics are randomly assigned to each document, and based on these initial topic assignments, iterative computations are performed to adjust the probability distribution of each word across topics and the distribution of each topic across documents. This iterative process relies on two key Dirichlet distributions: for each topic \(k\), the distribution \(P\left( {w\left| k \right.} \right)\) of the word \(w\) is governed by the prior distribution \(Dir\left( \beta \right)\), while document \(d\) in the subject distribution \(P\left( {k\left| d \right.} \right)\) is controlled by the prior distribution \(Dir\left( \alpha \right)\), where \(\alpha\) and \(\beta\) are model hyperparameters that affect the dispersion degree of topics in a document and that of words in a certain topic, respectively54.
By iteration until model convergence, the LDA model can output the topic distribution of each document and the lexical distribution of each topic. The results not only reveal the underlying topic structure in the document set, but also improve understanding of the implicit semantic hierarchy in the text. By analyzing these probability distributions, we can characterize each topic in detail, and thus further explore the key messages and trends of the policy texts. The specific steps are as follows.
-
(1)
Data categorization: according to the needs of the study, the greening policy texts are categorized into two classes for different analysis purposes. The first category of data is used for topic evolution analysis, and segmentation of the policy text data was primarily based on the number distribution of texts. Specifically, the data are segmented into four phases: 2009–2012, 2013–2015, 2016–2021, and 2022–2024, with each phase including three years of policy texts. This arrangement not only ensures data consistency and sufficient sample size within each phase, but also allows the comparison of changes and development trends of the policies between different phases. The second category of data is used to reveal the distribution of annual topics in recent years, including separate analyses of the data for 2022, 2023, and 2024 to explore in detail the policy priorities and changes in each year.
-
(2)
Determination of the optimal number of topics \(k\): To determine the optimal number of topics \(k\), it is necessary to calculate the consistency score and perplexity of the topic model, both of which are effective in evaluating the performance of the model. Perplexity measures the model’s ability to predict the new text, reflecting the model’s generalization ability, while consistency score assesses the differentiation between the topics generated by the model, i.e., whether the vocabularies of different topics are highly unique and relevant. A lower perplexity typically indicates that the model has better predictive accuracy and internal consistency, whereas a high consistency score represents that there are clear boundaries between topics, and the vocabulary contained in each topic is highly relevant and unambiguous26,55. Although both perplexity and consistency score can be used to determine the \(k\), we found that consistency score is more effective in evaluating the model as it can more directly and clearly reflect the optimal number of topics, which better meets our research needs of analyzing policy texts and revealing policy topics. Therefore, the \(k\) with the highest consistency score was chosen as the basis for topic categorization in this study (Fig. 2).
Fig. 2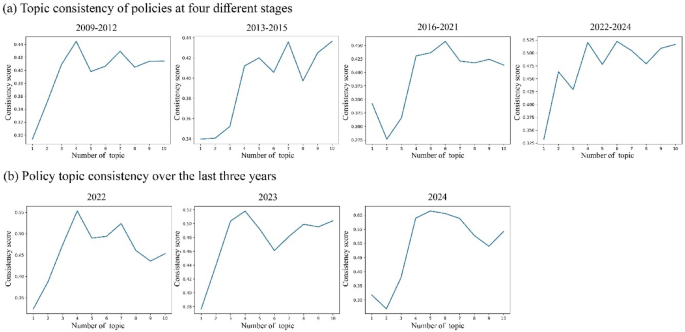
Thematic consistency scores of greening policies in Wuhan.
-
(3)
Topic classification with LDA: After determination of \(k\), the LDA model was parameterized. Supported by prior validations and research26,56,57, we adopted default settings of α = 50/k and β = 0.01 for LDA. The parameter α controls topic sparsity per document, with a higher value (e.g., 50/k) promoting more topics, ideal for diverse policy texts. Conversely, a lower β (e.g., 0.01) concentrates vocabulary distribution per topic, improving interpretability51.Such settings can help the model to better learn the associations between documents and topics as well as between words and topics. The model was iterated 1000 times to ensure adequate learning and stable results.
-
(4)
Calculation of topic similarity: After completion of topic model training for each stage, the topic similarity between successive stages was calculated to identify the evolution and persistence of topics over a time span. Specifically, the calculation involves integration of the topics at each stage into text strings according to the contained vocabulary. For two consecutive stages, we transformed the textual data using the TF-IDF vectorization method and computed the cosine similarity between the TF-IDF vectors, which is a metric used to assess the directional similarity between the two sets of data with the following equation15:
$$\begin{array}{*{20}c} {Cosine Similarity\left( {A,B} \right) = \frac{A \cdot B}{{\left| {\left| A \right|} \right|\left| {\left| B \right|} \right|}}} \\ \end{array}$$
(4)
where \(A\) and \(B\) are two TF-IDF vectors, \(A \cdot B\) is the dot product of the vectors, and \(\left| {\left| A \right|} \right|\) and \(\left| {\left| B \right|} \right|\) are the modes of the vectors (i.e., the lengths of the vectors). The result of this formula ranges from − 1 to 1. When the cosine similarity value is 1, − 1, and 0, it indicates that the two vectors have exactly the same, opposite, perpendicular direction, respectively.
-
(5)
Calculation of the share of each topic in each year: For the annual data, we calculated the share of each topic in each year. This step provides data support for policy development and adjustment by analyzing the occurrence frequency of each topic in each year’s documents and proportionally assigning the topics to each document, thereby revealing the focus and changes in policy concerns in each year. The specific calculation process is as follows.
-
Topic occurrence frequency: The times that each topic appears in each document is counted to obtain the absolute frequency \(f_{t,d}\) of each topic, where \(t\) represents a specific topic and \(d\) represents a specific document.
-
Total topic frequency: The total occurrence frequency \(F\) of all topics in all documents, i.e., the sum of all \(f_{t,d}\), is calculated.
-
Topic percentage calculation: For each topic, the percentage is derived from the ratio of its occurrence frequency in all documents to the total frequency of all the topics:
$$\begin{array}{*{20}c} {P\left( t \right) = \left( {\frac{{\mathop \sum \nolimits_{d} f_{t,d} }}{F}} \right) \times 100\% } \\ \end{array}$$
(5)
where \(P\left( t \right)\) denotes the percentage of topic \(t\), reflecting the importance of that topic relative to all topics in the year.
In this way, the percentage of each topic can be used to indicate its relative weight in the annual policy, providing a quantitative basis for analyzing the policy focus in each year.
AI extraction of greening core indicators
In policy text analysis, extraction of core indicators is a key step to understand and quantify the effects of policy implementation. The common approaches include named entity recognition and entity relationship extraction, which are mainly used to identify and classify key entities in a text (such as locations, names of people, organizations, or other proper names) and their interrelationships in an unstructured text. Named entity recognition aims at tagging out specific entities in the text, while entity relationship extraction further analyzes the semantic connections between these entities, such as attribution and location relationships, thereby enabling more accurate and data-driven analysis and decision support58,59.
In this study, we chose Baidu’s AI Qianfan Big Model Platform (https://qianfan.cloud.baidu.com/) to extract the core metrics of greening efforts. This platform allows one-step big model development and service operation for enterprise developers, providing multi-functional natural language processing capabilities including Wenxin Yiyin’s underlying model and third-party open-source big models. The platform is based on Baidu Intelligent Cloud and adopts the PaddlePaddle deep learning framework as the underlying support, which is capable of realizing high-precision and high-performance model output through a small amount of data adjustment. The application of Qianfan Big Model avoids the complex training process of traditional deep learning models on entity relationship extraction, which greatly saves the development and training time. In addition, the platform provides AI development tools and a complete development environment, making it fast and accurate to handle large-scale and diverse policy documents60. The use of the Baidu AI Qianfan Big Model enables the researcher to focus on building and validating a methodological framework for policy analysis without inputting too many resources into the development and optimization of technical details. In this way, the researchers can more effectively focus on parsing and applying the policy data, thereby promoting the integration of theoretical research and practical application.
The module leverages a large language model and prompt engineering to generate structured greening metrics (e.g., year, region, metric value) in JSON format, enabling subsequent visualization and analysis (Supplementary Table S1). The specific operational process includes the following steps.
-
(1)
Prompt design Prompts are directive to guide a large model. The instruction can be a question or a text description with multiple parameters. Based on the prompts provided, the large model will generate corresponding texts or images60. In the large model, prompts affect the quality of the output as instructions. We carefully designed the prompts and debugged them to ensure that they correctly guide the model in extracting key information from the text, such as “year”, “region”, “type of indicator”, “value”, and “unit” (Supplementary Table S1).
-
(2)
Interface call The API of Baidu AI Qianfan model is programmatically called, and the pre-processed policy text and prompts are input.
-
(3)
Data storage The results extracted by the model are formatted and stored directly into a MySQL database, which facilitates subsequent data analysis, visualization, and provides structured data support for policy evaluation and decision-making.
Policy AI interpretation
This module uses the Baidu AI Qianfan Big Model for in-depth analysis and understanding of policy texts, following the AI processing workflow outlined in “AI extraction of greening core indicators” section, to produce standardized policy interpretations for decision-making support. Its advanced semantic understanding capability is especially suitable for dealing with complex or large-scale policy documents, which can greatly improve the standardization and objectivity of interpretation. For instance, using tailored prompt engineering, the model generates a summary of policy objectives, key terms, and potential impacts (Supplementary Table S1), enabling policymakers to quickly understand core policy elements.
The operation process is similar to the “Extraction of greening core indicators” module, which first determines the interpretation needs and designs appropriate prompts to guide the AI model to focus on the key contents or issues of the policy text. Through the programming interface, the pre-processed policy text is submitted to the large model and parameters are configured to perform in-depth semantic analysis (Supplementary Table S1). Ultimately, the model outputs will form policy interpretations to provide important insights and support to policy makers and analysts.
Real-time policy tracking
Real-time policy tracking is a key component of this study, designed to enable continuous monitoring of policy releases. While current data sources remain limited, the tracking module lays the foundation for integrating multi-source data (e.g., greening policies from government platforms, social media evaluations) to provide policymakers with comprehensive policy dynamics for timely adjustments and optimized designs. The specific operation process is as follows.
-
(1)
Setting of a monitoring module: An automated policy monitoring module is set up, which regularly scans the official websites of the government and related departments on a daily basis to identify newly released or updated policy information. This module utilizes search with keywords such as “greening” and “parks” and automated crawling to ensure that all relevant policies are captured in time.
-
(2)
Real-time push: Once a new policy is identified, the module will automatically extract and store key metadata in the database, including the policy’s publication source, date, title, and link. The data are pushed to the front-end display interface in real-time through a customized interface, ensuring that decision makers and analysts can instantly receive the latest policy changes and information.
Visualization of intelligent analysis results
In this study, a series of cutting-edge front-end and back-end technologies and tools were used to visualize the results of intelligent analysis. The front-end part mainly uses basic technologies such as HTML, CSS, and JavaScript, combined with the Vue.js framework to build the user interaction interface to ensure the responsiveness and interactivity of the application. For data visualization, we chose AntV G2Plot charting library and AntV L7 geographic information visualization tool from AntV, which together support the graphical representation of complex data and dynamic display of geographic information. The back-end part utilizes Python and Flask frameworks to develop API for processing the front-end requests and realize data interaction with MySQL database, thereby ensuring real-time data processing and feedback.
The whole visualization provides not only a convenient tool for researchers to observe and analyze the impact of policies, but also an intuitive platform for policy makers and the public to understand policy directions and trends, which greatly enhances the transparency and public participation in policy research, thus promoting the open sharing of information and democratization of the decision-making process.