Contrasting SSTA patterns and soil moisture anomalies in SY and MY La Niña events
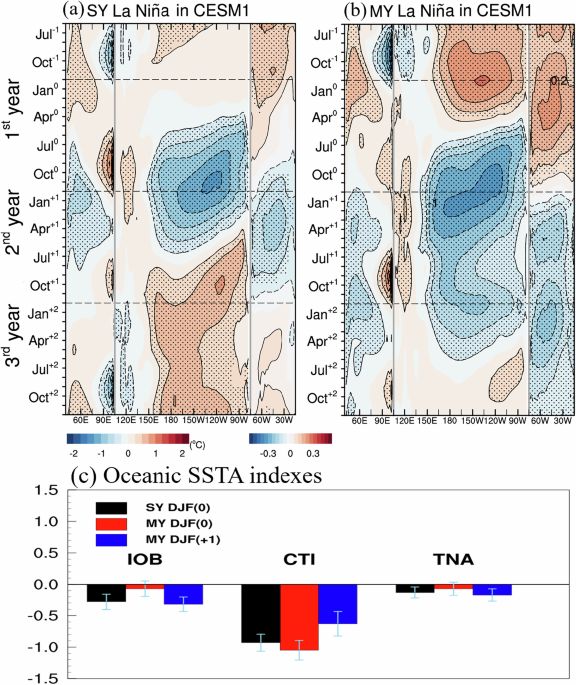
The CESM1 Pre-Industrial simulation identified 351 La Niña events from model year 400 to 2200, with 72% classified as MY and 28% as SY (see “Methods” for the identification criteria). These proportions closely resemble the 83% MY and 17% SY La Niña events observed from 1948 to 2022. In the simulated SY La Niña (Fig. 1a), negative SSTAs onset in March0-April0-May0 (MAM0), peak in December0-January+1-February+1 (DJF0), and decline before transitioning to El Niño by June+1-July+1-August+1 (JJA+1) of the following year. In contrast, the MY La Niña also starts in MAM0 and peaks in DJF0 (Fig. 1b), but persists into the second year, gradually diminishing by June+2-July+2-August+2 (JJA+2) of the third year and showing a weaker secondary peak in December+1-January+2-February+2 (DJF+1) during that second year. In this study, the year leading up to the La Niña event is labeled as year −1, with the onset year and the two subsequent years marked as years 0, +1, and +2, respectively.
Fig. 1: Composite SSTAs for the simulated SY and MY La Niña events during the years 400–2200 of the CESM1 Pre-Industrial simulation.
a Longitude–time plot of SSTAs (shaded; in °C) along the equatorial Indo-Pacific Oceans (5°S–5°N) and the tropical North Atlantic Ocean (5°N–25°N) from June (−1) to December (+2) for the simulated SY La Niña; b Same as (a) but for the simulated MY La Niña; c Values of the composite IOB, CTI, and TNA indices for the simulated SY La Niña during DJF0 (black bars), and DJF0 (red bars) and DJF+1 (blue bars) of the simulated MY La Niña in the CESM1 Pre-Industrial simulation. The latitudinal averages are different between the Indo-Pacific Oceans (5°S–5°N) and the tropical North Atlantic Ocean (5°N–25°N). The reason is that SSTAs in the Indo-Pacific region associated with ENSO and IOB variability are typically confined near the equator. In contrast, the TNA region influences climate primarily through SSTAs located farther north. The error bars in (c) represent one standard deviation of the oceanic index values. Hatchings in (a) and (b) indicate areas where the values exceed the 95% confidence interval, determined using a two-tailed Student’s t-test.
The simulated MY and SY La Niñas exhibit three key differences in their SSTA patterns: distinct pre-onset conditions, varying peak intensities, and different teleconnections to the neighboring tropical Indian and North Atlantic Oceans5,31,32. The composite MY La Niña is preceded by a strong El Niño in the previous year (Fig. 1b), whereas the composite SY La Niña lacks this precursor (Fig. 1a), highlighting the importance of heat discharge from the strong El Niño for MY La Niña formation. Additionally, the MY La Niña reaches a stronger peak intensity than the SY La Niña during its first DJF but exhibits a weaker intensity in its second DJF. We also find from Fig. 1 that the CESM1 pre-industrial simulation realistically captures the typical La Niña teleconnections to the Indian and Atlantic Oceans, including the basin-wide cold SSTAs in the Indian Ocean—known as the Indian Ocean Basin (IOB) mode—and cold SSTAs in the tropical North Atlantic (TNA). Both patterns tend to peak during the boreal spring (MAM) season of the La Niña decaying year20,21. Figure 1a, b further indicates that the MY La Niña induces a weaker cold phase of the IOB mode and weaker SSTAs in the TNA region during its first year compared to SY La Niña. These differences in trans-basin teleconnection between SY and MY La Niñas stem from their distinct pre-onset conditions. The strong preceding El Niño, which is known to induce a warm IOB in the Indian Ocean and warm SSTAs in the TNA region, can persist after the onset of MY La Niña, counteracting the cold IOB and cold SSTAs that are typically induced by MY La Niña during its first DJF. As the MY La Niña progresses into its second year, the negative IOB and TNA conditions re-emerge. These key differences between SY and MY La Niñas during DJFs are reflected in the changes in the Cold Tongue Index (CTI), IOB index, and TNA index (see “Methods”) values, as shown in Fig. 1c. These three distinct SSTA features across the tropical Pacific, Indian Ocean, and Atlantic may contribute to varying soil moisture patterns between MY and SY La Niñas.
We then examine soil moisture anomalies for the La Niña events in the CESM1 simulation during the DJF season (Fig. 2), focusing on the top 10 centimeters of surface soil moisture. Surface soil moisture in CESM1 is simulated using the Community Land Model version 5.0 (CLM5.0), which incorporates a multi-layer soil column and physically based representations of vertical water movement and land surface processes (see “Methods” for details). While some model biases remain—particularly in arid and semi-arid regions—CESM1 reproduces the broad spatial patterns of DJF surface soil moisture climatology when compared with NOAA CPC observations (see “Methods” and Fig. 8), providing confidence in its utility for assessing soil moisture variability during SY and MY La Niña events. Our analysis of the CESM1 pre-industrial simulation shows that SY La Niña events generally lead to soil moisture drying in North America and the Middle East, and soil moisture wetting in Australia, the Sahel, and South America (Fig. 2a). Similar soil moisture patterns were found during the first and second-year DJFs of simulated MY La Niña events (Fig. 2b, c). To identify where MY La Niña events produce the most significant differences in soil moisture response compared to SY La Niña, we calculated the ratios of soil moisture anomalies during the first and second DJFs of MY La Niña to those during the DJF of SY La Niña (Fig. 2e, f). Ratios greater than 1 signify an amplification effect during MY La Niña events. This analysis reveals two key features: first, simulated MY La Niña events amplify drying anomalies in North America and the Middle East, as well as wetting anomalies in Australia and the Sahel across both the first and second-year DJFs. The amplification effect in South America, however, is relatively weak and disappears in the second DJF (c.f. Fig. 2d–f). Second, the amplification effect becomes stronger in the second DJF of MY La Niña in these four regions (Fig. 2d) and covers a broader geographic area compared to the first DJF (cf. Fig. 2e, f). Our findings suggest that, in the CESM1 simulation, MY La Niña amplifies the typical DJF soil moisture impacts of SY La Niña in four key regions —North America, the Middle East, Australia, and the Sahel (highlighted by black boxes in Fig. 2e, f) —with the strongest effects occurring in the second DJF.
Fig. 2: Composite soil moisture anomalies and ratios of soil moisture anomalies for SY and MY La Niñas in CESM1.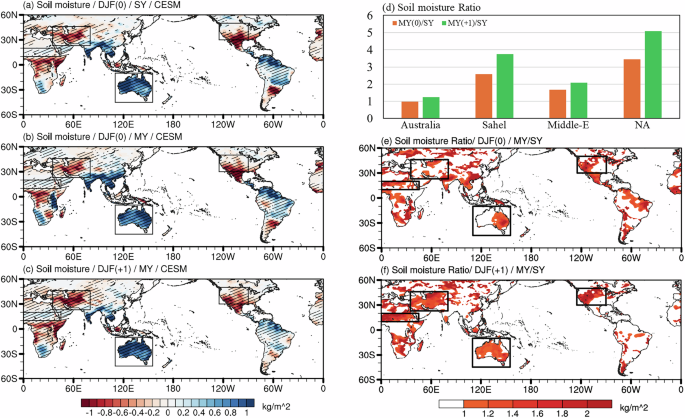
Composite soil moisture anomalies for a the DJF of the simulated single-year La Niña, b first (DJF0) and c second DJF (DJF+1) of the simulated MY La Niña in the CESM1 simulation; e, f are the ratios of soil moisture anomalies, calculating by the first DJF and second DJF of MY La Niña divided by the SY La Niña; d is the average of soil moisture ratios in (e) and (f) in four regions: Australia, Sahel, Middle East, and North America. Hatchings in (a–c) indicate areas where the values exceed the 95% confidence interval determined using a two-tailed Student’s t-test.
It is worth noting that the amplified soil moisture center in the Middle East extends slightly into Central-East Asia. The soil moisture wetting is primarily confined to the southern United States during the SY La Niña. However, during the MY La Niñas, the wetting extends northeastward, with the amplification of soil moisture wetting spanning from the southwest to the northeast across North America. Therefore, we chose to generalize this response as occurring over North America as a whole. In addition to the four key regions highlighted in this study, amplification of soil moisture also appears in parts of northern South America, including the Amazon, particularly during the first DJF of the MY La Niña. In the second DJF, however, this wetting signal becomes more fragmented and limited to scattered areas. A similar pattern is seen in southern Africa, where the amplification is more widespread in the first DJF but contracts to a smaller area in the second DJF. These patterns suggest that amplification effects can extend beyond the four focus regions. However, we concentrated on these four regions because they consistently exhibit the most robust and persistent amplification signals, providing a clearer basis for analysis.
Factors contributing to amplified soil moisture anomalies in MY La Niña events
Precipitation is a key factor in the mechanisms affecting soil moisture. To investigate this, we compared the composite DJF precipitation anomalies during simulated SY and MY La Niña events in Fig. 3a–c. Both types of La Niñas result in increased rainfall in Australia and decreased rainfall in North America, the Middle East, and the Sahel. The negative precipitation anomalies cover the southern U.S. during SY La Niña events, while extending across the entire United States during MY La Niña events. In the Middle East, negative precipitation anomalies during both SY and MY La Niña events even extend into Central Asia. Decreased rainfall anomalies explain the drying soil moisture in North America and the Middle East for both SY and MY La Niñas, while increased rainfall anomalies lead to increased soil moisture in Australia. However, the decreased rainfall anomalies in the Sahel do not account for the increased soil moisture found during SY and MY La Niña events. This suggests that precipitation alone cannot explain the soil moisture increase in this region. Additional contributing factors—such as evapotranspiration, runoff, and drainage—need to be considered in the Sahel to assess their potential roles in the wetting signal found during La Niña events.
Fig. 3: Composite precipitation anomalies and the ratios of soil moisture anomalies to precipitation anomalies during SY and MY La Niñas in CESM1.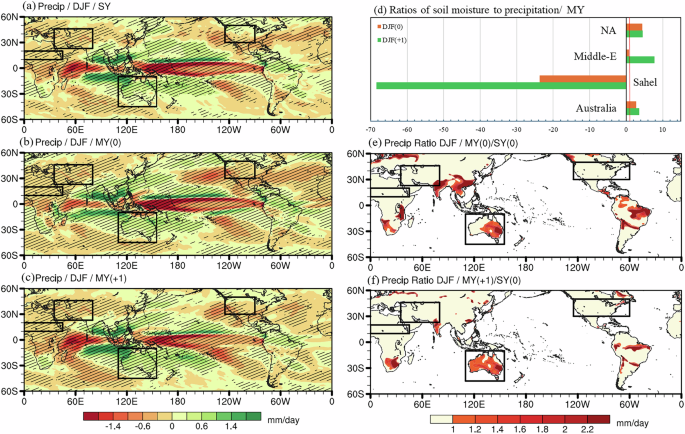
Composite precipitation anomalies during a the DJF of the simulated SY La Niña, b first DJF (DJF0) and c second DJF (DJF+1) of the simulated MY La Niña in the CESM1 simulation; d The ratios of soil moisture anomalies to precipitation anomalies during first DJFs (orange bars) and second DJFs (green bars) of MY La Niñas; e, f are the ratios of precipitation anomalies, calculating by the first DJF and second DJF of MY La Niña divided by the SY La Niña. In (d), both soil moisture (kg m⁻²) and precipitation (mm d⁻¹) anomalies were normalized by their respective climatological standard deviations before taking the ratio. The ratio in (d) is dimensionless. Hatchings in (a–c) indicate areas where the values exceed the 95% confidence interval determined using a two-tailed Student’s t-test.
We next focused on the three key regions where La Niña-induced precipitation and soil moisture anomalies align (cf. Figs. 2a–c, 3a–c): Australia, North America, and the Middle East. The goal was to identify where the amplification of soil moisture anomalies from SY to MY La Niñas could be directly attributed to a corresponding amplification of precipitation anomalies. Analysis of the precipitation anomaly ratios between MY and SY La Niñas (Fig. 3e, f) shows that amplified precipitation anomalies (i.e., ratio greater than 1) occur only in Australia, particularly in the second DJF. In this region, the intensified soil moisture anomalies from SY to MY La Niña and from the first to second DJF of MY La Niña are directly linked to increased precipitation. However, no amplified precipitation deficits were observed in North America or the Middle East in either DJF of MY La Niña, indicating that precipitation alone cannot explain the intensified soil moisture drying in these two regions during MY La Niña events.
In North America and the Middle East, one explanation for the amplified soil moisture anomalies during MY La Niña events is that anomalies caused by precipitation deficits in the first DJF persist into the second, accumulating with new precipitation-induced anomalies to intensify the overall impact. To explore this, we calculated the ratios of soil moisture anomalies to precipitation anomalies for both DJFs across the four regions (Fig. 3d). The results show a notable increase in the Middle East, indicating that accumulated soil moisture anomalies contributed to the amplification. Australia also exhibits a significant increase, where both amplified precipitation (as mentioned earlier) and accumulation effects play a role in the intensified soil moisture during the second DJF of MY La Niña. In North America, the smaller ratio increase suggests that accumulation contributes to the amplified soil moisture anomalies, consistent with Okumura et al.3, who found that precipitation deficit conditions from the first DJF persisted into the second. However, this effect is weaker than in Australia and the Middle East. The prolonged duration of MY La Niñas enhances their impact on soil moisture across these three regions. In contrast, the negative ratios in the Sahel again indicate that the amplified soil moisture anomalies during MY La Niña are not driven by local precipitation.
For the Sahel region, precipitation anomalies alone cannot account for the positive soil moisture anomalies or their amplification from SY to MY La Niña composites. To more rigorously investigate the processes contributing to elevated soil moisture during these events, we conducted a surface soil moisture budget analysis. Surface soil moisture variability is influenced by five primary processes: precipitation, snowmelt, evapotranspiration, runoff, and drainage23. Among these, precipitation and snowmelt act as moisture sources, while evapotranspiration, runoff, and drainage serve as moisture sinks. We calculated DJF anomalies for all five terms, averaged over the Sahel region, based on composites of SY and MY La Niña events using CESM1 pre-industrial simulations. These results are summarized in Table 1. The table shows that both source terms—precipitation and snowmelt—are reduced during SY and MY La Niña events. In addition, two of the three sink terms—runoff and drainage—are increased. These four processes therefore cannot account for the positive surface soil moisture anomalies during La Niña events in the Sahel. Only the negative evapotranspiration anomalies, which act to decrease moisture loss from the land surface, are consistent with the increased soil moisture found in both SY and MY La Niña composites. Moreover, the magnitude of the negative evapotranspiration anomaly increases from −0.0059 mm/day during SY La Niña to −0.0089 mm/day and −0.0061 mm/day during the first and second DJFs of MY La Niña events, respectively. This stronger reduction in evapotranspiration during the MY La Niña helps explain why the soil moisture anomalies in the Sahel are amplified relative to SY La Niña events. The continued increase in soil moisture from the first DJF to the second DJF of the MY La Niña, despite a slightly weaker reduction in evapotranspiration, is likely driven by cumulative moisture retention from the first year, indicating a compounding effect of suppressed evapotranspiration across consecutive DJF periods.
Table 1 Average soil moisture budget in the Sahel
To explore the drivers of the reduced evapotranspiration over the Sahel during SY and MY La Niña events, we examined two key atmospheric factors: near-surface atmospheric humidity and net downward radiation. Net radiation provides the energy required for evapotranspiration, particularly when soil moisture is available34, while atmospheric humidity influences the vapor pressure deficit (VPD), which governs atmospheric demand for moisture35. We calculated near-surface specific humidity, averaged between 975 hPa and 850 hPa, over the Sahel during both SY and MY La Niña events (not shown), and found negative anomalies in both cases. This indicates a reduction in atmospheric humidity, which would increase VPD and, all else equal, should enhance evapotranspiration. We also find that net downward radiation over the Sahel is enhanced during these events, with positive anomalies of 0.35 W/m² during SY La Niña, and 0.17 W/m² and 0.38 W/m² during the first and second DJFs of MY La Niña, respectively. These results suggest that atmospheric conditions during La Niña—reduced humidity and increased surface net radiation—should favor higher, not lower, evapotranspiration rates.
The fact that CESM1 simulates reduced evapotranspiration over the Sahel during both SY and MY La Niña events, despite these atmospheric conditions, indicates that atmospheric drivers alone cannot explain the response. Instead, the suppression of evapotranspiration likely stems from processes internal to the land surface system. Potential explanations include vegetation-mediated responses, such as reduced leaf area or stomatal closure under sustained water stress, changes in plant physiological behavior under elevated VPD, or shifts in the partitioning of surface energy that favor sensible heat flux over latent heat36,37. Although these mechanisms are not explicitly examined in this study, they represent plausible explanations for the Sahel’s land surface response to La Niña events. Future research is warranted to more fully understand how land surface processes in the Sahel respond to SY and MY La Niña events and contribute to regional soil moisture anomalies.
It is important to note that our surface soil moisture budget does not explicitly account for vertical water exchanges between soil layers. In particular, fluxes such as percolation from the topsoil to deeper layers or capillary rise from below can significantly influence surface soil moisture. These vertical redistributions are not represented as source or sink terms in our analysis, which may explain the residual imbalance between the summed fluxes and the diagnosed soil moisture anomalies. Future work could improve this analysis by incorporating a full vertical moisture flux decomposition within the land model to better constrain internal soil water dynamics.
The contributions of three oceans to soil moisture anomalies
As previously mentioned, MY and SY La Niña events display several distinct differences in their SSTAs within the tropical Pacific, as well as in their teleconnections with the tropical Indian Ocean and tropical North Atlantic. In this section, our goal is to identify which of these SSTA differences are most significant for influencing the effects of MY La Niña on soil moisture across the four regions. To address this question, we first conducted a multiple linear regression analysis to assess the relative contributions of SSTAs in the tropical Pacific (represented by the CTI index), Indian (IOB index), and Atlantic (TNA index) Oceans to DJF soil moisture variability in the CESM1 Pre-Industrial simulation (Fig. 4a–c). In this analysis, we focus on the anomalies associated with SST indices from three ocean basins: the CTI, IOB, and TNA indices. These three indices represent the dominant modes of tropical SST variability across the three major ocean basins and are used to examine how tropical ocean–atmosphere interactions modulate land climate. We then reconstructed soil moisture anomalies for the four regions—North America, the Middle East, Australia, and the Sahel—by multiplying the average regression coefficients for each region with the oceanic SSTA indices (Fig. 4d–g). This approach allowed us to quantify the contributions of each ocean to soil moisture anomalies in these regions during the simulated SY and MY La Niñas.
Fig. 4: The regression coefficients of multiple regression for three oceanic indices and reconstructed soil moisture calculated by multiplying the three oceanic indices.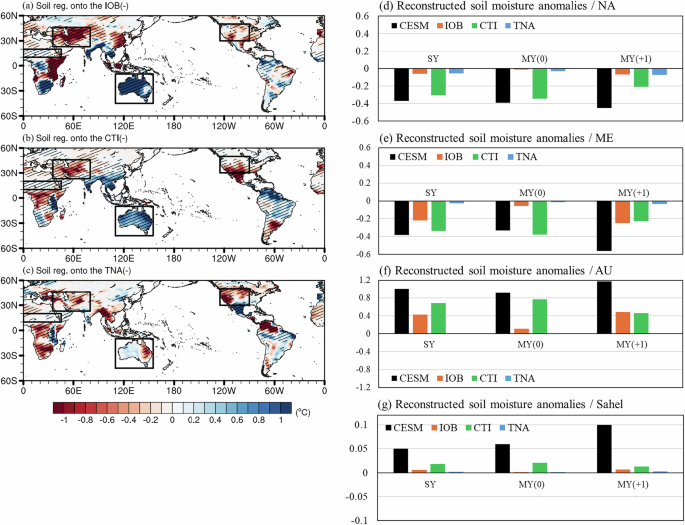
Including negative IOB (a), CTI (b), and TNA (c), regressed onto soil moisture anomalies; d–g reconstructed soil moisture calculated by multiplying the three oceanic indices during the DJF of SY La Niña, as well as the first and second DJFs of MY La Niña, by the averaged regression coefficients over the four regions. Hatchings in (a–c) indicate areas where the values exceed the 95% confidence interval, determined using a two-tailed Student’s t-test.
The multi-regression analysis (Fig. 4a–c) shows that La Niña SSTAs in the tropical Pacific (represented by negative CTI), La Niña-induced negative IOB SSTAs in the Indian Ocean, and negative TNA SSTAs in the Atlantic Ocean can all contribute to soil moisture drying in North America. However, the reconstruction analysis reveals that soil moisture anomalies in North America during La Niña events in the CESM1 simulation (black bars in Fig. 4d) are primarily driven by Pacific SSTAs (represented by the CTI) (green bars in Fig. 4d). In contrast, contributions from La Niña-induced SSTAs in the Indian and Atlantic Oceans (represented by the IOB and TNA indices, respectively) are minimal. As mentioned in the discussion of Fig. 3, La Niña-driven precipitation anomalies account for the soil moisture responses observed in North America during both the simulated SY and MY La Niña events. Previous studies have suggested that during La Niña events, cold SSTAs in the tropical Pacific can shift the tropospheric jet stream northward, redirecting storm systems toward the Pacific Northwest and resulting in decreased rainfall in the southern United States38,39,40. This mechanism explains how Pacific SSTAs predominantly shape the soil moisture responses in both the simulated SY and MY La Niña events through jet stream displacements.
The multi-regression analysis also shows that La Niña SSTAs associated with the CTI, IOB, and TNA indices can all contribute to soil moisture drying in the Middle East and soil moisture wetting in Australia (Fig. 4a–c). The reconstruction analysis further reveals that the drying soil moisture anomalies in the Middle East and the wetting soil moisture anomalies in Australia during the simulated SY and MY La Niña events are primarily attributable to Pacific and Indian Ocean SSTAs, while the Atlantic SSTAs play a minimal role (Fig. 4e, f). Previous studies have shown that the cold SSTAs associated with La Niña in the Pacific can enhance the Pacific Walker circulation, increasing convection and rainfall over Australia41,42. Also, La Niña-induced cold SSTAs in the Indian Ocean can enhance westerly winds that bring warmer waters and provide more moisture closer to Australia, thereby increasing rainfall43. Additionally, research has highlighted the crucial role of Indian Ocean SSTAs in enabling La Niña events to reduce precipitation in the Middle East by inducing high-pressure systems over the East Asian continent and promoting convergent circulation at upper levels44. The La Niña SSTAs in the Pacific can also shift the subtropical jet stream during DJF, leading to reduced storm activity and precipitation45,46. This results in drier soil moisture conditions over the Middle East. However, the Indian Ocean influences on Australia and the Middle East soil moisture weakened significantly during the first DJF of MY La Niña due to the diminished Indian Ocean response related to the pre-onset El Niño condition (see Fig. 4e, f).
In the Sahel region, the reconstruction analysis indicates that the CTI and IOB are the two primary contributors to soil moisture variations during the simulated SY and MY La Niña events. However, the reconstructed soil moisture anomalies are notably smaller than the composite anomalies for both the simulated SY and MY La Niña events (Fig. 4g). This suggests that La Niña-related SSTAs have less influence on moisture variations in the Sahel compared to the other three regions analyzed in this study. One possible explanation is that soil moisture anomalies in the Sahel arise not from direct atmospheric moisture forcing, but from land surface processes—such as reduced evapotranspiration—that act in response to large-scale SST forcing. The sensitivity of these land surface responses may be modulated by ENSO intensity (captured by CTI) and Indian Ocean SST conditions (represented by the IOB index), which could influence regional energy balance or vegetation behavior. These mechanisms are not explicitly examined here but offer a plausible link between oceanic SST patterns and soil moisture responses in the Sahel, and they warrant further investigation.
We next conducted the forced AGCM experiments (see “Methods”) to verify the individual contributions of SSTAs in the three oceans to soil moisture anomalies. The CAM5 simulations also capture the broad DJF soil moisture climatology (see “Methods” and Fig. 8), supporting their use in assessing SST-forced responses. The AGCM-All experiments (Fig. 5d–f) reasonably replicate the signs of anomalous soil moisture conditions produced by the simulated SY and MY La Niña in the CESM’s 2200-year Pre-Industrial simulation (Fig. 5a–c), including drying soil moisture anomalies over North America and the Middle East, as well as wetting soil moisture anomalies over Australia and the Sahel during both SY and MY La Niñas events. In most of these regions, even the magnitudes of the soil moisture anomalies produced by the AGCM-All experiments are close to those produced in the CESM simulation (Fig. 5p–r). The soil moisture anomaly patterns generated by the AGCM-All experiments in the Middle East are most closely aligned with those of the CESM simulation. In this region, the responses of soil moisture anomalies during the simulated SY La Niña and the first DJF of the simulated MY La Niña are dominantly influenced by Pacific Ocean SSTAs, while during the second DJF of the simulated MY, the role of Indian Ocean SSTAs has increased. Results from these forced AGCM experiments are highly consistent with the reconstructed regression analysis we show in Fig. 4e. The AGCM-All experiments also produce high consistency in soil moisture responses with the CESM simulation over Australia. In this region, Indian Ocean SSTAs have the greatest impact on soil moisture anomalies during both SY and MY events. Previous studies have also suggested that the IOD’s impact on rainfall during the DJF and MAM seasons in southeastern and southwestern Australia can be particularly pronounced, and that the Indian Ocean exerts a stronger influence on lower-frequency variability such as multi-year droughts47,48. Soil moisture anomalies produced by the AGCM-IO experiment are closest to those produced by the AGCM-All experiment, followed by the AGCM-PO experiment. Contribution from the Atlantic Ocean is minimal, as indicated by the AGCM-AO experiment. The results from these forced AGCM experiments are consistent with the reconstructed regression analysis (Fig. 4f), which shows that Pacific and Indian Ocean SSTAs contribute the most to soil moisture variation during La Niña events. However, the relative influences of these two oceans differ between the reconstructed regression analysis and the forced AGCM experiments. Together, our reconstruction analysis and forced AGCM experiments suggest that soil moisture variations in both Australia and the Middle East during La Niña events are primarily driven by SSTAs in the Pacific and Indian Oceans.
Fig. 5: Composite soil moisture anomalies during SY and MY La Niñas in AGCM experiments.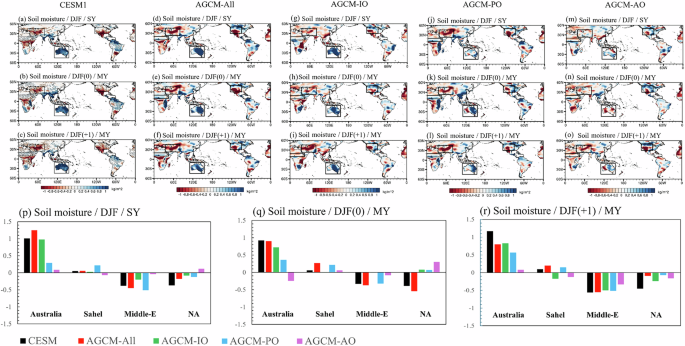
For a the DJF of the simulated single-year La Niña, b first (DJF0) and c second DJF (DJF+1) of the simulated MY La Niña in the 2200-year Pre-Industrial simulation. (d–f), (g–i), (j–l), and (m–o) mirror (a–c) but for the AGCM-All experiments, AGCM-IO experiments, AGCM-PO experiments, and AGCM-AO experiments, respectively. p Averaged soil moisture anomalies (units: kg/m²) across four key regions during SY La Niñas in the Pre-Industrial (black bars), AGCM-All experiments (red bars), AGCM-IO experiments (green bars), AGCM-PO experiments (blue bars), and AGCM-AO experiments (purple bars). (q) and (r) replicate (p) but for the first and second DJFs of MY La Niñas, respectively. Hatchings in (a–c) indicate areas where the values exceed the 95% confidence interval, determined using a two-tailed Student’s t-test.
However, over North America and Sahel, results from these forced AGCM experiments are not consistent with findings from the reconstructed regression analysis. Our reconstruction analysis indicates that the drying soil moisture over North America during both the simulated SY and MY La Niñas is primarily related to the Pacific SSTAs (see Fig. 4d). However, in the forced AGCM experiments, the Pacific contributions revealed by the AGCM-PO experiments are comparable to or weaker than the contributions from the Indian Ocean revealed by the AGCM-IO experiments (Fig. 5p–r). The lesser consistency observed in North America may be attributed to the absence of SSTA forcing from the La Niña-induced SSTAs in the extratropical North Pacific in the experiments. As for the Sahel region, the La Niña-induced wetting soil moisture effects produced by the CESM1 simulation are overestimated by the AGCM-All experiments (Fig. 5p–r) and mostly dominated by the Pacific SSTAs, which are different from the findings from the analyses we presented in composite precipitation anomalies (c.f. Fig. 3) but is consistent with the reconstructed regression analysis (c.f. Fig. 4). These complex and somehow contradicting results again suggest that the La Niña impacts on Sahel soil moisture during DJF involve processes that are more complex that other three regions and are likely not linearly or directly related to La Niña SSTAs.
In summary, the soil moisture response demonstrates the highest consistency in the Middle East and is notably consistent in Australia across both AGCM experiments and CESM. Similarly, the Sahel shows minimal influence from SSTAs in both AGCM experiments and CESM. However, there is a notable inconsistency in North America between AGCM experiments and CESM, potentially stemming from the lack of SSTAs forcing from the Northern Pacific in the AGCM experiments.
Observed amplified soil moisture anomalies during 1948–2022
Between 1948 and 2022, there were two observed SY La Niña events (1964/1965 and 1975/1976) and ten observed MY La Niña events (1949/1951, 1954/1956, 1970/1972, 1973/1975, 1983/1985, 1988/1990, 1995/1997, 2007/2009, 2010/2012, 2020/2022). Composite analyses of these observed events show that SY La Niña events resulted in soil moisture anomalies characterized by drying in North America and wetting in Australia and the Sahel (Fig. 6a), which aligns with the results from our CESM Pre-industrial simulation (Fig. 2a). However, unlike the simulation, the observed SY La Niña events did not produce a wetting soil moisture condition in the Middle East. The observed MY La Niña composite did clearly exhibit soil moisture drying in the Middle East (Fig. 6b, c). Observations also confirmed the simulation’s findings for MY La Niña events, showing wetting in Australia and drying in North America. However, unlike the simulation, the observed MY La Niña events showed wetting soil moisture conditions in the Sahel during both the first and second DJFs.
Fig. 6: Composite soil moisture anomalies and the ratios of soil moisture anomalies in the observation.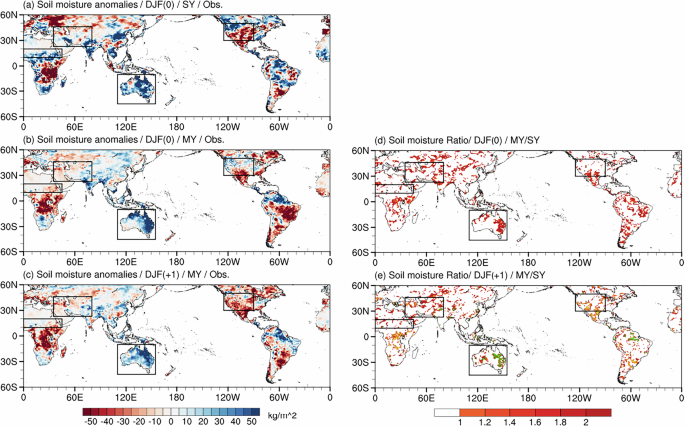
a The DJF of the observed SY La Niña, b first DJF (DJF0) and c second DJF (DJF+1) of the observed MY La Niña during 1948–2020. d, e The ratios of soil moisture anomalies, calculated by the first DJF and second DJF of MY La Niña divided by the SY La Niña. Yellow and green contours in (e) are negative and positive soil moisture anomalies in SY La Niña as illustrated in (a). Hatchings in (a–c) indicate areas where the values exceed the 95% confidence interval determined using a two-tailed Student’s t-test.
In terms of amplification effects, the observed MY La Niña events did intensify drying soil moisture anomalies over North America and the Middle East, while amplifying wetting anomalies over Australia during both the first and second DJFs (Fig. 6d, e), consistent with the CESM results. However, unlike the CESM, the observations show no amplified effect in the Sahel. Moreover, the amplification effects in the observations across these regions appear fragmented and less pronounced compared to those in the CESM. These discrepancies between observations and CESM simulations could be attributed to model biases or the limited number of observed events.