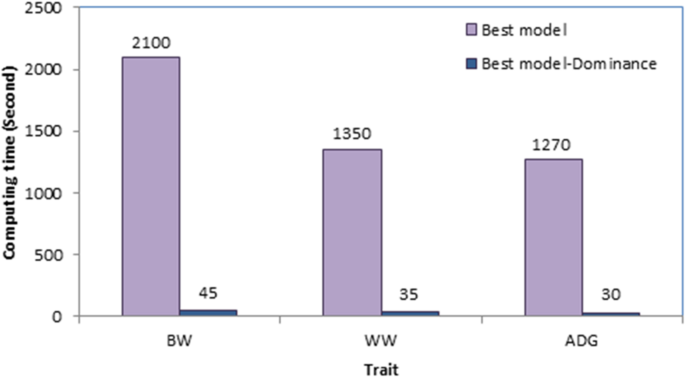
Despite decades of theoretical and experimental efforts, the quantification of non-additive genetic variation in livestock populations such as sheep remains challenging, leading to neglecting these effects from the genetic evaluation models. One of the reasons for neglecting dominance effects from the genetic evaluation process is presented in Fig. 1. As shown, including dominance effects in the model increased computing time between 42 and 47 times, depending on the trait. In addition, it needed a huge amount of memory (≈ 20 times). Therefore, longer computing time and higher memory requirements can be the “Achilles Heel” of such analyses. Our data was not a big dataset, nonetheless, for computing inverse of the relationship matricx for dominance effects from our pedigree (including 11658 individuals), nadiv package34 consumed 30 Gigabytes of RAM. Obviously, in dealing with big data, the analyses may take several hours and need a huge amount of memory. Therefore, due to high computational demand, analysis of big datasets may not be possible with conventional PCs. However, current results showed that although presenting dominance effects to the model significantly increased the computing burden, it increased the likelihood and predictive ability of the fitting model as well as the accuracy of the additive breeding values. Therefore, an additive + dominance model can be superior to a purely additive model in better unraveling the genetic variance components, leading to a more accurate and precise estimation of genetic parameters. Jasouri et al.25 and Liu et al.16 in chicken and Sadeghi et al.24 and Sadeghi et al.15 in goat reported improvement in general properties of the model by including dominance effects which is in line with our findings.
Our finding showed that dominance effects were part of residual variance and did not separate from additive genetic variance. Therefore, excluding dominance effects did not cause inflated additive genetic variance. Using genomic data, Moghaddar and van der Werf12 estimated additive and dominance genetic variances for body weight and body composition traits in Merino sheep and reported a notably lower residual variance in models containing the dominance effect. Heidaritabar et al.38 reported that dominance and epistasis effects were important for egg production traits in layers and when these effects were ignored from the genomic evaluation models, they were accumulated in residual variance. In Adani goat, Sadeghi et al.24 worked on body weight traits and reported that by including dominance effects, residual variance decreased in a range between 28.2% (weaning weight) to 59.2% (birth weight). Also, Sadeghi et al.15 reported a decrease in residual variance between 20.6% (ADG from 6 to 9 months of age) to 50.21% (ADG from weaning to 3 months of age) in Adani goat. A slight non-significant change in the estimation of additive genetic variance following including dominance effects in the model indicated some confounding between random effects. The confounding between additive and non-additive genetic effects based on pedigree has been reported in the literature39,40. Nishio and Satoh41 similarly reported a slight change in the estimation of additive genetic variance following including dominance effects in the model. Data size determines the magnitude of confounding between additive and non-additive genetic effects. The smaller the data size, the more will be the confounding between additive and non-additive genetic effects12.
There is a general scarcity regarding dominance heritability (\(\:{\varvec{h}}_{\varvec{d}}^{2}\)) in the literatures for body weight traits in sheep. Using genomic information, some authors tried to estimate the relative contribution of dominance effects to economic traits of sheep. For example Moghaddar and van der Werf12 estimated dominance heritability (\(\:{\varvec{h}}_{\varvec{d}}^{2}\)) for BW and WW of Merino sheep as 0.07 and 0.11. In Alpine Merino sheep, a large component of phenotypic variation for fleece extension rate (\(\:{\varvec{h}}_{\varvec{d}}^{2}\)=0.73), red blood cell count (\(\:{\varvec{h}}_{\varvec{d}}^{2}\)=0.28), and hematocrit (\(\:{\varvec{h}}_{\varvec{d}}^{2}\)=0.25), was explained by dominance effects42. In other livestock species, dominance heritability is available for growth traits estimated using conventional animal models. For example, Sadeghi et al.24 worked on Adani goats and reported \(\:{\varvec{h}}_{\varvec{d}}^{2}\) for body weight at birth, weaning, six, nine and twelve months of age as 0.15, 0.17, 0.11, 0.19 and 0.25, respectively, smaller than estimates of additive heritability (\(\:{\varvec{h}}_{\varvec{a}}^{2}\)) (0.35, 0.18, 0.36, 0.28 and 0.28, respectively). In addition, Sadeghi et al.15 estimated \(\:{\varvec{h}}_{\varvec{d}}^{2}\) for pre- and post-weaning average daily gain of Adani goat as 0.15 and 0.11, respectively. Heidaritabar et al.38 reported \(\:{\varvec{h}}_{\varvec{d}}^{2}\) for egg production, average egg weight, albumin height, egg color, yolk weight and age at sexual maturity for brown layers as 0.14, 0.22, 0.22, 0.20, 0.13 and 0.13, respectively. Jasouri et al.25 who worked on Iranian native fowl, reported \(\:{\varvec{h}}_{\varvec{d}}^{2}\) for body weight at birth, eight weeks and twelve weeks of age as 0.06, 0.08 and 0.01, respectively. In addition, \(\:{\varvec{h}}_{\varvec{d}}^{2}\) was 0.06, 0.06 and 0.08 for the age at sexual maturity, average egg weight and number of eggs, respectively. Li et al.43 reported that the dominant variance of broiler feed-related traits accounted for 29.5–58.4% of the genetic variance. These studies together with our findings show that dominance effects are an important component of phenotypic values.
Current estimates of \(\:{\varvec{h}}_{\varvec{a}}^{2}\) are within the range of other reports in Iranian sheep breeds29,44,45,46,47,48,49. The heritability of a trait corresponds to the fraction of the selection differential that can cause a genetic change in the offspring generation. The heritability thus acts as a filter that determines how efficiently a population can respond to phenotypic selection50. Our estimates of \(\:{\varvec{h}}_{\varvec{a}}^{2}\) for traits studied are below 0.1 which indicates that a limited response could be expected following the selection on these traits. Strong directional selection is predicted to erode additive genetic variance and, subsequently, decrease the heritability of a trait. As a consequence, the response to selection will be reduced51.
Estimates of dominance heritability were higher than additive heritability which did not agree with Moghaddar and van der Werf12, Jasouri et al.25, Sadeghi et al.24 and Sadeghi et al.15. This may be explained, to some extent, by the effect of the genetic structure of the populations and size of the data used in different studies. Another explanation for this finding is the Fisher’s52 hypotheses associated with his theory of dominance which predict that traits closely associated with fitness should have a significant dominance variance component, both due to the erosion of the additive component of variance and the evolution of directional dominance. Therefore, in addition to eroding additive variance, selection is also expected to act directly on genetic dominance, resulting in a further relative increase of dominance variance to total genetic variance13. Growth traits may have been correlated with fitness in the ancestral populations from which the contemporary Baluchi sheep has been drawn.
The results show that dominance variance was higher in lowly heritable traits. The heritability of BW (0.05) was lower than WW (0.08), but dominance heritability was higher for BW (0.29) compared to WW (0.15). Comparing WW with ADG and/or BW with ADG, a similar result was observed. Similarly, Moghaddar and van der Werf12 and Sadeghi et al.24 reported higher \(\:{\varvec{h}}_{\varvec{d}}^{2}\) for traits with lower \(\:{\varvec{h}}_{\varvec{a}}^{2}\), though there were expectations in both studies. However, more research is needed to have a clear-cut verdict about this finding. It is notable that data size plays a significant role in estimating dominance variance and, consequently, dominance heritability. Small data size has been reported as a potential reason for observing almost no dominance effect for body composition traits in sheep12.
Spearman’s correlation between the additive breeding values obtained from the best model and the best model without the dominance effects was high and close to unity indicating little change in additive breeding values after presenting dominance effects to the model. A correlation close to 1.00 means that the ranking of animals may not change across models. The later result is supported by information in Table 10 which shows that out of 10 and 50 top animals, nearly all of them remained in their groups after presenting dominance effects to the model. In other words, the ranking of top animals did not change across models. However, an increase in the accuracy of additive breeding values after including dominance effect in the genetic evaluation model has been frequently reported by Toro and Varona53, Duenk et al.23, Sadeghi et al.24 and Sadeghi et al.15 which are in agreement with our findings. It means that although the inclusion of dominance effects in the model, may not change the ranking of top animals, it increases the accuracy of estimated additive breeding values which means the accurate prediction of selection response. On the other hand, there are reports indicating a small improvement (2.3%) in the accuracy of genomic breeding values for body weight and body composition traits in Merino sheep as a result of accounting for the dominance effect12. They stated that it was because of the small variance component of the dominance effect in the studied traits, i.e., whatever the contribution of dominance effects is higher, the greater will be the increase in the accuracy of additive breeding values after the inclusion of dominance effects. Accordingly, Moghadar et al.12 reported that using additive + dominance models improved the accuracy of genomic evaluation for traits with higher dominance variation.
Positive additive genetic correlation between studied traits allows for improving all traits simultaneously. In agreement with our findings, some authors including Mokhtari et al.54 Eskandarinasab et al.44 and Singh et al.10 reported the positive additive genetic correlation between the growth traits of different breeds of sheep. Additive genetic correlation is the heritable relationship between traits. Although, from a breeding perspective, a positive additive genetic correlation between growth traits is preferred, a negative genetic correlation may also be desirable. For example, negative genetic correlation between two traits may limit the erosion of genetic variance of both traits by inducing a response of one trait to selection pressures on the other (correlational selection)55. In this study, for the first time, dominance genetic correlations between growth traits in sheep are estimated. Dominance genetic correlations between BW and WW and between BW and ADG were negative. Positive ra between BW and WW means that the value of BW in parents is correlated to the value of WW in offspring. Regarding dominance genetic correlation, regardless of whether the rd is positive or negative, the value of BW in the parent does not correlate to the WW value in offspring. While the additive genetic correlation would accelerate the response (if both traits were under the same direction of selection), the dominance correlation is not heritable, so it does not contribute to the response to selection (and hence doesn’t accelerate the response). The SE of dominance genetic correlations is higher than additive genetic correlations. In animal models, SE is an indicator of data size, data structure, and deep and quality of pedigree used49. Gerstmayr56 reported that the estimation of genetic correlations was more sensitive to data size and data structure than the estimation of heritabilities and that a larger sample is required to estimate a genetic correlation with the same accuracy as for heritability. In addition, the frequency of full-sib families in the population is also important because dominance effects contribute to the (co)variances between full-sib relatives. As a result, compared with additive genetic parameters, to have accurate estimates of dominance genetic parameters, a relatively bigger data size including a decent frequency of full-sib families is needed.
In conclusion, dominance effects significantly contributed to the phenotypic variation of body weight and average daily gain in Baluchi lambs. Accounting for dominance effects improved the likelihood and predictive ability of the model. A direct consequence would be more precise and accurate estimates of variance components and additive breeding value. In addition, an increase in the accuracy of additive breeding values was observed after presenting dominance effects to the model. However, accounting for dominance effects significantly increased the computing burden. Correlation between breeding values estimated by models with and without dominance effects was close to unity, indicating a little chance for re-ranking of top animals after inclusion of dominance effects in the model. While additive genetic correlations between traits were positively high, dominance genetic correlations were negative in 2 of 3 cases. Since the inclusion of dominance effects improved the general properties of the model and increased the accuracy of additive breeding values, a model including dominance effects would have an advantage over a purely additive model in unraveling the genetic variance components and prediction of breeding values.