Have you ever called in a report of graffiti or dumped trash, or hit a pothole and wondered when it was going to be fixed?
This week, we take a look at how city neighborhoods stack up on three of the most common public service requests in San Diego.
We examined the most recent 12 months of data for these three key data points. Want to see what was reported in your area? Read on.
Graffiti reports
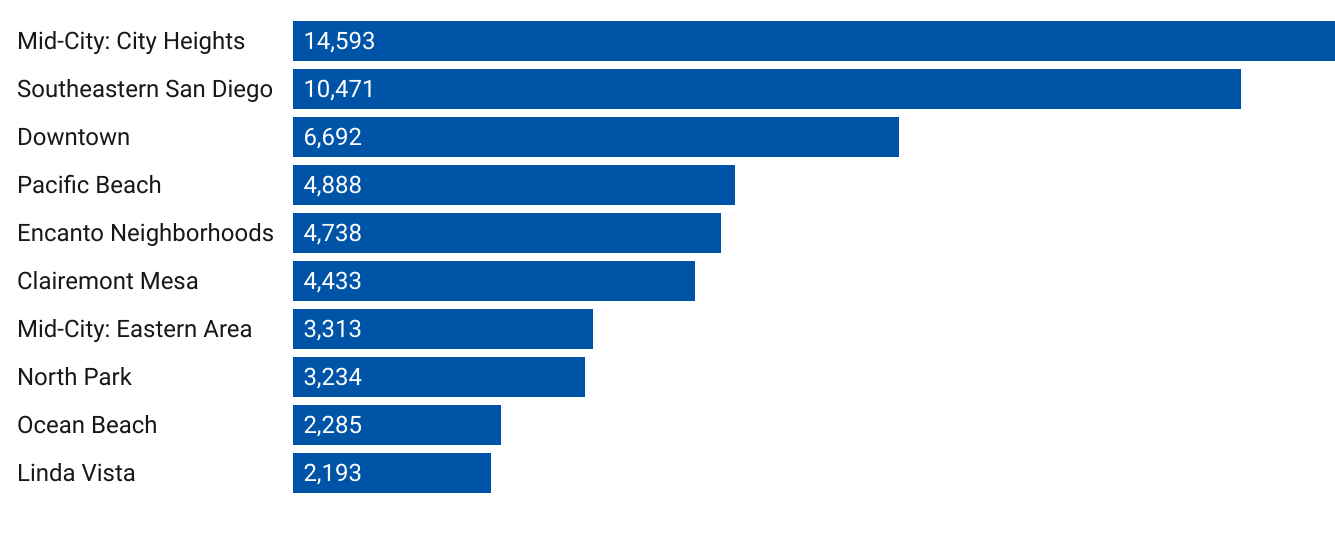
Here’s the list of the top 10 city districts by number of graffiti reports in the past 12 months.
Illegal dumping
The top 10 city districts by reports of illegal dumping.
Citywide, there’s plenty of variation in where dumping is reported. To see how that works over the course of a month, check out the interactive map we published here.
As we have reported previously at Times of San Diego, the city’s overall data on illegal dumping includes many cases where workers log the items themselves, then clean it up on the spot. So these numbers include some reports by residents, but in most cases a far larger number of reports by workers.
Potholes
Here are the districts with the most pothole reports.
As we’ve reported here at Times of San Diego, potholes have a season! To see how a year’s worth of potholes gets reported and repaired, see the interactive map we published here.
Maps of San Diego graffiti, dumping and pothole reports
See the last 12 months of reports here. Note, this data excludes a small number of reports that lacked enough location information to place them in any city district, and in general it excludes work that was reported by city workers — so it more closely shows reports filed to the city’s “Get It Done” system.
Have you had an experience reporting illegal dumping? Let us know at data@timesofsandiego.com.
Neighborhoods go by many names, and San Diego has many of them! Here’s how we break them down.