Policy text mining
To deeply analyze the CMECP and reveal its core issues and trends, this study adopts ROST CM6 software for text mining and analysis. ROST CM6 is a social computing platform developed by a team of professors at Wuhan University in China. It integrates text analysis functions, including word segmentation, high-frequency words analysis, cluster analysis, etc. (Wang 2022). Through advanced text processing technology, this tool extracts keywords from policy texts and constructs a social network graph (Sun and Ding 2023), and then analyses the semantic relationship between keywords. This step can help mine key information such as policy focus, focus, and implementation path, and provide a basis for policy optimization.
High-frequency keywords analysis
To gain an in-depth understanding of the core content and development trends of the CMECP, this research carries out a detailed analysis of 34 national level CMECP texts using the ROST CM6 tool. Before the text analysis, the research first eliminated functional words and irrelevant words to ensure that the analysis focused on keywords directly related to the policy theme, to improve the accuracy and effectiveness of the analysis. Subsequently, high-frequency keywords are subsequently extracted, and a word cloud is formed, as shown in Fig. 1. To gain a more comprehensive understanding of the high-frequency keywords in this field, this study further selects the top 20 high-frequency terms, such as “medical institutions” “services” “elderly care” and “health” (see Table 1). These terms intuitively reflect the main focus and critical areas of the CMECP.
Fig. 1
Keyword map cloud for the CMECP.
Table 1 Top 20 high-frequency words in CMECP text.
Combining Fig. 1 and Table 1, we see that “service” and “medical institution” are high-frequency keywords in the policy text, which verifies that the core of the CMECP is providing a combination of medical services and elderly care services. Policies emphasize the important role of medical institutions in improving the quality of life of elderly individuals. The frequent use of the terms “combination” and “elderly care” illustrates policies’ goal of promoting a deep combination of medical care and elderly care resources to satisfy the health and caregiving requirements of elderly individuals. The recurring mention of “community” and “health” suggests that policies place a strong emphasis on boosting the capabilities of integrated medical and elderly care within communities, underscoring the importance of local medical and health services in caring for elderly individuals at the community level. The high-frequency term “state” indicates that policies have national guidance and support. The consistent use of “facilities” and “rehabilitation” underscores the enhancement of elderly care and medical infrastructure, along with a focus on providing rehabilitation services tailored for elderly individuals. At the same time, high-frequency policy terms such as “resources,” “capabilities,” “departments,” and “quality” reveal key focuses on resource allocation, service capacity building, inter-departmental cooperation, and service quality assurance.
In summary, the distribution of high-frequency keywords highlights the core focus of the CMECP, which is to improve service capabilities, integrate resources, promote interdepartmental cooperation, and ensure service quality. Overall, these policies focus on the needs of elderly individuals and aim to achieve the organic integration of medical services and elderly care services. By analyzing these high-frequency keywords, this study can provide support for the effective implementation of policies and provide a reference for identifying and selecting representative typical policies.
Social network analysis
The social network analysis method not only reveals the intrinsic structure of policies but also provides new perspectives for policy evaluation and formulation (Chen and Chen 2017). This method not only visualizes the co-occurrence relationships between words but also reveals the internal connections and hierarchies in the policy text. Therefore, social network analysis can provide a reference for policy evaluation and formulation by revealing the priority of policies and the correlation between policies. The social network is shown in Fig. 2.
Fig. 2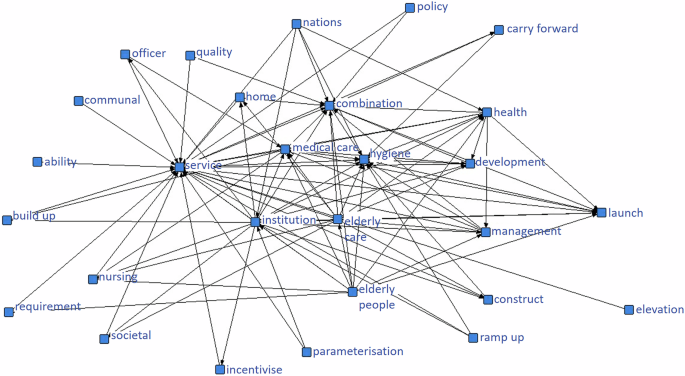
Social network visualization. Reveal the intrinsic connections between high-frequency words.
The results of Fig. 2 show that in the social network of CMECP text, topics such as “pension”, “medical”, “service”, and “nursing” occupy a central position. The strength of the connections between them is high, showing the frequent co-occurrence and interdependence of these concepts in policy texts. The connection between “rehabilitation” and “nursing” points to the extension of medical services in the process of old-age care. Through further analysis of this graph, it can be seen that in the CMECP, strengthening the connection between “medical institutions”, “community elderly care”, and “home elderly care” is necessary. Overall, social network maps provide a powerful tool for policy analysis, supporting in-depth research and policy improvement by revealing the semantic relationships between keywords.
Topic evolution analysis
Based on high-frequency keyword analysis and co-occurrence network analysis, the content of China’s CMECP focus was initially identified. To further explore the temporal evolutionary characteristics of policy themes and to provide a basis for the subsequent establishment of a scientific PMC evaluation system, based on the LDA topic model, this study combines methods such as similarity calculations to construct topic associations between different time series. This study also uses Sankey diagrams to visually present the evolution of themes between different stages of the CMECP. The LDA topic model is a text mining technique based on unsupervised machine learning algorithms. It presents the topic classification of text in the form of probability distributions (DiMaggio et al. 2013). This study uses the LDA topic model to extract latent thematic information from CMECP texts and takes the analysis results as one of the bases for constructing the PMC index model evaluation index system.
In order to achieve the evolutionary relationships between themes at different stages of CMECP. This research first builds upon the three-phase framework proposed in existing research (Dai et al. 2022) (top-level design phase from 2013 to 2015, comprehensive planning phase from 2016 to 2017, and detailed implementation phase from 2018 to the present) and further considers the phased characteristics of policy implementation and major policy adjustment nodes, subdividing the third phase into two sub-phases: the deepening promotion period (2018-2021) and the innovative development period (2022–2024).
Based on the stage division above, the following steps are taken to carry out the thematic mining and analysis of policy texts in this study. First, the policies are segmented by period, and then, the LDA topic model is used to mine the themes of CMECP texts (Schmidt 2008; Xu and Xi 2024). Next, the Log_Perplexity method is used to calculate the perplexity values corresponding to different topics, with the minimum perplexity value ultimately being determined as the optimal number of topics. Through this step, the extraction of themes is achieved, and corresponding keywords for each theme are also obtained. Finally, based on the keywords, different topics are manually described to achieve topic extraction.
After completing topic extraction, this study further conducts similarity calculations and topic evolution analysis on the policy texts (Jelodar et al. 2019). First, the similarity of different dimensional topics is calculated using the TF-IDF model. Based on the similarity calculation results, the relationships and evolutionary patterns between topics in different periods are identified, and a Sankey diagram is drawn to track the changes in topics over time (Bastani et al. 2019), visually demonstrating the inheritance and transformation of the hot spots in the CMECP.
Ultimately, dynamic visualization is achieved through a Sankey diagram, as shown in Fig. 3. The width of the nodes represents the topic probability weight, the connecting lines reflect the strength of topic inheritance, and the colors distinguish the development stages. This step aims to visually present the policy focus of different stages of China’s CMECP.
Fig. 3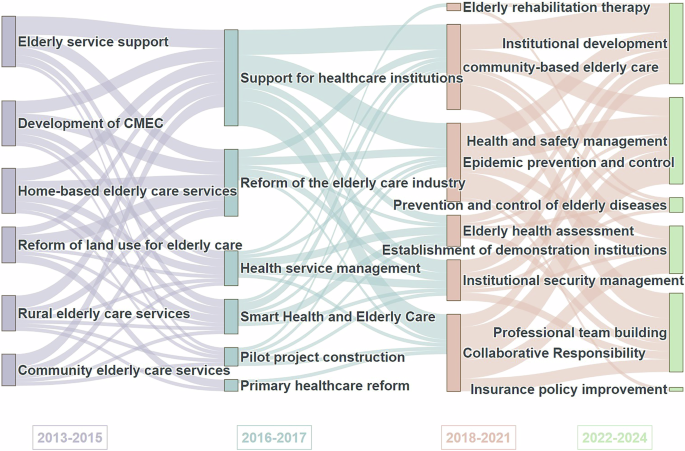
Sankey diagram of the evolution of CMECP text themes.
It can be seen from the Sankey diagram that the policy themes between different stages exhibit distinct phased characteristics and evolutionary patterns. The specific analysis is as follows.
From the top-level design phase of 2013–2015 to the comprehensive planning phase of 2016–2017, the policy themes underwent a noticeable shift. In the initial phase, the focus was on fundamental and inclusive themes such as “reform of elderly care land use” and “community elderly care services,” aiming to address basic issues such as the insufficient supply of elderly care services. In the second phase, the focus shifted to more targeted themes of mechanism innovation, such as “support for medical and elderly care institutions” and “pilot project construction” with an emphasis on exploring integrated medical and elderly care service models. This shift reflects a change in policy-makers’ thinking from macro-level layout to micro-level practice. In the Sankey diagram, the width of the connecting lines between these stages is relatively narrow, indicating a strategic adjustment in policy focus. This evolution reflects the shift in Chinese pension policy development logic from “having” to “being good”.
The evolution from 2016–2017 to 2018–2021 shows characteristics of deepening specialization. The management framework established in the second phase, such as “health service management”, is refined into specialized technical themes such as “elderly health assessment” and “elderly rehabilitation therapy” in the third phase. This transition in the diagram represents the development of service content towards specialization and precision. Notably, newly added themes such as “epidemic prevention and control system” and “smart elderly care” during this phase are highlighted through new nodes in the Sankey diagram, reflecting the dynamic adjustment capability of the policy system.
Entering the policy evolution phase from 2018–2021 to 2022–2024, the Sankey diagram visually demonstrates the significant enhancement of thematic continuity with the densest and thickest connecting lines. This high degree of continuity stems from the increasing maturity of the policy system and the deepening advancement of institutionalization. At the same time, the emergence of new themes, such as “improvement of insurance policies”, demonstrates the trend of innovative policy development. The high similarity in themes between these two stages reflects that after years of exploration, China’s pension policy has formed a relatively stable institutional framework.
The visualization by the Sankey diagram not only intuitively displays the quantitative evolution of policy themes but also profoundly reveals the intrinsic logic of policy development. At the same time, these analytical results lay a solid foundation for the subsequent quantitative evaluation of policies using the PMC index model, providing a reference for establishing a scientific and systematic evaluation framework.
Quantitative evaluation of policies
To deeply understand the development status and policy orientation of the CMECP in China, this study selects the PMC index model to quantitatively evaluate the CMECP. The PMC index model was proposed by (Estrada MAR 2010) on the basis of the Omnia Mobilis hypothesis. This model states that everything is connected, grounded in the principle of the universality of connections. Therefore, it’s crucial to encompass as many pertinent variables as feasible. The advantage of the PMC index model is that it can accurately assess the internal consistency of policies. In addition, the model can also intuitively display the indicators and the overall indicators of the policy through PMC-Surface, to comprehensively evaluate the advantages and disadvantages of the policy (Zhang and Qie 2017; Lu et al. 2022). Based on the above analysis and related studies (Dong et al. 2020), the basic steps of establishing the PMC index model are as follows:
(1)Sample selection. In the preliminary research, this study utilized ROST CM6 software to extract high-frequency keywords from relevant policy texts and to create social network diagrams. Through this analysis process, the core concepts and key issues of the CMECP were successfully identified. At the same time, it clearly reveals the interconnections between different policies and the structural characteristics of the policy system. The analysis of high-frequency keywords and the visualization results of the network diagram are extremely important, providing a solid basis for the subsequent PMC index calculation work. Based on the analysis results above, this study first establishes preliminary criteria for sample selection (Yu et al. 2025), namely, whether a policy reflects core concepts and key issues in high-frequency keyword analysis and network diagrams. According to this standard, 6 policy texts that do not meet the requirements are removed from the original 34 policy texts, initially narrowing the scope of the research sample.
This study aims to further clarify the sample range and retain samples with high reference values as much as possible. Based on previous research, this research integrates various factors to formulate more explicit policy selection criteria. Specifically, this study references the research findings on policy texts from the perspective of policy instruments (Si et al. 2020), the theoretical perspective and practical model of the CMECP (Bao and Xie 2020), and the development history of CMECP (Zhang et al. 2018). Ultimately, clear policy selection criteria are established (see Table 2). Only policy texts that meet the following criteria can be included in the subsequent research sample. This rigorous screening process ensures the scientific validity and representativeness of the selected sample, laying a solid foundation for future research.
Table 2 China’s CMECP selection criteria.
Based on the selection criteria above, we further eliminated 16 policies that did not fully meet these standards. Ultimately, 12 representative policies were retained for analysis, as shown in Table 3. These policies include not only national guidelines but also specific implementation action plans. Through an in-depth analysis of these policies, the decision-making and implementation processes from the macro to micro levels can be comprehensively understood. The policy content ranges from the provision of medical services to the integration of elderly care services, demonstrating how policies promote coordination between different service sectors. In terms of resource allocation, policies reflect efforts to balance resource allocation and market demand, from the coordination of policy resources to the resolution of supply‒demand conflicts. Policy implementation also emphasizes the foundational support and key elements in multiple areas, including the standardization of industry standards and the development of professional teams (Huang et al. 2023). These analyses from a multidimensional perspective ensure that the selected policy samples can comprehensively cover all aspects of the CMECP, thereby providing a solid foundation for in-depth analysis and further optimization of policy implementation.
Table 3 Twelve representative China’s CMECP.
(2)Classification of variables and determination of parameters. Unlike other policy evaluation models, the PMC index model tends to consider all relevant or potentially relevant factors (Kuang et al. 2020). To ensure the scientific and accurate evaluation of indicators, this research establishes 10 first-level variables and 39 s-level variables based on the variable determination method proposed by Estrada (2010). In addition, combining the development characteristics and policy themes of the CMECP, this study constructs an evaluation system for policy texts, as shown in Table 4. To enhance the objectivity of policy evaluation, this study assigns equal weights to all second-level variables and sets the parameter values to binary values of 0 and 1. According to the evaluation system, this study assigns binary values to each second-level variable. If a policy text contains relevant content of the second-level variable, it is assigned a value of “1” for inclusion and “0” otherwise.
Table 4 CMECP evaluation system.
(3) Establishment of a multi-input–output table. In the PMC index model, the multi-input-output table is a tool used for policy analysis. The model evaluates the comprehensiveness and consistency of a policy by breaking it down into variables across multiple dimensions and quantifying these variables. The multi-input-output table typically includes multiple first-level variables and corresponding second-level variables, each representing a specific aspect of policies. Each second-level variable is assigned a binary value indicating whether a policy includes that variable (Gauthier and Landau 1978). Based on the previous research and the peculiarity of China’s CMECP, this study creates a multi-input-output table that uses 10 first-level indicators and 39 second-level indicators from the quantitative indicator system. This step quantifies the key features of the CMECP, providing policy-makers with a tool for assessing the effects of policies and optimizing their structure.
Measurement of the PMC index
According to the conclusion of Estrada (2010), there are four steps in the calculation of the PMC index. First, the aforementioned multi-input-output table is established, and the first-level and second-level variables are placed within it. Second, the table is filled based on the policy content, and the specific values of each indicator for each policy are determined using Formulas (1) and (2). Third, the values of the first-level variables are calculated by Formula (3). Fourth, the PMC index for each policy is calculated using Formula (4).
$$X=\{{PR}:[0 \sim 1]\}$$
(2)
$${X}_{i}=\left[\mathop{\sum }\limits_{j=1}^{n}\frac{{X}_{{ij}}}{n({X}_{{ij}})}\right]$$
(3)
$${PMC}=\mathop{\sum }\limits_{i=1}^{m}(X_{i})=\mathop{\sum }\limits_{j=1}^{m}\left(\mathop{\sum }\limits_{j=1}^{n}\frac{{X}_{{ij}}}{n(X_{{ij}})}\right)$$
(4)
Here, \({i}\) represents the first-level variable, \(j\) represents the second-level variable, \(m\) represents the number of first-level variables, and \(n({X}_{{ij}})\) represents the number of second-level variables under a certain first-level variable.
Based on the multi-input-output table, the results of the PMC index for each CMECP are calculated. In accordance with existing studies (Liu et al. 2022; Xiong et al. 2023; Yimsuk and Thammaboosadee 2024), combined with Estrada’s grading standards for policy evaluation, this study divides the results of the PMC index into the following intervals: consistency is deemed perfect with scores ranging from 10 to 9, good with scores ranging from 8.99 to 7, acceptable with scores ranging 6.99–5, and low with scores of 4.99 or below. The results of the evaluation of the CMECP are shown in Table 5.
Table 5 12 typical policy PMC indexes.
Table 4 reveals that the CMECP garners a favorable overall assessment. More specifically, the average PMC index score for the 12 sampled policies is 6.67. Among these policies, three exhibit good consistency, nine have acceptable consistency, and none are classified as having low consistency. This result indicates that the policy of combining medical care and elderly care has an exhibits a high level of quality in formulation and implementation. This finding confirms that policies have significant effects on promoting service development and improving service quality and efficiency.
Construction of the PMC-surface
The PMC-Surface presents the multi-dimensional data of various policies in a three-dimensional format, allowing for an intuitive display of the differences in each indicator of the policies. The visual representation also highlights the policies’ strengths and weaknesses, aiding in their evaluation and potential enhancement.
According to the evaluation criteria established above, this research selects a total of 10 indicators, one of which \({X}_{10}\) examines whether the policies were publicly released. Since the selected policies are all public, this indicator does not reflect differences between policies and does not affect the evaluation results. Following Estrada’s study (2010), the subsequent PMC matrices for each policy are excluded \({X}_{10}\).
The matrix of the PMC-Surface is calculated by formula (5). The 12 representative PMC-Surface are shown in Fig. 4.
$${PMC}-{Surface}=\left[\begin{array}{ccc}{X}_{1} & {X}_{2} & {X}_{3}\\ {X}_{4} & {X}_{5} & {X}_{6}\\ {X}_{7} & {X}_{8} & {X}_{9}\end{array}\right]$$
(5)
Fig. 4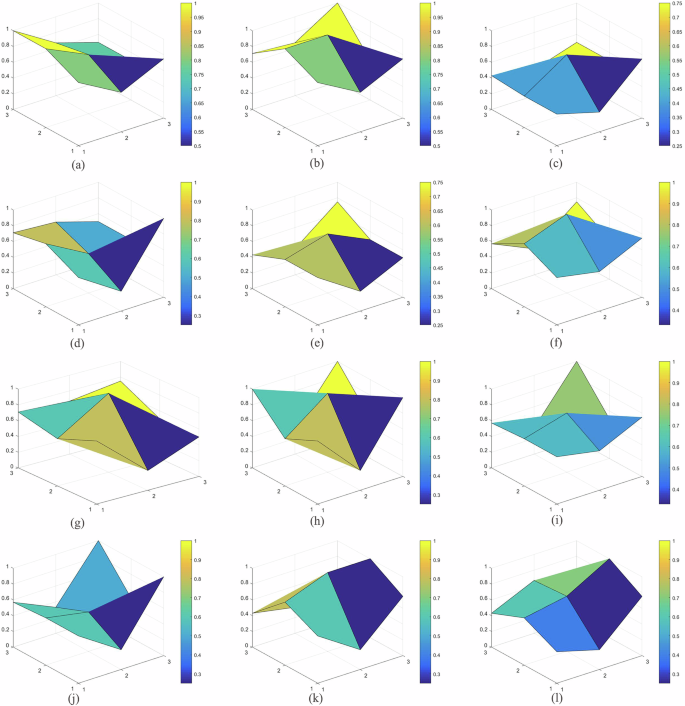
PMC-Surface, where (a–l) represent policies P1-P12, respectively. Demonstrate internal consistency of policies. Produced with MATLAB.
The PMC-Surface above shows that the three policies with the highest PMC index scores, P1, P2, and P8, are located at the upper end of the three-dimensional map with a small depression. These findings indicate that these policies have high comprehensiveness and consistency in the combination of medical and elderly care services, enabling them to more effectively integrate medical and elderly care service resources and provide higher-quality services. Policies P3 and P5 policies rank in the bottom two in the PMC index, and their charts are obviously located in the bottom half of the three-dimensional map with a large degree of concavity, indicating that the comprehensiveness and implementation of the policies need to be further improved and improved. The PMC index scores of policies P6, P7, P9, and P11 are all at a moderate level, with their positions and degrees of depression in the three-dimensional map being relatively centered. These findings indicate that these policies perform reasonably well but still have room for improvement, particularly in terms of optimizing the policy content. Policies P4, P10, and P12 have PMC index scores on the edge of the passing grade, with their graphs near the bottom of the three-dimensional map and significant surface fluctuations, reflecting the poor performance of these policies on a number of key indicators, including content coverage and domain involvement. The PMC index scores of policies P4, P10, and P12 are on the edge of the passing grade, with their positions in the three-dimensional map close to the bottom and significant surface fluctuations, reflecting poor performance on several key indicators such as content coverage and field involvement. Overall, the PMC-Surface above reveals that the 12 policies have certain development potential, but the concave areas of the PMC-Surface also indicate that these policies need further optimization in critical indicators.