Two web-based tools unveiled earlier this month will help identify Dallas County neighborhoods vulnerable to hypertension and diabetes so that health care providers and nonprofits can provide targeted interventions.
The Diabetes Surveillance System and the Hypertension Surveillance System were developed by the Parkland Center for Clinical Innovation, a nonprofit that provides health care analytics. The new dashboards — the result of a partnership with the Dallas County health department — are an extension of a larger project known as the Community Vulnerability Compass.
Diabetes and hypertension affect pockets of Dallas County disproportionately. These dashboards map out an array of data that allow users to connect dots about social circumstances that increase the risk for these diseases in certain neighborhoods.
For instance, the dashboards provide granular information about neighborhoods’ walkability, education levels, obesity rates, access to green spaces and even data on missed medical appointments. The data are anonymized; these pieces of information are not linked to particular people or addresses.
Opinion
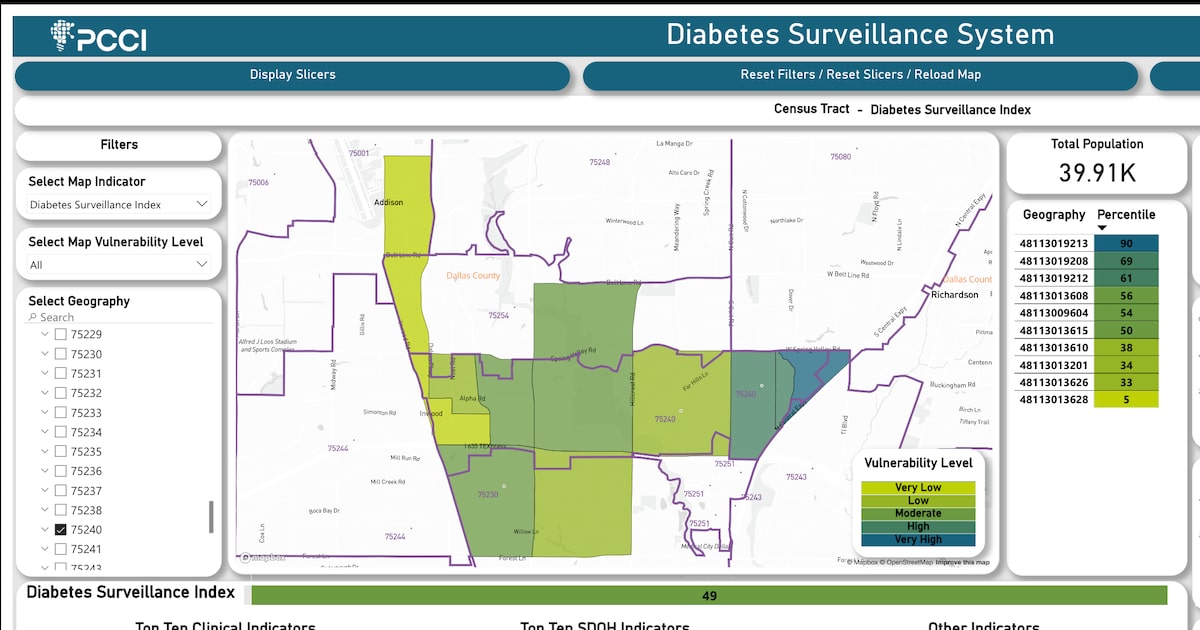
The dashboards are public and fairly easy to use. Darker colors on the county map indicate increased vulnerability to diabetes and hypertension. Users can narrow their searches down to census tracts and see other values that influence that vulnerability.
This information can help health officials or community leaders provide very specific, targeted actions.
Not surprisingly, the web tools show higher vulnerability for diabetes and hypertension in southern Dallas, but the data also show vulnerable neighborhoods in unexpected areas all over the county.
Take ZIP code 75240 in northern Dallas, where the Galleria Dallas mall is located. The diabetes dashboard shows only a moderate risk, but zooming in on census tracts reveals disparities. In the Addison area, there is very low risk of diabetes, but in the eastern part of the ZIP code, near U.S. 75, there is very high risk. Data show a larger number of households without vehicles and a higher number of visits to emergency departments for primary care.
Dr. Steve Miff, PCCI’s president and CEO, said health care providers generally focus on two things: providing one-on-one patient care and creating programs for broad populations of patients. The information gleaned from the dashboards can lead to services or campaigns in between these two approaches, with an emphasis on hyperlocal communities. There are thousands of diabetes patients at Parkland, but they are not the same, Miff added.
An earlier PCCI project has been successful. In 2023, the Pediatric Asthma Surveillance System, another web-based interactive tool, helped Parkland Hospital reduce emergency room visits and patient hospitalizations and raise awareness about the condition at the community level.
These scientific tools are helping policymakers and stakeholders make better decisions. The result will be a healthier Dallas County.