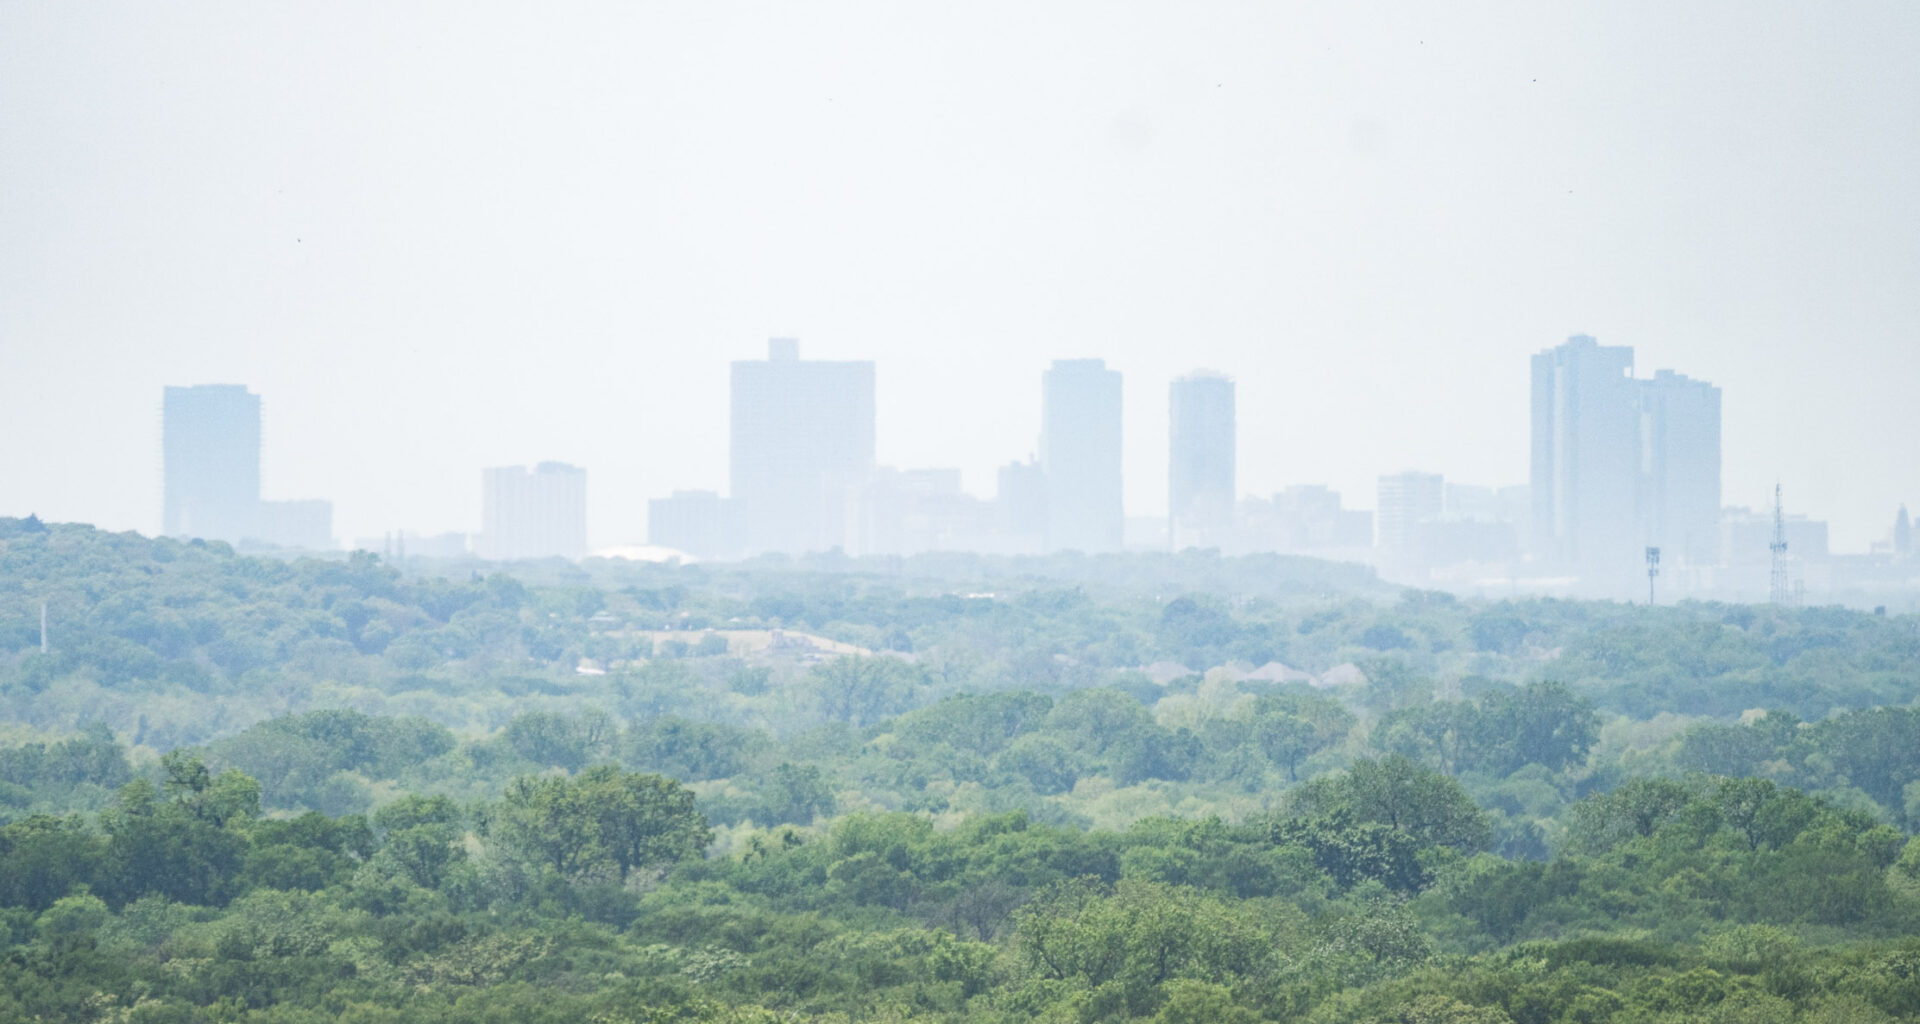
Fort Worth was one of two cities across several North Texas counties with the worst air quality this year, according to preliminary data.
The 2025 design value — the average of the fourth-worst ozone day from each year in a three-year period — of Fort Worth’s ozone was recorded at 83 parts per billion, according to data collected by the North Central Texas Council of Governments. Frisco also hit that value, according to the data, which has not been verified by the Environmental Protection Agency yet.
Ozone or levels of smog tend to peak in Texas between March through November.
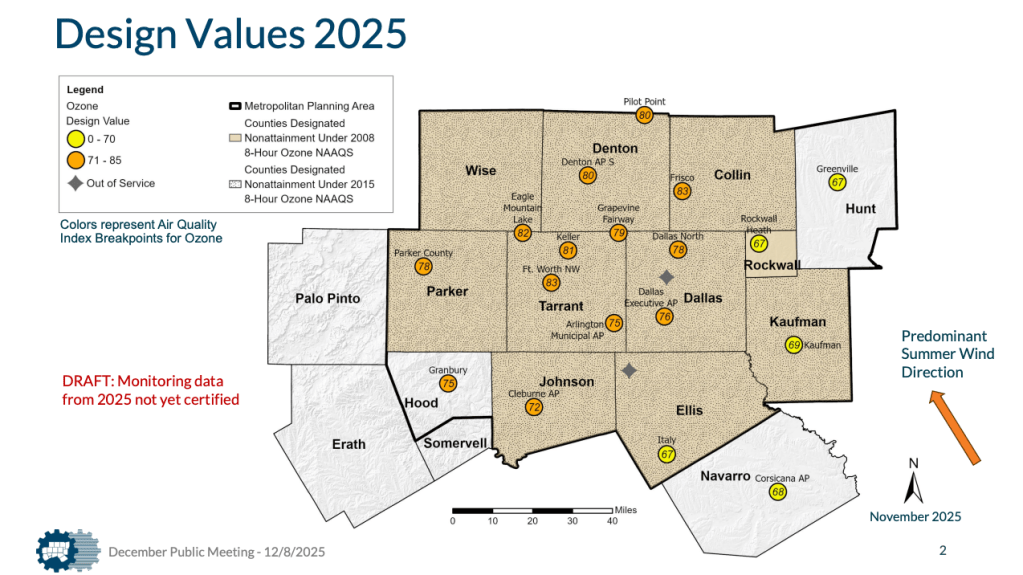 The North Central Texas Council of Governments monitors and oversees air quality planning for 16 counties in the region. (Courtesy image | North Central Texas Council of Governments)
Eagle Mountain Lake and Keller came just under at 82 and 81 parts per billion, respectively, for the season, the data shows.
Ground level ozone forms when nitrogen oxides and volatile organic compounds emitted from natural and human sources react in the presence of sunlight and intense heat, according to the council of governments.
Smog measured between 71 and 85 parts per billion is considered unhealthy for young children, older adults, individuals with respiratory conditions and those who are active outdoors, according to the council of governments.
The federal standard of ozone is capped at 70 parts per billion under the Environmental Protection Agency’s Clean Air Act.
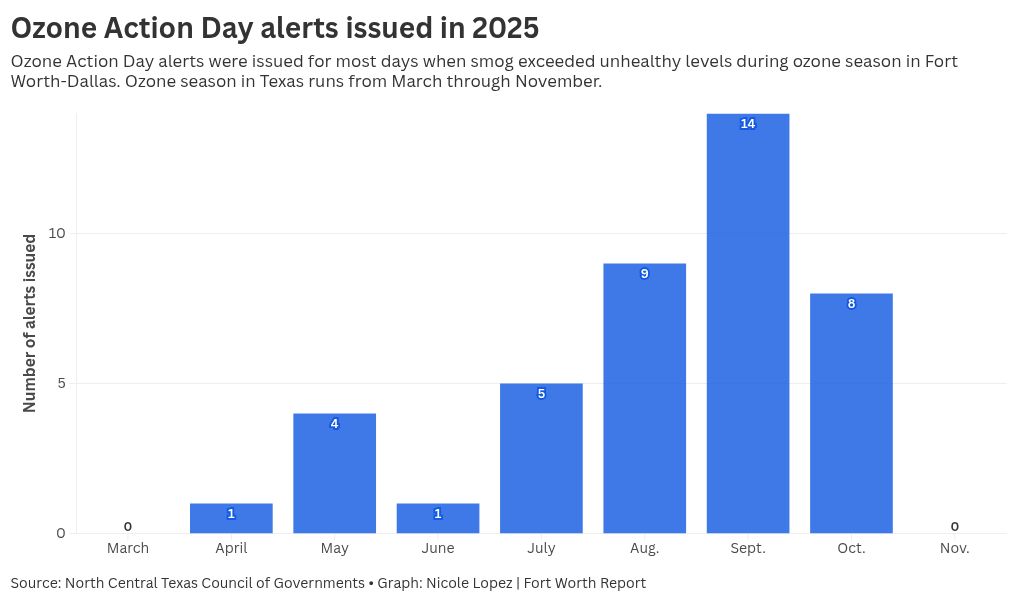
The Dallas-Fort Worth region saw 44 days when ozone exceeded the federal limit, according to data from the council of governments. Forty of those days were measured between 71 and 85 parts per billion. Four of them reached levels between 86 and 105 parts per billion, which is considered unhealthy for everyone.
Fourteen days in September exceeded safe ozone levels in North Texas, more than any other month this year. The region saw its best air quality during the ozone season in April and June, with only one day over the federal limit in each of those months.
Summer winds traveling from the southeast into North Texas contributed to this year’s smog, blowing pollutants into the region, air quality planner Daniela Tower said during a Dec. 8 council of governments presentation.
Weather conditions — such as light wind and a lack of atmospheric movement — can drive unhealthy air quality, Tower previously told the Report.
Exposure to ozone can lead to health effects such as coughing, throat irritation, chest pain and shortness of breath, according to the council of governments. Smog can exacerbate conditions such as bronchitis, emphysema and asthma.
North Texas’ air quality has fluctuated since the early 2000s, Tower told the council Tuesday. It dipped from around 100 parts per billion in 1999 to 76 parts per billion by 2018. Ozone began to slowly rise just after the 2016-2018 three-year design value period.
Which sources lead to ozone formation?
- Point sources such as power plants or refineries
- Area sources such as paints and household products with harmful chemicals
- Motor lawn equipment
- Motor vehicles
- Oil and gas refining
- Natural sources such as wildfires and some vegetation
Dallas-Fort Worth must minimize ozone to 60 parts per billion by the end of next year in order to meet attainment requirements under the EPA’s 2008 ozone standards but that is “reasonably” unlikely, Tower said.
Regional planners are preparing for “consequences,” she said. Major polluters in North Texas — such as power plants, refineries or chemical manufacturers — could face fines up to $45 million under the Clean Air Act.
However, whether they will see fines is uncertain following a flurry of proposed environmental rollbacks under President Donald Trump.
He broke the record for the most executive orders signed on Inauguration Day, with most of them impacting environmental issues such as greenhouse gases, according to ABC News.
More recently, federal officials took to the U.S. Court of Appeals for the D.C. Circuit in November, requesting an elimination of air quality standards on particulate matter produced by vehicle emissions, power plants and factories.
Revoking rules requires lengthy review processes, including public comment, before finalizations can be made, according to the Public Broadcasting Service. Proposed changes to environmental laws are likely to be met with opposition from environmental advocacy groups.
To address the region’s dwindling air quality, the council of governments is working on several initiatives aimed at minimizing pollution. That includes the agency’s Dallas-Fort Worth Air Quality Improvement Plan, a 50-year outlook identifying clean air strategies.
Other initiatives can be found at the council of government’s Air Quality website.
Nicole Lopez is the environment reporter for the Fort Worth Report. Contact her at nicole.lopez@fortworthreport.org.
At the Fort Worth Report, news decisions are made independently of our board members and financial supporters. Read more about our editorial independence policy here.
This <a target=”_blank” href=”https://fortworthreport.org/2025/12/10/worst-air-pollution-in-north-texas-fort-worth-among-top-cities-this-year/”>article</a> first appeared on <a target=”_blank” href=”https://fortworthreport.org”>Fort Worth Report</a> and is republished here under a <a target=”_blank” href=”https://creativecommons.org/licenses/by-nd/4.0/”>Creative Commons Attribution-NoDerivatives 4.0 International License</a>.<img src=”https://i0.wp.com/fortworthreport.org/wp-content/uploads/2021/04/cropped-favicon.png?resize=150%2C150&quality=80&ssl=1″ style=”width:1em;height:1em;margin-left:10px;”>
<img id=”republication-tracker-tool-source” src=”https://fortworthreport.org/?republication-pixel=true&post=323341&ga4=2820184429″ style=”width:1px;height:1px;”><script> PARSELY = { autotrack: false, onload: function() { PARSELY.beacon.trackPageView({ url: “https://fortworthreport.org/2025/12/10/worst-air-pollution-in-north-texas-fort-worth-among-top-cities-this-year/”, urlref: window.location.href }); } } </script> <script id=”parsely-cfg” src=”//cdn.parsely.com/keys/fortworthreport.org/p.js”></script>