The lattice structure of a few-layer TaIrTe4 is shown in Fig. 1a with a mirror plane \({M}_{\hat{{{{\rm{a}}}}}}\). As restricted by symmetry, NLHE is nonzero along the \(\hat{{{{\rm{b}}}}}\)-axis in response to a perpendicular driving current, \({I}^{\omega }={I}_{0}\sin (\omega t)\), with frequency \({{{\rm{\omega }}}}\) along the \(\hat{{{{\rm{a}}}}}\)-axis, while NLHE is expected to be negligible along the \(\hat{{{{\rm{a}}}}}\)-axis19 (See Supplementary Note 1). To accurately determine the crystal orientation of anisotropic two-dimensional (2D) flakes, polarized Raman spectroscopy is employed in a parallel configuration20 (see “Methods”). Figure 1b displays the Raman spectrum for two representative polarization directions with respect to the crystal \(\hat{{{{\rm{a}}}}}\)-axis. The intensity of several modes depends strongly on the polarization direction, especially the modes at 77 \({{{\rm{c}}}}{{{{\rm{m}}}}}^{-1}\), 103 \({{{\rm{c}}}}{{{{\rm{m}}}}}^{-1}\), and 160 \({{{\rm{c}}}}{{{{\rm{m}}}}}^{-1}\), which correspond to the A1 modes of Td-TaIrTe418. Specifically, the polarization direction corresponding to the maximum of the 103 \({{{\rm{c}}}}{{{{\rm{m}}}}}^{-1}\) mode and the minimum of 77 \({{{\rm{c}}}}{{{{\rm{m}}}}}^{-1}\) and 160 \({{{\rm{c}}}}{{{{\rm{m}}}}}^{-1}\) modes is along the \(\hat{{{{\rm{a}}}}}\)-axis of the crystal20, which helps to identify the \(\hat{{{{\rm{a}}}}}\)-axis for Hall bar-shaped devices. Accordingly, high-quality TaIrTe4 Hall bar devices are fabricated with source-drain electrodes along the \(\hat{{{{\rm{a}}}}}\)-axis and encapsulated by hexagonal boron nitride (hBN) (Fig. 1c, see “Methods” for more details). To quantify NLHE, transverse voltage along the \(\hat{{{{\rm{b}}}}}\)-axis \({V}_{{{{\rm{ab}}}}}^{2\omega }\) is measured with the input AC along the \(\hat{{{{\rm{a}}}}}\)-axis \({I}_{{{{\rm{aa}}}}}^{\omega }\).
Fig. 1: Crystal structure and basic characterization of thin film TaIrTe4.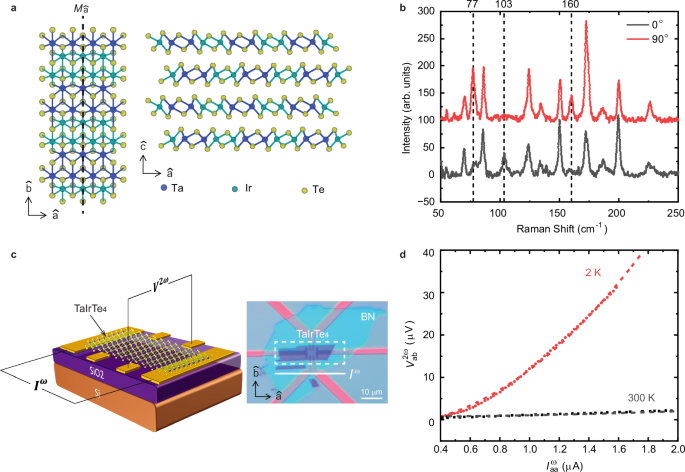
a The lattice structure of TaIrTe4 from the top view (left) and side view (right). The crystalline directions are noted. b Angle-resolved Raman spectra intensity for the hBN-covered few-layer TaIrTe4 measured in a parallel-polarized configuration at stage rotation angles of 0° and 90°, the polarization is parallel with the crystalline \(\hat{{{{\rm{a}}}}}\)-axis and \(\hat{{{{\rm{b}}}}}\)-axis, respectively. c Schematic and optical image of the Hall bar-shaped device to measure NLHE. The second harmonic Hall voltage is maximized along the \(\hat{{{{\rm{b}}}}}\)-axis with alternating driving current along the \(\hat{{{{\rm{a}}}}}\)-axis. Scale bar, 10 µm. d The typical NLH response \({V}_{{{{\rm{ab}}}}}^{2\omega }\) at temperatures of \(T=2\) \({{{\rm{K}}}}\) and \(T=300\) \({{{\rm{K}}}}\). Dashed curves represent quadratic fits to the V–I characteristics.
Unconventional nonlinear conductivity enhancement
Figure 1d shows the nonlinear Hall (NLH) measurements in a six-layer sample at \(T=2\) \({{{\rm{K}}}}\) and \(T=300\) \({{{\rm{K}}}}\). In both cases, \({V}_{{{{\rm{ab}}}}}^{2\omega }\) exhibits a clear quadratic dependence on \({I}_{{{{\rm{aa}}}}}^{\omega }\), but with a striking difference in magnitude. At \(2\) \({{{\rm{K}}}}\), the NLH response is 350 times larger than at room temperature. We quantify this enhancement by extracting the second-order nonlinear conductivity \({\chi }_{\alpha \beta \beta }\) from the nonlinear I-V curves using the relation \({j}_{\beta \alpha }^{2\omega }={\chi }_{\alpha \beta \beta }{E}_{\beta }{E}_{\beta }\), where \({j}_{\beta \alpha }^{2\omega }\) is the second-order current density in the \(\alpha\) direction, driven by the electric field, \({E}_{\beta }\), in the \(\beta\) direction6\(.\) Such observation distinctly differs from the temperature-dependent NLHE in bulk TaIrTe4, where both the nonlinear conductivity and BCD show no significant enhancement at low temperature, other than minor changes due to Fermi level shifts19. Additionally, in the few-layer limit, the absolute value of \({\chi }_{{{{\rm{baa}}}}}\) (\(\sim \! 20\) \({{{\rm{\mu }}}}{{{\rm{m}}}}{{{{\rm{V}}}}}^{-1}{\Omega }^{-1}\)) is significantly boosted by more than five orders of magnitude compared to previous studies on bulk19, suggesting an enhancement mechanism unique to ultrathin TaIrTe₄.
Phase diagram probed by NLHE
To understand the physics of the enhanced NLHE in few-layer TaIrTe4 at low temperature, we conduct systematic temperature-dependent NLH measurements on a 6-layer TaIrTe4, across a wide range of injected current, \({I}_{{{{\rm{aa}}}}}^{\omega }\), as shown in Fig. 2. In particular, \({V}_{{{{\rm{ab}}}}}^{2\omega }\) (Fig. 2a) and the corresponding phase \({\theta }_{{{{\rm{ab}}}}}^{2\omega }\) (Fig. 2b) are probed. \({\theta }_{{{{\rm{ab}}}}}^{2\omega }\) is expected to be \(\pm\)90°, depending on the direction of BCD, based on the expression of the second-order NLH voltage7: \({V}_{{{{\rm{ab}}}}}^{2\omega }={V}_{0}\sin (2\omega t+{\theta }_{{{{\rm{ab}}}}}^{2\omega })\propto {{\pm \left({I}_{{{{\rm{aa}}}}}^{\omega }\right)}^{2}|}_{{{{\rm{AC}}}}}=\frac{1}{2}{I}_{0}^{2}\sin (2\omega t\pm \frac{{{{\rm{\pi }}}}}{2})\). Interestingly, with varying \({I}_{{{{\rm{aa}}}}}^{\omega }\) and temperature, we find two distinct states (marked as state I and state II, respectively) with clear NLH voltage and phase boundaries, separated by a critical temperature, \({T}_{{{{\rm{C}}}}}\) \(\sim 60\) \({{{\rm{K}}}}\) and critical driving current, \({I}_{{{{\rm{C}}}}}\le 20\) \({{{\rm{\mu A}}}}\). Within the dome enclosed by these thresholds (state II), relative to the outer region (state I), \({V}_{{{{\rm{ab}}}}}^{2\omega }\) exhibits two orders’ enhancement and a sign reversal with a 180° phase shift from −90° to 90°.
Fig. 2: Phase transition with enhanced NLHE in few-layer TaIrTe4.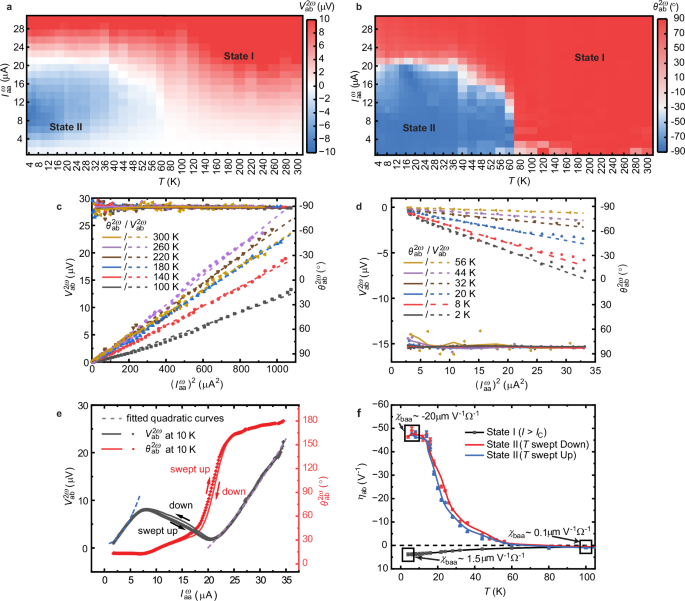
a The 2D map of the NLH voltage \({V}_{{{{\rm{ab}}}}}^{2\omega }\) as a function of temperature and input current. b Corresponding map of the NLH phase \({\theta }_{{{{\rm{ab}}}}}^{2\omega }\). Both maps indicate the onset of state II below 60 K and low driving current below 20 \({{{\rm{\mu }}}}{{{\rm{A}}}}\). Crosscuts of \({V}_{{{{\rm{ab}}}}}^{2\omega }\) and \({\theta }_{{{{\rm{ab}}}}}^{2\omega }\) for state I and state II are shown in c and d respectively. In both panel, dashed lines represent linear fits to the \({V}_{{{{\rm{ab}}}}}^{2\omega }\) data and the solid lines are guides to the \({\theta }_{{{{\rm{ab}}}}}^{2\omega }\) data. Phase transition between state I and state II with hysteresis window, driven by current and temperature independently, are shown in e, f, respectively. In e the dashed curves represent quadratic fits to the V–I characteristics. In f error bars represent the standard error of \({\eta }_{{{{\rm{ab}}}}}\) from quadratic fitting and the dashed line marks \({\eta }_{{{{\rm{ab}}}}}=0\) as a reference for the direction of the NLHE.
In the following, we will take a closer look at each of state and the transition between them. From 300 K to 70 K, TaIrTe4 shows a standard NLH response as the temperature changes. As shown in Fig. 2c, line cuts of \({I}_{{{{\rm{aa}}}}}^{\omega }\) versus \({V}_{{{{\rm{ab}}}}}^{2\omega }\) for 6 different isotherms all show a second-harmonic transverse voltage which scales quadratically with the applied longitudinal current (\({V}_{{{{\rm{ab}}}}}^{2\omega }\propto ({{I}_{{{{\rm{aa}}}}}^{\omega }})^{2}\)), maintaining a −90° phase across the whole current range. The value of the NLH generation efficiency21,22, \({\eta }_{{{{\rm{ab}}}}}=\frac{{V}_{{{{\rm{ab}}}}}^{2\omega }}{{\left({V}_{{{{\rm{aa}}}}}^{\omega }\right)}^{2}}\), shows a gradual shifting from 0.5 to 1 \({{{{\rm{V}}}}}^{-1}\) in this region, which is attributed to the shifting of the chemical potential with temperature. The value of \({\eta }_{{{{\rm{ab}}}}}\) of our few-layer sample in state I is already four orders of magnitude higher than its bulk counterpart, since only the surface of the bulk contributes to NLHE19.
Below 60 K, TaIrTe4 exhibits a distinctly different NLHE, suggesting the formation of state II in the critical region (\(T and \({I}_{{{{\rm{aa}}}}}^{\omega } ). By taking line cuts within this critical region (Fig. 2d), we find that \({V}_{{{{\rm{ab}}}}}^{2\omega }\) maintains a quadratic relationship below 5 µA and is enhanced by two orders of magnitude with respect to room temperature, with a relative shift of \({{{\rm{\pi }}}}\) for \({\theta }_{{{{\rm{ab}}}}}^{2\omega }\) as compared to state I. When \({I}_{{{{\rm{aa}}}}}^{\omega }\) is above 5 µA, the quadratic behavior diverges, suggesting that the large current can destroy state II. This effect is highlighted in Fig. 2e, where \({V}_{{{{\rm{ab}}}}}^{2\omega }\) is measured at 10 K by sweeping \({I}_{{{{\rm{aa}}}}}^{\omega }\). As shown, continuing to increase the \({I}_{{{{\rm{aa}}}}}^{\omega }\) above 20 µA restores the NLH response, where \({V}_{{{{\rm{ab}}}}}^{2\omega }\) scales quadratically with \({I}_{{{{\rm{aa}}}}}^{\omega }\) with \({\theta }_{{{{\rm{ab}}}}}^{2\omega }\) flipping back to −90°, the same as state I. This observation implies that the transition between state I and state II can be driven by current. We also show the very slight change of \({{V}_{{{{\rm{ab}}}}}^{2\omega }/\left({I}_{{{{\rm{aa}}}}}^{\omega }\right)}^{2}\) above \({I}_{{{{\rm{C}}}}}\) over the whole temperature region from 300 K to 2 K (See Supplementary Note 2) and the linear resistance behavior across the entire temperature range, which is consistent with Fermi-liquid theory for currents exceeding \({I}_{{{{\rm{C}}}}}\) (See Supplementary Note 3). Both observations consolidate that TaIrTe4 has fully transitioned to state I above \({I}_{{{{\rm{C}}}}}\) and there is a uniform state—state I—outside the critical region, where TaIrTe4 displays normal NLH behavior with moderate strength, as corroborated in other studies7,8,19. The 2D maps of the NLHE also suggest that the transition between state I and state II can be driven by either temperature or incident current, where the Joule heating effect induced by current has been excluded (See Supplementary Note 4). A possible mechanism for this current-induced phase transition could be the depinning of charge order induced by current as discussed in Supplementary Note 5.
First-order phase transition driven by current and temperature
Moreover, we observe a hysteresis of NLHE when sweeping either the current or temperature. In Fig. 2e, NLH response is measured at 10 K by sweeping \({I}_{{{{\rm{aa}}}}}^{\omega }\). During the transition between the two states, hysteresis windows between 7 µA and 20 µA are observed in both the NLH voltage \({V}_{{{{\rm{ab}}}}}^{2\omega }\) and phase \({\theta }_{{{{\rm{ab}}}}}^{2\omega }\), plotted in black and red respectively. Similarly, in Fig. 2f, a thermal hysteresis window, approximately 5 K wide, is also observed in \({\eta }_{{{{\rm{ab}}}}}\) during the temperature sweeps across state I and state II, when measured at small driving currents (6, suggesting that the formation of state II undergoes a first-order transition.
To further elucidate the NLH response across the transition, we compare the behavior of \({\eta }_{{{{\rm{ab}}}}}\) under different current amplitudes. Under large driving currents (>20 µA), \({\eta }_{{{{\rm{ab}}}}}\) evolves smoothly from 100 K to 2 K, without a clear turning point (black line in Fig. 2f), indicating a gradual change contributed to the chemical potential shift. In contrast, at small driving currents, \({\eta }_{{{{\rm{ab}}}}}\) dramatically increases from approximately 0.7 \({{{{\rm{V}}}}}^{-1}\) at 100 K to about 50 \({{{{\rm{V}}}}}^{-1}\) below 10 K, with a distinct turning point near 60 K. This is about a 2-orders-of-magnitude enhancement of NLHE, primarily arising from a BCD increase induced by the phase transition, as confirmed by the scaling law analysis (See Supplementary Note 7). The corresponding nonlinear conductivity at low temperature is enhanced to 20 \({{{\rm{\mu }}}}{{{\rm{m}}}}\) \({{{{\rm{V}}}}}^{-1}{\Omega }^{-1}\), which is the highest value reported among existing 2D material systems22,23,24 (See Supplementary Note 8).
Optical features of correlated state II
To investigate the characteristic of state II in few-layer TaIrTe₄, we employ temperature-dependent Raman spectroscopy, a sensitive technique for revealing lattice dynamics and possible collective excitations during phase transitions25,26,27,28. Figure 3a summarizes the temperature-dependent Raman spectra of a typical TaIrTe4 thin film, captured from 55 cm−¹ to 115 cm−¹ between 2 K and 200 K. Above the critical temperature \({T}_{{{{\rm{C}}}}}\), the spectra exhibit one A2 mode near 68 cm−¹ and three A1 modes around 79, 86, and 105 cm−¹, consistent with both room-temperature data and the previous report18. As the temperature drops below \({T}_{{{{\rm{C}}}}}\), a new peak emerges around 83 cm−¹, corresponding to an energy of 10.3 meV, in addition to the existing modes at higher temperatures. The peak position and intensity of this new peak are determined using Voigt fitting, with examples at 5 K, 40 K, and 100 K shown in Fig. 3b. Control fittings using only two peaks for the spectra below \({T}_{{{{\rm{C}}}}}\) exhibit significant deviations from the experimental data, ruling out the possibility that the increase in intensity around 83 cm−¹ is due to the broadening of nearby Raman modes (see Supplementary Fig. 9). To quantify the evolution of this new peak at 83 cm−¹, we plot its integrated intensity as a function of temperature in Fig. 3c, which increases sharply below \({T}_{{{{\rm{C}}}}}\). The temperature dependence of this new peak’s intensity is well-fitted by the mean-field theory (detailed in Supplementary Note 9), as characteristic behavior of amplitude modes in CDW systems, which suggests the state II below 60 K is CDW phase29,30,31. And the energy peak’s energy (~10.3 meV), which is a typical energy for the amplitude mode of a CDW, further supports this interpretation31,32,33,34. The fitting reveals a transition temperature of 60 K, which is consistent with the critical temperature \({T}_{{{{\rm{C}}}}}\) observed in NLHE.
Fig. 3: Optical signature of the phase transition in few-layer TaIrTe4.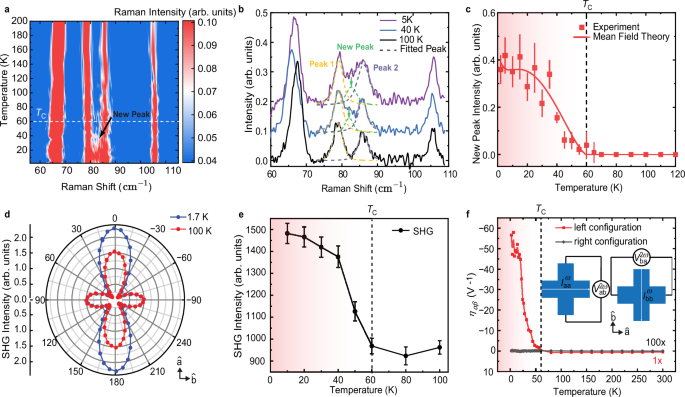
a The Raman spectra of TaIrTe₄ from 55 cm−¹ to 115 cm−¹ at temperatures between 2 K and 200 K. The rising of a new peak at ~83 cm−¹ emerging below 60 K indicates the excitation of the amplitude mode in the CDW phase. b Raman spectra at 5 K, 40 K, and 100 K, with Voigt fitting between 75 and 90 cm−¹. The new peaks at 40 K and 5 K are shown in the green dashed line and highlighted by the green arrow. c The temperature dependence of the new peak’s integrated intensity \({I}_{{{{\rm{A}}}}}\), with the solid line representing the mean-field theory fit, suggests the phase transition temperature at 60 K. Error bars represent the standard error of Raman peak intensities obtained from Voigt fitting. d Polarized SHG patterns of TaIrTe4 at 100 K and 1.7 K with normalized maximum. With normalized peak intensity along the \(\hat{{{{\rm{b}}}}}\)-axis, the intensity along the \(\hat{{{{\rm{a}}}}}\)-axis is greatly enhanced at 1.7 K. e Temperature dependence of the SHG intensity. A significant enhancement of SHG intensity also emerges below 60 K. Error bars represent the standard error of the mean of SHG intensities at each temperature point. f NLH generation efficiency \({\eta }_{\alpha \beta }\) as a function of T from 300 K to 2 K for current applied along the \(\hat{{{{\rm{a}}}}}\)-axis and \(\hat{{{{\rm{b}}}}}\)-axis, respectively (the \(\hat{{{{\rm{b}}}}}\)-axis data are multiplied by 100 times). Inset: two measurement configurations.
To further reveal the symmetry of state II, identified as CDW in Raman measurements, we employ second harmonic generation (SHG) microscopy and angle-resolved transport measurements, both of which are sensitive to the crystal structure’s symmetry35,36,37. We conduct SHG microscopy across different temperatures and compare the SHG polarization pattern of our few-layer TaIrTe4 sample at 100 K (state I) and 1.7 K (state II) (see “Methods” for more details). As shown in Fig. 3d, both SHG patterns show four lobes and two-fold rotation symmetry, which belongs to the Pm space group. However, at 1.7 K, a stronger anisotropy in SHG intensity is observed along the crystalline \(\hat{{{{\rm{a}}}}}\)-axis, which is the Ta atom chain. By fitting both SHG patterns with the nonlinear susceptibility matrix in the Pm space group, we find a significant enhancement of ~25% in the nonlinear optical susceptibility element d11 from state I to state II, while the other elements, such as d12, remain nearly unchanged (See Supplementary Note 10). This suggests that the formation of the CDW state enhances the in-plane anisotropy of the orthorhombic TaIrTe₄ crystal without altering the space group symmetry. Moreover, temperature-dependent SHG intensity shows a notable increase below 60 K, consistent with the onset temperature identified in our NLHE measurements (Fig. 3e). Given the substantially enhanced pattern elongation and nonlinear susceptibility value along the \(\hat{{{{\rm{a}}}}}\)-axis without further symmetry breaking, the CDW state is likely to exhibit a 1D electronic density modulation along the crystalline \(\hat{{{{\rm{a}}}}}\)-axis38,39,40.
The 1D electronic density modulation along the \(\hat{{{{\rm{a}}}}}\)-axis is further supported in the angle-dependent NLHE. We compare temperature-dependent NLH measurements with the current (below 20 \({{{\rm{\mu }}}}{{{\rm{A}}}}\)) along the \(\hat{{{{\rm{a}}}}}\)-axis and the \(\hat{{{{\rm{b}}}}}\)-axis, respectively, in the Hall bar-shaped device, as shown in the inset of Fig. 3f. The strength of the NLHE along the \(\hat{{{{\rm{a}}}}}\)-axis, \({\eta }_{{{{\rm{ab}}}}}\), exhibits a two order of magnitude enhancement from room temperature to 2 K (red plot in Fig. 3f), in contrast to \({\eta }_{{{{\rm{ba}}}}}\) along the \(\hat{{{{\rm{b}}}}}\)-axis, which remains near zero (black plot in Fig. 3f). This enhanced anisotropy in state II is consistent with the result shown in the SHG polarization pattern, underscoring the transition’s 1D character, where electronic ordering occurs predominantly along the \(\hat{{{{\rm{a}}}}}\)-axis, supporting a 1D CDW.
To explain the microscopic origin of the CDW phase and its relationship with BCD and the associated NLHE, we conduct first-principles calculations to model the phase instability and quantify the BCD. (“Methods” and Supplementary Note 11). Firstly, the electronic susceptibility of conduction bands has been calculated, whose value reflects the tendency of electronic instability. Indeed, we find a local electronic susceptibility maximum at a nesting vector of \({\bf {Q}}^{*}=\)(\({0.11,0}\)) \({{{\text{\AA }}}}^{-1}\), suggesting a strong tendency to form a CDW state at low temperature (see Fig. 4a top). In real space, such electronic ordering corresponds to an electron density modulation along the 1D Ta chain (\({\hat{{\rm{a}}}}\)-axis), with a relatively large period of about 15 atomic unit cells (Fig. 4a bottom). This 1D CDW phase scenario as the microscopic origin for state II can well explain the observed anisotropic SHG and angle-resolved transport signatures: the proposed 1D CDW phase does not further break the mirror symmetry (\({M}_{\hat{{{{\rm{a}}}}}}\)) of pristine few-layer TaIrTe4 crystal in the Pm space group but results in larger SHG anisotropy and NLH transport anisotropy with the formation of additional charge ordering along the crystalline \(\hat{{{{\rm{a}}}}}\)-axis. As for the SHG intensity boost, this can be understood by considering the electronic density of state increment for related optical transitions due to the periodic CDW-induced band folding39,40. Taken together, the observed changes in both SHG polarization pattern and intensity are consistent with the formation of a 1D CDW state emerging in few-layer TaIrTe4.
Fig. 4: Theoretical understanding of the phase transition and its impact on Berry curvature dipole in ultrathin TaIrTe4.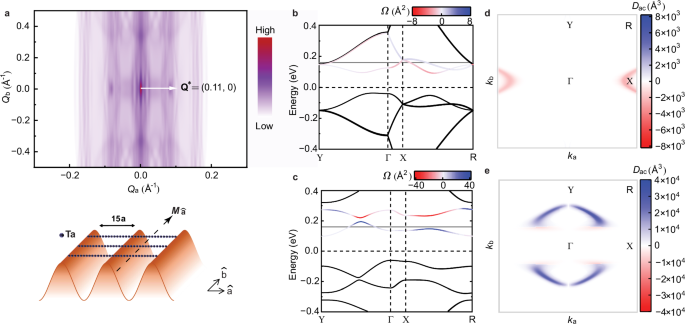
a Calculated electronic susceptibility of the conduction band based on first-principles calculations (top). The white arrow highlights a local maximum of the electronic susceptibility at a wavevector \({\bf {Q}}^{*}\). It corresponds to a superlattice of about 15 unit cells along the one-dimensional Ta chain direction (bottom). Band structures with Berry curvature (\(\varOmega\)) under an electrical field of 0.1 V/nm, b without, and c with superlattice potential with a periodicity of 15 unit cells, show an enhanced Berry curvature near the CDW gap around 0.2 eV. d, e Corresponding momentum-resolved Berry curvature dipole (\({D}_{{{{\rm{ac}}}}}\)) at the energy level of 0.16 eV. Blue and red colors present positive and negative BCD amplitudes indicating that the BCD magnitude in these hotspots increases from \(2\times {10}^{3}\) in state I to \(4\times {10}^{4}\) in state II, representing a 20-fold enhancement.
Given that the 1D CDW phase preserving mirror symmetry \({M}_{\hat{{{{\rm{a}}}}}}\) is highly possible as the origin of state II, we further analyze how this electronic modulation can result in large BCD and corresponding enhanced nonlinear responses. By introducing the 1D superlattice potential into the system, we have calculated both band structure changes and the evolution of the BCD using an 8-band tight-binding model. Comparing Fig. 4b, c, the CDW potential opens a gap between the two lowest conduction bands. In the real case of our multilayer TaIrTe4 device, this band gap is shrunk but still exists. As shown in the color scale, a large Berry curvature, \(\varOmega\), appears near the edges of the band gap. For the BCD distribution calculations, a 0.1 V/nm electric field is employed to break the inversion symmetry and mimic the inversion symmetry breaking in thin-film TaIrTe4. It is noted that in TaIrTe4 films, only the component of BCD, \({D}_{{{{\rm{ac}}}}}\), is nonzero due to the absence of the mirror plane \({M}_{\hat{{{{\rm{b}}}}}}\). Next, we show the momentum resolved BCD maps in Fig. 4d (state I) and 4e (state II) at a chemical potential of 0.16 eV, which corresponds to the experimentally determined Fermi level at \({T}_{{{{\rm{C}}}}}\) extracted from the Hall measurement. As illustrated in two maps, the \({D}_{{{{\rm{ac}}}}}\) hotspots are significantly enhanced by a factor of 20 near the CDW gap and exhibit opposite signs between state I and state II. Both the magnitude enhancement and the sign reversal match our observation in the experimental NLH response. A more comprehensive analysis of the BCD as a function of chemical potential near the band gap, and its relevance to the NLHE enhancement, is provided in Supplementary Note 12.
In summary, our results show that the NLHE can be used as a sensitive probe for detecting correlated phases and constructing rich phase diagrams in topological semimetals. The combination of nonlinear transport and optical measurements points out the formation of a 1D CDW in the few-layer topological semimetal TaIrTe4, which provides a unique material platform to explore the interplay of strongly correlated states and topological properties. Moreover, its recorded-high nonlinear susceptibility at both cryogenic and room temperature also makes it competitive for nonlinear device development, such as energy harvesters and infrared detectors.