Study participants
We analysed data from 1120 clinically diagnosed and 910 prodromal Parkinson’s disease (PD) individuals enrolled in the Parkinson Progression Marker Initiative (PPMI) as of 31 May 2023, a study focused on identifying PD biomarkers and causes [12]. Clinically diagnosed PD patients met standard diagnostic criteria, were in Hoehn and Yahr stages I or II, and showed dopamine transporter deficits on DaTSCAN imaging. For the purposes of this study, we excluded patients who were diagnosed with a non-PD neurodegenerative disorder during the study follow-up such as Multisystem Atrophy (n = 14), Dementia with Lewy Bodies (n = 8), Corticobasal Dementia (n = 2) and Progressive Supranuclear Palsy (n = 3). We did not include individuals with Scans Without Evidence of Dopaminergic Deficit (SWEDD) to avoid the introduction of potential biases [14]. Prodromal cases exhibited hyposmia, REM sleep behaviour disorder (RBD), or had single pathogenic variants in Glucosylceramidase Beta (GBA), Leucine-Rich Repeat Kinase 2 (LRRK2), or Synuclein Alpha (SNCA) genes, all of which are associated with a high risk of progression to PD [15].
All participants underwent comprehensive clinical assessments at baseline and over a 12-year follow-up period. These assessments included evaluations of daily living activities (UPDRS I and II), motor function (UPDRS III), and motor complications due to therapy (UPDRS IV) using the unified Parkinson’s disease rating scale (UPDRS) [16]. Neuropsychological assessments included global cognition (Montreal Cognitive Assessment, MoCA), visuospatial abilities (Benton’s judgment of line orientation test), memory (Hopkins verbal learning test-revised, HVLT‐R), executive functions (semantic fluency; letter and number sequencing test, LNS), attention (symbol digit modalities test, SDMT), depression (Geriatric Depression Scale, GDS), and anxiety (State-Trait Anxiety Inventory, STAI) [17].
Participants were classified into body-first and brain-first phenotypes based on the presence at baseline assessment of RBD and autonomic symptoms using the RBD Questionnaire (RBDSQ) [18] and the Scale for Outcomes in Parkinson’s Disease – Autonomic (SCOPA-AUT) [19]respectively. Participants with a score ≥ 1 standard deviation above the mean of a reference group of 263 healthy controls (Table S1) on either the RBDSQ, the SCOPA-AUT, or both were classified as body-first. Those with scores within the normal range for both scales were classified as brain-first. Additionally, we compared this classification with other classical clinical systems, including tremor-dominant versus non-tremor dominant PD based on the presence or absence of resting tremor [20, 21] and cognitively normal versus PD with mild cognitive impairment (MCI) based on the PD-MCI guidelines of the Movement Disorder Society (MDS) Task Force [22, 23].
The PPMI study was approved by the institutional review boards of all participating sites, and informed consent was obtained from all participants before inclusion in the study.
Imaging analyses
To examine the progression of pathology from bottom-up or top-down brain structures in body-first and brain-first PD, we utilized three imaging modalities: functional magnetic resonance imaging (fMRI), dopaminergic imaging (DaTSCAN), and diffusion-weighted imaging (DWI). According to Braak’s staging system of α-synuclein pathology, early stages (I-II) are characterized by changes in the LC, a critical brain region involved in autonomic functions and sleep, which are typically impaired in body-first PD [6, 24]. The following stages (III-IV) involve α-synuclein aggregates in the striatum, commonly used to assess dopaminergic denervation, which is expected to be more asymmetric in brain-first PD [25]. Finally, the advanced stages (V-VI) are marked by pathological changes in the neocortex, assessable through the glymphatic system, whose activity is linked to sleep waves and may be implicated in body-first PD [26, 27]. Detailed descriptions of the imaging sequences and analyses for each brain region according to Braak’s staging are provided below.
Functional magnetic resonance imaging
To explore propagation patterns in body-first and brain-first PD, we applied a gradient-based functional connectivity analysis to the LC using a pipeline previously described [28]. Resting-state fMRI was conducted on 204 clinical and 202 prodromal PD individuals using a 3 Tesla scanner with the following parameters: echo time = 30 ms, repetition time = 2500 ms, voxel size = 3.3 × 3.3 × 3.3 mm³, matrix size = 64 × 64, field of view = 224 × 224 mm², and flip angle = 80°, with a scan duration of 10 min. T1-weighted scans were also acquired with the following parameters: echo time = 2–6 s, repetition time = 5–11 s, voxel size = 1 × 1 × 1–1.2 mm³, matrix size = 256 × 256, field of view = 256 mm, and flip angle = 9°.
Preprocessing of fMRI scans was performed using the FMRIB Software Library (FSL) [29]. The first five volumes were excluded to achieve steady-state magnetization, and the remaining volumes were corrected for motion using Motion Correction FMRIB’s Linear Image Registration Tool (MCFLIRT) [30]. Non-brain structures were removed with Brain Extraction Tool (BET) [31]and the images were then slice-time corrected, globally normalized, and smoothed with a 3 mm Gaussian kernel constrained to the LC to avoid signal leakage from adjacent brainstem structures or the fourth ventricle. Motion artifacts were addressed using Independent Component Analysis-based Automatic Removal of Motion Artifact (ICA-AROMA) with default non-aggressive cleanup [32, 33]and signals from white matter and cerebrospinal fluid were regressed out. A high-pass temporal filter with a 0.01 Hz cutoff was applied, and images were registered to the standard 2 mm Montreal Neurological Institute 152 (MNI152) template using a two-stage boundary-based registration algorithm.
The LC mask was defined using a recent consensus derived from neuromelanin-sensitive MRI sequences [34]transformed to standard MNI152 space, and downsampled to match the fMRI dataset resolution. LC gradients were extracted using a connectopic mapping approach with the ConnGrads toolbox [35]which involved deriving functional connectivity matrices between LC voxels and cortical brain regions (defined by the Glasser-atlas) [36]. Similarity matrices were constructed with the eta-squared measure and decomposed using the Laplacian eigenmaps algorithm [37] to identify functional gradients, summarized with a trend surface modelling approach [38]. Bayesian linear regression was employed to fit a third-order trend surface model, incorporating coefficients for spatial axes (x, y, z) and their second and third powers [39,40,41]. These coefficients allowed us to assess whether the rostral (superior) or caudal (inferior) parts of the LC exhibited higher or lower connectivity, indicating bottom-up or top-down disease progression patterns.
Dopaminergic imaging
The striatum is a key region in PD, where dopaminergic deficits typically appear in Braak stages III-IV, coinciding with symptom onset and diagnosis. To evaluate dopaminergic deficits, 1120 PD patients underwent dopamine transporter imaging (DaTSCAN) using Single Photon Emission Computed Tomography (SPECT). Imaging preprocessing involved spatial normalization, reconstruction, and attenuation correction to standardize DaTSCAN images [42]. Dopamine transporter binding was quantified by calculating count densities from the caudate and putamen, with the occipital cortex serving as a reference region. The specific binding ratio (SBR) was determined using the formula: SBR = (striatal region count density / occipital count density) − 1. Dopaminergic binding was assessed separately in the more and less affected brain hemispheres, contralateral to the side with more severe motor symptoms since we expected higher asymmetry in brain-first PD [6]. DaTSCANs were not available for prodromal cases, as they are typically performed only in symptomatic individuals.
Diffusion weighted imaging
Alterations in the glymphatic system, which may affect the clearance of toxic proteins like α-synuclein, are linked to neocortical impairment in Braak stages V-VI [43]. We assessed glymphatic system activity in 174 clinical and 68 prodromal PD cases using diffusion-weighted imaging (DWI) with the following parameters: repetition time = 900 ms, echo time = 88 ms, voxel size = 2 × 2 × 2 mm³, flip angle = 90°, 72 slices, 64 gradient directions, b-values of 1000 s/mm² and a non-diffusion weighed reference volume. Preprocessing was performed using FSL, including eddy-current correction, head motion correction, and skull stripping. Five subjects were excluded due to motion-related artifacts.
To quantify glymphatic activity in perivascular spaces (DTI-ALPS), we followed a method described by Taoka et al. [44]. This involved fitting diffusion metric images and generating color-coded fractional anisotropy (colFA) and diffusivity maps (Dx, Dy, Dz) along the x-, y-, and z-axes. Spherical regions of interest (ROI) were placed on colFA maps at the level of the lateral ventricle body, and mean diffusivity values from Dx, Dy, and Dz maps were extracted from these ROIs. The DTI-ALPS index was calculated using specific diffusivity measures: x-axis diffusivities in projection fibers (Dxproj) and association fibers (Dxassoc), as well as y-axis diffusivity in projection fibers (Dyproj) and z-axis diffusivity in association fibers (Dzassoc). A higher value of DTI-ALPS index indicates better levels of glymphatic system function, while a lower value suggests impaired function.
Genetic analyses
To investigate the genetic basis of distinct PD phenotypes, we analysed single nucleotide polymorphisms (SNPs) using whole-blood DNA specimens, following established protocols [45, 46]. No individuals with a recognized genetic mutation for PD was included in the genetic association analysis of SNPs with clinical PD phenotypes. Genotypes associated with PD risk were derived from a large case-control study and a genome-wide association (GWAS) meta-analysis protocol, with all available SNPs being considered in the analyses [45, 46]. Quality control measures excluded subjects with more than 5% missing SNPs and SNPs with a call rate below 85%. Markers were tested for Hardy-Weinberg equilibrium (p
Unsupervised learning analyses
To determine whether the body-first and brain-first phenotypes could be identified without relying on predefined clinical criteria or tests, we used a variational autoencoder (VAE) [47, 48]. A VAE is a deep learning model that compresses input data into a low-dimensional latent space using an encoder and then reconstructs the data as accurately as possible using a decoder. This approach helps reveal patterns in the data without making prior assumptions. For our analysis, we used baseline data available for all subjects, including clinical, glymphatic, and genetic data. In total, we included 205 data points, with 164 used for training and 21 for testing. The VAE’s architecture compressed 11 input features into 2 latent features, which were then used to reconstruct the original data. The VAE architecture compressed 11 input features into 2 latent features, which were then used to reconstruct the original data. The encoder network started with an input layer of 11 neurons (representing the features for each subject), followed by a fully connected layer with 16 neurons, a Rectified Linear Unit (ReLU) activation layer, and a fully connected layer with 4 neurons leading to the latent space. The decoder mirrored the encoder, consisting of two fully connected layers and a linear output layer.
The model was trained using the Evidence Lower Bound (ELBO) loss function over 1000 epochs, with a batch size of 40 and a learning rate of 0.001 to fine-tune its performance. The VAE analyses were conducted using MATLAB version 2023b.
Statistical analyses
Statistical analyses were conducted using R version 4.2.2, adjusting for multiple comparisons with false discovery rate (FDR) corrections (q = 0.05) [49].
Clinical variables
Differences in baseline clinical measures between body-first and brain-first PD, as well as between body-first and brain-first prodromal groups, were assessed using the Wilcoxon rank-sum test (Mann-Whitney U) for continuous variables and the chi-squared test for binary variables. To investigate if individual genetic variants, such as mutations in GBA, LRRK2, PRKN, PINK1 and SNCA genes, are associated with PD phenotypes, we performed logistic regression analyses using PD phenotypes as the outcome and genetic groups as predictors. Age, sex, education, and disease duration (in clinical stages) were included as covariates. Longitudinal trajectories of clinical measures were analysed separately using linear mixed-effect models, including fixed effects for group, time, age, sex, disease duration, and education (for cognitive variables), along with interactions between group and time and random intercepts. We conducted sensitivity analyses classifying body-first and brain-first individuals using only autonomic symptoms, to verify that our results were not only driven by the effect of RBD. We also perform a supplementary set of analyses using as covariates H&Y PD status, the presence of cardiovascular risk factors or diseases, and the use of Clonazepam, a drug that could mask RBD symptoms [50]. Cox regression models, adjusted for age, sex, and education, were used to assess the risk of conversion to PD in body-first and brain-first prodromal subjects, with the time of PD diagnosis as the main outcome. To estimate the risk of conversion to PD dementia of body-first and brain-first PD patients, we used a similar Cox regression model with the time to reach a MoCA inferior to 21 as the main outcome [51]. Additionally, we run Cox models accounting for H&Y PD status (in clinical stages), cardiovascular risk factors, and diseases, also excluding the potential confounding effect due to Clonazepam usage. The proportional hazard assumption was verified using Scaled Schoenfeld’s residuals.
We conducted sensitivity analyses to compare the body-first/brain-first classification with other clinical systems, including tremor-dominant vs. non-tremor-dominant and cognitively normal vs. mild cognitive impairment (MCI). Only for this analysis, we applied classification criteria at each time point to calculate wrong reclassification, defined as a shift to a less severe phenotype (i.e., from MCI to cognitively normal), and reclassifications into a more severe phenotype, considered to reflect disease progression (i.e., from cognitively normal to MCI). The percentage of incorrect reclassifications was calculated for the entire baseline population.
Imaging variables
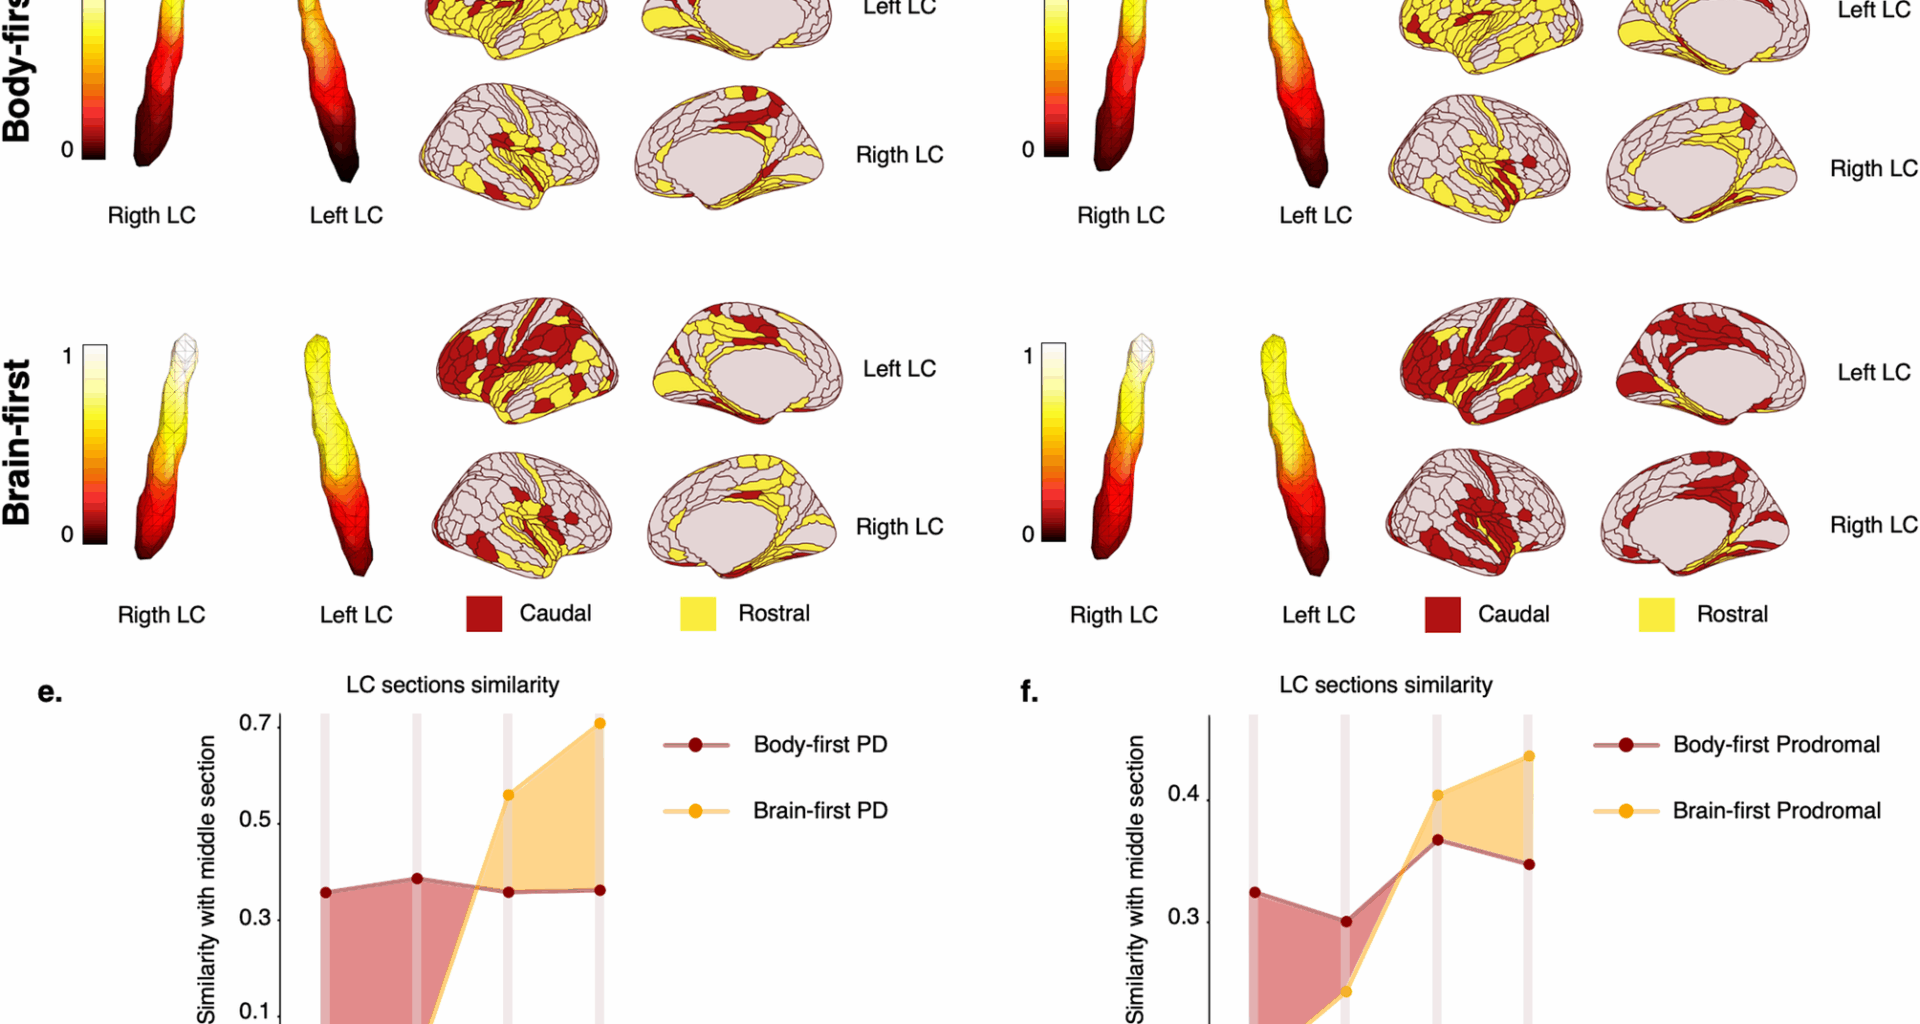
For LC connectivity, we performed a back-projection analysis, calculating Pearson’s correlation coefficients between extreme gradient regions and cortical parcels. Functional connections were thresholded at R = 0.15, and cortical regions were categorized based on their connectivity with rostral or caudal LC parts.
To quantify the similarity with the middle portion of the gradient shown in Fig. 1a, we applied the following procedure. First, we divided the LC into 5 sections (i = 1–5) along the z-axis (from z = 23 to z = 28), where \(\:\text{i}=1\) and \(\:\text{i}=2\) correspond to the caudal part of LC (z = 23–24), \(\:\text{i}=3\) corresponds to the middle LC section (z = 25–26), and \(\:\text{i}=4\) and \(\:\text{i}=5\) to the rostral LC (z = 27–28). After this division, we averaged the connectivity gradient of the voxels within each section. We then computed the difference between each Sect. (2 caudal, 2 rostral) with respect to the middle reference (\(\:\text{i}=3)\). The similarity with the middle section (SMSi) was defined as: \(\:\text{S}\text{M}{\text{S}}_{\text{i}}=\:-1\times\:\:\left|{\text{S}}_{\text{i}}-{\text{S}}_{\text{m}\text{i}\text{d}\text{d}\text{l}\text{e}}\right|\), where \(\:{\text{S}}_{\text{i}}\) is the average connectivity gradient within each caudal/rostral section and \(\:{\text{S}}_{\text{m}\text{i}\text{d}\text{d}\text{l}\text{e}}\) is the average connectivity gradient of the middle section. The resulting values for each section were normalised to a 0–1 scale, where 1 indicates perfect similarity with the middle section and 0 indicates no similarity. A bootstrap-based approach was used to compare functional gradients between groups.
Fig. 1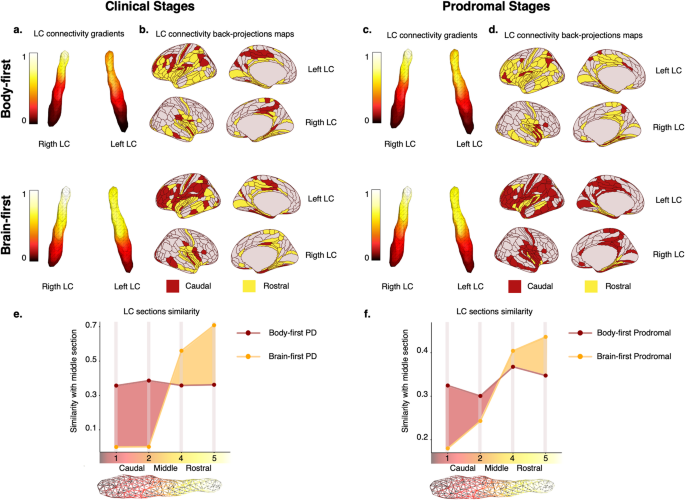
Locus Coeruleus (LC) connectivity gradients in body-first and brain-first clinical and prodromal PD. Significant differences in LC spatial features between body-first (upper row) and brain-first (middle row) Parkinson’s disease (PD). An extension of caudal-like connectivity of the LC (dark red, lower part of the gradient) was found in body-first clinical (a) and prodromal (c) stages, whereas the extension of rostral LC connectivity (yellow, higher part of the gradient) was found in brain-first clinical (b) and prodromal (d) stages. When projecting the LC connections on the cortical surface, body-first cases showed fewer brain areas connected to the caudal LC part (dark red), whereas brain-first had fewer connections to the rostral part (yellow), supporting the distinct progression patterns of LC changes in both clinical (b) and prodromal (d) stages. The similarity plots assess how similar the rostral and caudal parts of the LC were to the middle part in functional connections. It depicts that the caudal part was more similar (dark red shaded area) in body-first clinical (e) and prodromal (f) stages, whereas in brain-first the rostral part was more similar (orange shaded area) both for clinical (e) and prodromal (f) stages. For clarity, e and f do not include the similarity of the middle section (\(\:\text{i}=3\)) with itself
Dopaminergic uptake was analysed using linear mixed models with DaTSCAN striatal values as outcome variables, including group, time, their interaction, and random intercepts, with age, sex, and disease duration as covariates. For glymphatic system analyses, linear mixed models were applied to DTI-ALPS scores in both hemispheres, considering group, time, their interaction, and covariates. A mediation analysis explored whether altered glymphatic scores mediated the relationship between PD phenotype and motor, cognitive, and psychiatric impairments due to previous evidence suggesting the role of glymphatic alterations in the accumulation of toxic substances [26, 27, 43, 52].
Genetic variables
SNP associations with body-first and brain-first PD phenotypes were tested, adjusting for age, and sex. Permutation testing with 5000 iterations controlled the false discovery rate with a threshold of 0.05 for statistical significance. Linear mixed models examined SNP effects on progression in motor, cognitive, and psychiatric domains in prodromal cases, including SNP variant group, time, interaction between group and time, age, sex, and education as fixed effects, along with random intercepts.
Unsupervised learning
The two latent space components derived from the VAE model representing the strongest patterns in the data were compared across different phenotypes. Statistical differences between phenotypes on these latent representations were assessed using Student’s t-test.