Bat collection
A total of 460 bats were captured, and blood samples were collected from 368 individuals (Supplementary Table S6), representing seven families: Craseonycteridae (n = 21, 5.7%), Emballonuridae (n = 63, 17.1%), Hipposideridae (n = 153, 41.6%), Megadermatidae (n = 22, 6.0%), Miniopteridae (n = 1, 0.3%), Rhinolophidae (n = 44, 12.0%), and Vespertilionidae (n = 64, 17.4%), encompassing 17 species. The bat species with the maximal number of blood samples was Hipposideros gentilis (n = 120, 32.6%), followed by Taphozous melanopogon (n = 63, 17.2%) and Myotis siligorensis (n = 61, 16.6%). Species from which only a single sample was collected included Hipposideros armiger, Hipposideros larvatus, Miniopterus magnater, Rhinolophus refulgens, and Myotis ricketti. In terms of sampling locations, a majority of the blood samples were obtained from the Phra Cave (PC; n = 209, 56.8%), followed by the Manow Phee Cave (MPC; n = 75, 20.4%) and the Koh Yao Noi Island (KYI; n = 31, 8.5%). The least number of samples was collected at Kaeng Khoi-Cham Phak Phaeo (KCP; n = 0, 0.0%), followed by Pomelo Farm (PF; n = 1, 0.3%) and the Thiwson Resort (TR; n = 2, 0.5%) (Tables 1 and 2).
Table 2 Detection of trypanosomes in seven bat families from nine sites (including caves and islands) across four provinces in ThailandPrevalence of trypanosomes in bats
Of 368 bats, 40 (10.9%) tested positive for Trypanosoma spp., on the basis of at least one positive PCR result of SSU rRNA or gGAPDH, or through microscopic examination. The highest number of Trypanosoma-positive samples was detected at the Phra Cave (PHC; 21/209, 10.1%), followed by the Darwvading Cave (DC; 7/11, 63.7%) and the Manow Phee Cave (MPC; 7/75, 9.4%). In contrast, the lowest number of infections was observed at the Ma Glue Cave (MGC; 3/16, 18.8%), the Koh Yao Noi Island (KYI; 1/31, 3.3%), and the Koh Kham Island (KKI; 1/14, 7.2%). No Trypanosoma infections were detected at the Thiwson Resort (TR), the Pomelo Farm (PF), or Tham Khao Chong (TKC). Among the bat families examined, Rhinolophidae contributed the greatest number of infected individuals (13/44, 29.5%), followed by Megadermatidae (9/22, 41.0%), and Vespertilionidae (7/64, 10.9%). At the species level, the maximal infection prevalence was observed in Rhinolophus pearsonii (7/9, 77.8%), followed by Hipposideros cineraceus (1/2, 50.0%), Megaderma spasma (9/22, 40.9%), and Rhinolophus thomasi (1/3, 33.3%). Conversely, the lowest was recorded in Hipposideros gentilis (4/120, 3.3%), Hipposideros atrox (1/29, 3.4%), Taphozous melanopogon (5/63, 7.9%), Myotis siligorensis (7/61, 11.5%), and Rhinolophus coelophyllus (5/27, 18.5%). No Trypanosoma infections were detected in eight bat species: Craseonycteris thonglongyai (n = 21), Hipposideros armiger (n = 1), H. larvatus (n = 1), Miniopterus magnater (n = 1), Rhinolophus refulgens (n = 1), R. malayanus (n = 4), Myotis muricola (n = 2), and M. ricketti (n = 1) (Tables 1 and 2).
Molecular detection of Trypanosoma DNA in sand flies
In total, 189 female sand fly specimens, representing 14 species from 13 sites across four provinces in Thailand, were examined for Trypanosoma DNA by PCR amplification of SSU rRNA and gGAPDH genes. Among the specimens analyzed, only a single sand fly, identified as Ph. stantoni collected from the entrance of the Tiger Cave (TGC) in Saraburi Province, tested positive for Trypanosoma. This specimen exhibited a successful amplification of the SSU rRNA (895 bp) and gGAPDH (763 bp) genes, resulting in an overall Trypanosoma infection rate of 0.5% (1/189) in phlebotomine sand flies (Table 3). No Trypanosoma DNA was detected in sand fly specimens collected from the remaining 12 locations in Kanchanaburi, Chachoengsao, and Phatthalung provinces (Table 3), suggesting a low prevalence of trypanosomes in sand flies in these regions. However, detecting Trypanosoma DNA only in a single specimen does not confirm the vectorial competency of sand flies, as no attempts were made to culture and observe parasite development from this specimen.
Table 3 Molecular detection of trypanosomes from 12 confirmed and 2 putative novel species of sand fly collected across 13 locations in four provinces of ThailandIdentification of blood meal source in sand flies
In total, 37 pools (189 specimens) of female sand flies, representing 14 species, were examined for vertebrate blood meal analysis using the mitochondrial COI gene. Among them, 159 (84.1%) were classified as unfed, 29 (15.3%) as gravid, and 1 (0.5%) as engorged. The most commonly identified species were Phlebotomus barguesae (72 individuals, 38.1%), followed by Sergentomyia anodontis (33 individuals, 17.5%) and Sergentomyia spp. 1 (17 individuals, 9.0%). The least frequent were Sergentomyia siamensis and Grassomyia indica, each represented by a single individual (0.5%). A majority of the collected specimens were gravid females, with 11 individuals of Ph. barguesae and 9 for Se. anodontis. However, only one engorged female, Ph. stantoni, was detected. A total of 37 pools, comprising 159 unfed specimens, 29 gravid specimens, and 1 engorged specimen, were analyzed; however, none tested positive for vertebrate blood meals (Table 4).
Table 4 Blood meal analysis of 14 phlebotomine sand fly species based on the vertebrate COI gene
SSU rRNA and gGAPDH phylogeny of trypanosomes from bats and sand flies
A total of 40 trypanosome SSU rRNA sequences (524–560 bp) from bats and 1 from a sand fly, along with 20 gGAPDH sequences (763 bp) from bats and 1 from a sand fly, were obtained and classified into six distinct clades (Figs. 2 and 3). SSU rRNA analysis revealed that seven T. dionisii isolates from bats clustered with global sequences from Brazil, Japan, Mexico, and Thailand, formed a monophyletic clade. This clade included a human-derived Brazilian sequence (KR905444), supported by high statistical values (BI = 1, ML = 99) (Fig. 2a-b). Similarly, gGAPDH analysis revealed that six bat-derived isolates grouped with reference strains from Australia, Brazil, China, Japan, Thailand, and the UK, confirming broad distribution. The analysis also linked T. dionisii to two human isolates (PP438714 and PP555249) from China (Fig. 3a-b).
The T. noyesi clade included 12 bat SSU rRNA sequences, clustering with reference sequences from bats, sand flies, and tabanid flies in Thailand and Australia. For gGAPDH, four sequences grouped with Thai bat T. noyesi, while one (PV239509) formed a distinct basal clade. Phylogenetic analyses (BI = 1, ML = 100) placed Trypanosoma sp. 1 in a distinct clade with anuran trypanosomes. The SSU rRNA sequence from a sand fly clustered with isolates from sand flies and frogs across Canada, Pakistan, Thailand, and the USA. gGAPDH analysis revealed association with diverse hosts (sand flies, frogs, eels, platypuses, panrays) spanning Africa, Canada, Portugal, Australia, Senegal, and Pakistan, demonstrating wide host range and geographic distribution.
Both SSU rRNA and gGAPDH analyses robustly supported (BI = 1, ML = 100) the placement of bat-derived Trypanosoma sp. 2 with an unidentified Thai bat Trypanosoma sp.—four isolates by SSU rRNA and three by gGAPDH. The phylogenetic analysis of bat Trypanosoma sp. 3 using SSU rRNA showed that 12 isolates clustered with unidentified Trypanosoma sp. from bat and T. noyesi from sand flies in Thailand. While gGAPDH analysis grouped seven Trypanosoma sp. 3 isolates with an unidentified Trypanosoma sp. from a Thai bat. Trypanosoma sp. 3 likely represents a sister lineage to T. noyesi, although this is not fully supported by the topology of the phylogenetic tree. Phylogenetic analysis of Trypanosoma sp. 4 from bats was conducted using SSU rRNA and gGAPDH genes, though data availability varied between the two markers. Five Trypanosoma sp. 4 isolates clustered with an unidentified Thai bat Trypanosoma sp. in SSU rRNA, but amplification with gGAPDH was unsuccessful. In addition, the concatenated ML phylogenetic tree, constructed on the basis of SSU rRNA and gGAPDH genes (provided in Supplementary Fig. S1), supported the results of the individual phylogenetic trees for both genes.
Microscopy of the trypanosomes
According to microscopic examination, three blood films were positive for trypanosomes from Rhinolophus pearsonii (THBAT2173, PCR positive) and Hipposideros gentilis (THBAT2203, PCR negative; THBAT23120, PCR positive). Trypomastigotes in Hipposideros gentilis exhibited a consistent C- or U-shaped morphology with a visible nucleus, kinetoplast, flagellum, and undulating membrane (Fig. 2c). In contrast, the nucleus and kinetoplast were not observed in trypomastigotes from Rhinolophus pearsonii.
Fig. 2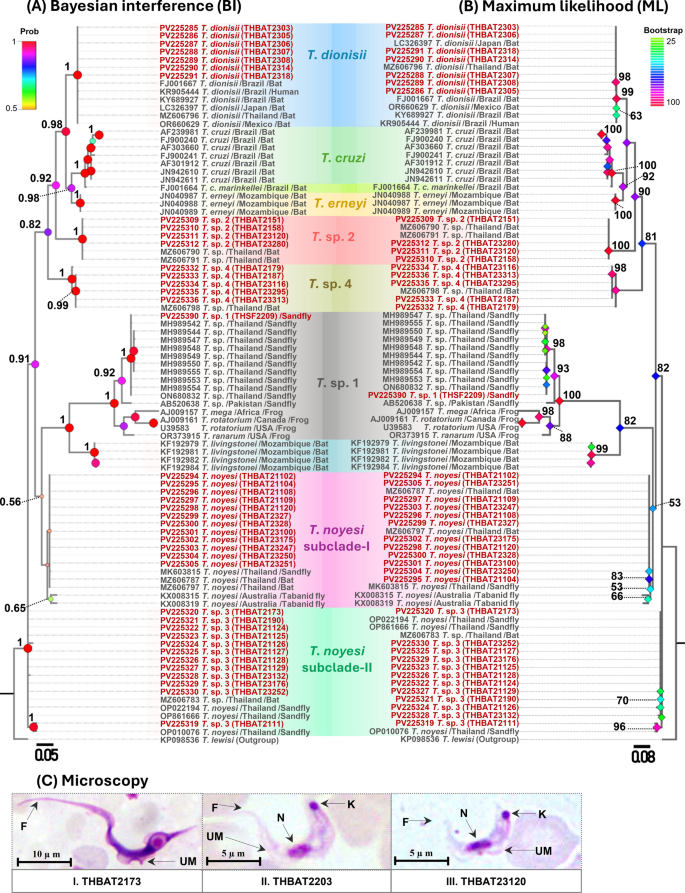
A Bayesian Inference (BI) and B maximum likelihood (ML) phylogenetic trees constructed using SSU rRNA sequences (524–560 bp) of trypanosomes obtained in this study, alongside reference sequences. ML bootstrap values > 50 and BI posterior probabilities > 0.5 are displayed at the nodes. Sequences obtained in this study are highlighted in red. The host and country of origin are indicated after the species names. C Microscopic images of the trypomastigote stages: (I) THBAT2173 from Rhinolophus pearsonii, (II) THBAT2203 from Hipposideros gentilis, and (III) THBAT23120 from Hipposideros gentilis. N, nucleus; K, kinetoplast; F, flagellum; UM, undulating membrane
TCS haplotype network
The TCS haplotype network was constructed using trypanosome SSU rRNA and gGAPDH sequences, obtained from nine bat and one sand fly species. An analysis of 41 SSU rRNA genes identified 10 genetic variants, while 21 gGAPDH genes revealed 13 genetic variants (details including host species are mentioned in Supplementary Fig. S2) (Fig. 3).
Fig. 3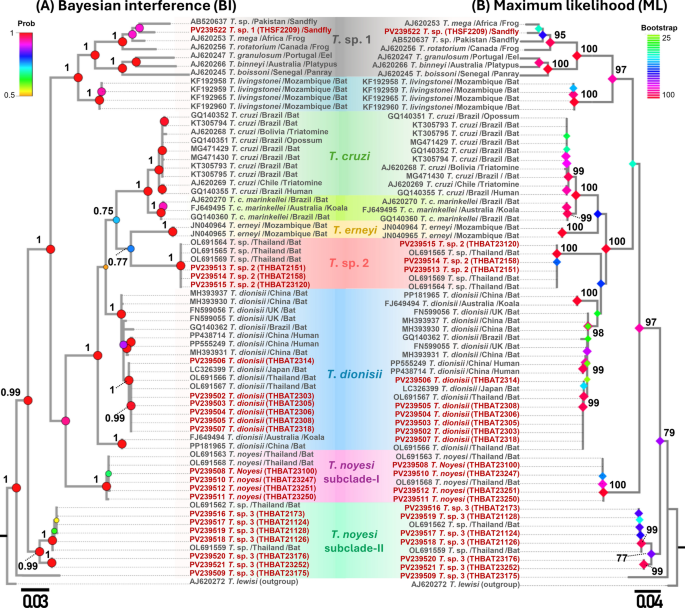
A Bayesian Inference (BI) and B maximum likelihood (ML) phylogenetic trees based on gGAPDH sequences (753 bp) of trypanosomes identified in this study, alongside reference sequences. ML bootstrap values > 50 and BI posterior probabilities > 0.5 are provided at the nodes. Sequences obtained in this study are shown in red. The host and country of origin are indicated after the species names
Comparative pairwise distances of trypanosome SSU rRNA and gGAPDH genes
Concerning SSU rRNA and gGAPDH, most clades exhibited low intraspecific genetic distances (≤ 0.01), indicating a high degree of intraspecific genetic similarity. In contrast, interspecific genetic distances ranged from 0.03 to 0.15 for SSU rRNA and from 0.09 to 0.19 for gGAPDH, with clustering patterns revealing evident genetic divergence between clades. Across both genetic markers, the T. dionisii, T. noyesi (T. noyesi subclade-I and II), T. sp. 1, T. sp. 2, and T. sp. 4 clades exhibited minimal intraspecific genetic variation (≤ 0.01), reinforcing a strong genetic similarity level among sequences within each clade. Moreover, T. noyesi exhibits minimal interspecific genetic variation (0.03–0.04 for SSU rRNA and 0.08–0.10 for gGAPDH), with T. sp. 3, strongly supporting that T. sp. 3 likely represents a sister lineage to T. noyesi (Fig. 4). Notably, the T. sp. 1 clade, derived from sand flies, exhibited substantial interspecific genetic diversity (ranging from 0.11 to 0.15 for SSU rRNA and from 0.14 to 0.19 for gGAPDH) when compared with bat-associated Trypanosoma lineages, suggesting the emergence of a distinct evolutionary descent (Fig. 4).
Fig. 4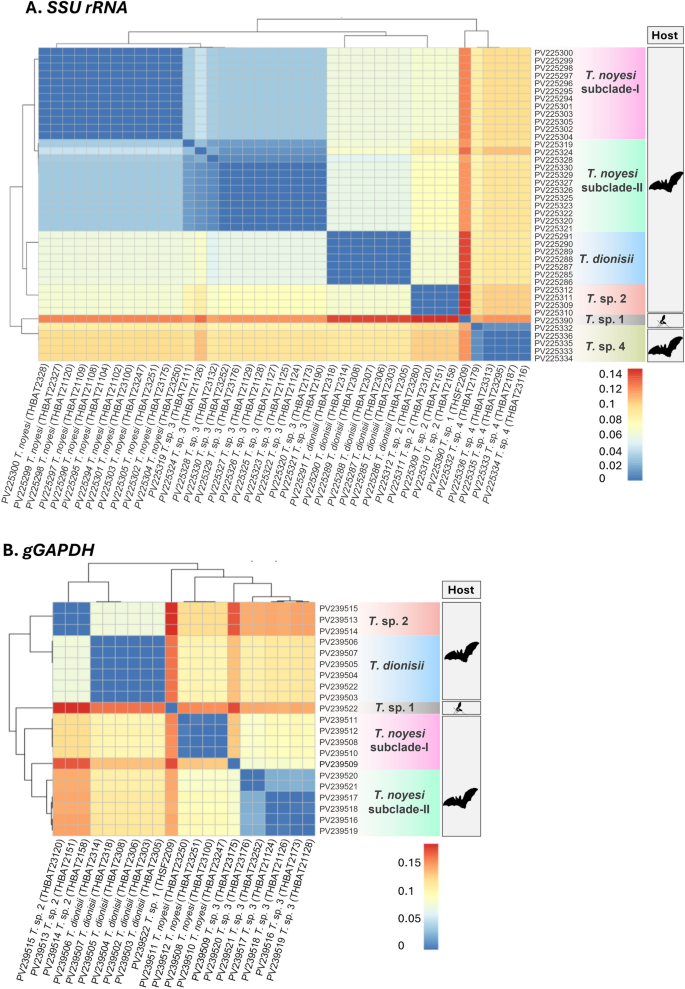
A heatmap of the pairwise genetic distances calculated using the Kimura 2-parameter model (K80) for A SSU rRNA (524–560 bp) and B gGAPDH (753 bp) sequences obtained from bats and phlebotomine sand flies in this study. Color gradients, represented by the scale bars on the right-hand side of each panel, indicate pairwise genetic distances
Putative species delimitation of Trypanosoma spp.
Species delimitation identified seven putative Trypanosoma spp. from bats and phlebotomine sand flies in Thailand (Fig. 5). The sand fly Trypanosoma isolate formed a distinct lineage (T. sp. 1) with strong Bayesian support (1.00), positioned peripherally relative to the bat-associated Trypanosoma clades. Such analysis further recognized four, six, and three isolates of T. noyesi, T. dionisii, and T. sp. 2 as separate species, respectively. Notably, six isolates of T. sp. 3 were classified into two putative species (T. sp. 3a and 3b). Interestingly, a single isolate (THBAT23175) was identified as a separate putative species on the basis of bPTP analysis, despite exhibiting complete genetic similarity (0.00 genetic distance) with T. noyesi based on SSU rRNA. Due to a failed gGAPDH amplification, the T. sp. 4 SSU rRNA sequences were excluded from species delimitation.
Fig. 5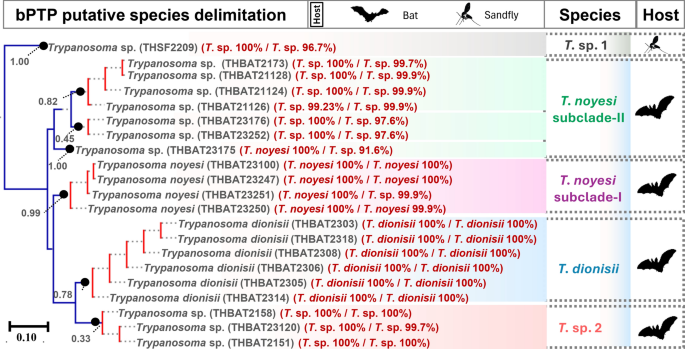
Putative species delimitation of Trypanosoma spp. on the basis of concatenated SSU rRNA (524–560 bp) and gGAPDH (753 bp) sequences (total length: 1277–1313 bp). Monophyletic groups in red indicate single putative species, while terminal branches in blue represent distinct lineages. Numbers at the terminal ends of species names correspond to the sample IDs of the host species