Animals
All animal experiments were approved by the Herbert Wertheim UF Scripps Institute for Biomedical Innovation & Technology Institutional Animal Care and Use Committee (IACUC) as well as by the Comité d’Ethique en Expérimentation animale Val de Loire (C2EA-19; APAFIS #46226-2022022509329925 v6). All experimental procedures were conducted in accordance with guidelines by NIH and the European Communities Council Directive 2010/63/EU. Animal studies are reported in compliance with the ARRIVE guidelines. The Gpr158−/− mice were purchased from KOMP (Gpr158tm1(KOMP)Vlcg) and maintained on a C57/Bl6 background and bred as heterozygous pairs to generate Gpr158−/− and Gpr158+/+ littermates. After weaning, male and females were separately group-housed under standard conditions in a pathogen-free facility on a 12:12 light:dark hour cycle with access to food and water ad libitum. For the chronic variable stress paradigm, wild-type male and female adult (8-week-old) C57Bl/6 J mice (Charles River, Massachusetts) were habituated for one week before experimental manipulation. These mice were single-housed at room temperature (~24 °C) under a 12-h light/dark cycle (07:00-19:00) with ad libitum access to water and food, except during testing.
cDNA constructs
Dopamine D2 receptor (cDNA Resource Center: #DRD0200001), RGS7 (GenBank: AY587875), Gβ5 (GenBank: NM_016194), GαoA (cDNA Resource Center: #GNA0OA0000) in pcDNA3.1(+) were purchased from cDNA Resource Center (https://www.cdna.org). masGRK3ct-Nluc, Venus-156-239-Gβ1, Venus-1-155-Gγ2 were synthesized by GenScript in pcDNA3.1 + . pCMV5 plasmid encoding GαoA was a gift from H. Itoh (Nara Institute of Science and Technology, Japan). GPR158 ectodomain (aa 1-417) was subcloned into a previously described Fc and 6xHis tagged vector32. Nanobody production was done using the pCANTAB vector (phage display) and promising candidates, including Nb20, were subcloned into pET28a. The complete sequence of Nb20 is as follows: MAEVQLQESGGGLVQAGGSLRLSCAASGSIGNIYIMGWYRQTPGPQRELVATIRTVRWTKYEDYADSVKGRFTISDDDAKNTVYLQMNSLKPEDTAVYYCNYKDYNAPSDGYWGQGTQVTVSSEPKTPKPQ. To generate control non-binding nanobody (Nb20*), Nb20 cDNA was mutated to replace 30IGNIYI35 sequence in CDR1 with 30GGAGAG35 sequence and 54RTVRWTKYE62 sequence in CDR2 with 54GAVGGAAAG62 sequence using direct mutagenesis by PCR with 2 sets of primers: CDR1 Forward primer: GCGGCGGTGCTGGCGCTGGCATGGGCTGGTACCGCCAG; CDR1 Reverse primer:
CGCCAGCACCGCCGCTTCCAGAGGCTGCACAGGAGAGTC and CDR2 Forward primer:
CAGCCGCAGCCGCAGCCGCAGCCGACTATGCAGACTCCGTAAAGGGC; CDR2 Reverse primer: CTGCGGCTGCGGCTGCGGCTGCAGTTGCGACCAGCTCGCG.
Chemical and drugs
The following chemicals were used. Dopamine hydrochloride (MilliporeSigma Cat# H8502), Haloperidol (MilliporeSigma Cat# H1512), Dulbecco’s Phosphate-Buffered Saline (PBS) (Gibco Cat#10010-023) with 0.5 mM MgCl2 and 0.1 % glucose, glycine (National Diagnostics # EC-405), Dulbecco’s modified Eagle’s medium (Thermo Fisher Scientific Cat# 11965-092), Fetal bovine serum (Genesee Scientific Cat# 25-550), Sodium pyruvate (Thermo Fisher Scientific Cat# 11360-070), MEM non-essential amino acids (Thermo Fisher Scientific Cat# 11140-050), Penicillin-streptomycin (Thermo Fisher Scientific Cat#15140-122), Matrigel (Corning Cat# 356230), METAFECTENE® PRO (RKP203/RK092820, Biontex Germany), Dulbecco’s phosphate-buffered saline (MilliporeSigma Cat# D5652), PEG6000/2 M NaCl (Teknova #P4168), Nano-Glo luciferase (N113B Promega), Isopropyl β-D- 1-thiogalactopyranoside (IPTG) (Sigma-Aldrich #I6758), Kanamycin (Thermo Fisher Scientific #11815032). The following chemicals were prepared: LEW (50 mM NaH2PO4, 300 mM NaCl, pH adjusted to 8.0 using NaOH), 2xYT (16.0 g/l tryptone, 10 g/l yeast extract, 5 g/l sodium chloride, Final pH 6.8 ± 0.2 at 25 °C, autoclaved).
Llama immunization, phage display
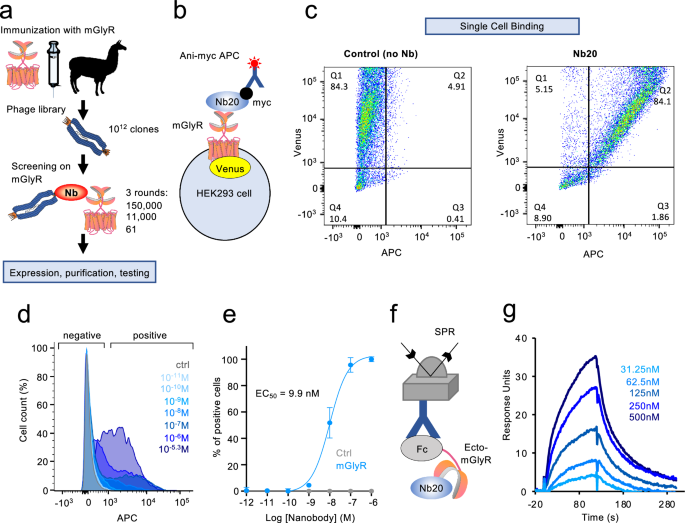
One llama was immunized in strict accordance with good animal practices following the EU animal welfare legislation law with HEK293 cell membrane expressing mGlyR at Eurogentec (Belgium). Blood samples from immunized llama were harvested 87 days after immunization, and RNA from leukocytes was extracted using LeukoLOCK Total RNA Isolation system (Life Technologies #AM1923) accordingly to manufacturer instructions. Reverse transcription was performed on extracted RNA, and cDNA was amplified by PCR using 8 pairs of primers designed to amplify the variable heavy only domains (VHH) of non-conventional IgG2 and IgG3 and introduce NotI and SfiI cleavage sites, respectively (in bold in the following sequence).
Forward primers:
VH_11: GTCGTCGGCCCAGCCGGCCATGGCCGAGGTGCAGCTGGTGGAGTCTGGGGGAGG
VH_12: GTCGTCGGCCCAGCCGGCCATGGCCGAGGTGCAGCTGCAGGMGTCTGGGGGAGG
VH_14: GTCGTCGGCCCAGCCGGCCATGGCCGAGGTGCAGCTGCAGGCGTCTGG
VH_13: GTCGTCGGCCCAGCCGGCCATGGCCGAGGTGCAGCTGCAGGAGTCWGG
Reverse primers
VH_sh: GCTGCTGCGGCCGCGGGGTCTTCGCTGTGGTGCGC
VH_lg: GCTGCTGCGGCCGCTTGTGGTTTTGGTGTCTTGGG
Amplified cDNA was purified and digested with NotI and SfiI, following by ligation into the phagemid vector pCANTAB5 and electroporation of competent E. coli TG1 cells. Bacteria were grown in 2xYT broth containing 2% glucose at 37 °C under agitation until OD600nm reached 0.5. Subsequently, helper phage KM13 (2 × 10¹¹ units) was added for 30 min at 37 °C without agitation. Infected bacteria were pelleted by centrifugation at 4000 g for 20 min at 4 °C, and the pellet was resuspended in 2xYT containing 120 µg/ml ampicillin and 50 µg/ml kanamycin. The phage library was grown overnight at 37 °C with agitation. Phages expressing a nanobody library were harvested and purified by centrifugation at 8000 g for 15 min at 4 °C, supernatant was precipitated using 20% of PEG6000/2.5 M NaCl for 1 h at 4 °C, followed by centrifugation at 8000 g for 15 min at 4 °C and pellet was resuspended in PBS-glycerol 15% and stored at +4 °C.
Nanobody identification via phage library screening
To obtain anti-mGlyR-specific nanobody clones, two steps of depletion were first performed. Library containing 1012 phage units was incubated in the first well of a MaxiSorp plate (ThermoFisher Scientific #441653) coated with 100 µg of HEK293 cell membranes mock-transfected for 1 h at RT, and supernatant was transferred to a second identically coated well for 1 h at RT in order to reduce non-specific binders. A last step of selection was performed using the remaining phages incubated on one well coated with 100 µg of cell membranes expressing mGlyR for 2 h at RT. After washing, bound phages were eluted with Tris 50 mM pH = 8, 1 mM CaCl2, Trypsine 1 µg/ml for 15 min at RT. Eluted phages were recovered and amplified with E. coli TG1 cells infected in 2xYT broth containing ampicillin and 2% glucose overnight at 30 °C with agitation. Next day, 2 × 10⁹ units of helper phage KM13 (AKA VCSM13 Agilent Technologies #2002521) were added to the amplified TG1 cells for 1 h at 37 °C, followed by centrifugation at 3000 g for 10 min at RT. Pellet was resuspended in 2xYT broth containing 100 µg/ml ampicillin and 25 µg/ml kanamycin and incubated overnight at 30 °C with agitation. To separate TG1 cells and amplified phages, the overnight culture was centrifuged at 3000 g for 30 min at 4 °C and phages in the supernatant were precipitated for 30 min on ice using 20% PEG-6000/NaCl 2.5 M, followed by a centrifugation at 10,000 g for 10 min at 4 °C. Pellet was resuspended in PBS with 15% glycerol and stored at −20 °C, and the rest was used in the second round of panning selection as described previously. A total of 3 rounds of panning were performed to identify 61 individual clones. Each clone was produced directly from individual TG1 colonies induced by isopropyl-β−26-D-thiogalactopyranoside (IPTG) for flow cytometry screening.
Protein production and purification
Individual nanobody cDNAs were fused with a c-myc and 8xhis tags at the C-terminus, subcloned into the pET28a vector using the in-fusion HD cloning kit (Takara Bio #102518) and sequenced. Freshly transformed E. coli BL21 DE3 (NEB # C2527H) with pET28a plasmid encoding nanobody was grown at 37 °C, shaking at 220 rpm in Terrific Broth (Kd Medical Inc #501018968) containing 50 µg/ml kanamycin until OD280nm = [0.6–0.8]. Protein expression was then induced by 1 mM Isopropyl β-D-1-thiogalactopyranoside (IPTG), and bacteria were grown overnight at 28 °C with shaking at 220 rpm. Bacteria were collected, centrifuged, and the pellet was lysed by sonication in LEW 1X at 4 °C. Periplasmic solution were harvested after centrifugation at 17,000 g, 30 min, 4 °C and purified on a Ni-IDA column (Macherey Nagel # 745160) according to manufacturer recommendations. Ecto-GPR158-Fc was produced in HEK293FT cells (supernatant) purified (Nickel column) dialyzed/concentrated (Amicon tube 30 kDa). Protein concentration in supernatant was determined using UV spectroscopy (Nanodrop).
Cryo-EM sample preparation and data acquisition
The cryo-EM sample was prepared as described previously26. The protein sample, the purified Nb20-mGlyR-RGS7-Gβ5 complex, was prepared for cryo-electron microscopy (Cryo-EM) imaging. A total of 3.0 µL of the protein sample was applied to glow-discharged 200 mesh gold grids (UltraAufoil R1.2/1.3) inside an FEI Vitrobot Mark IV (Thermo Fischer Scientific). The Vitrobot was maintained at 4 °C with 100% humidity. Prior to blotting, a blot force of 2, a blot time of 2 s, and a wait time of 20 s were applied to remove excess sample. The grids were then plunge-frozen in liquid ethane to preserve their vitrified state.
Cryo-EM imaging of the Nb20-mGlyR-RGS7-Gβ5 protein complex was performed using a 300 kV Titan Krios electron microscope equipped with a Gatan K3 Summit direct electron detection (DED) camera (Gatan, Pleasanton, CA, USA) and a post-column GIF Quantum energy filter operating in counting mode. The microscope was calibrated to a magnification of 105,000, resulting in a nominal pixel size of 0.873 Å. A total of 6689 movies were collected, covering a defocus range of −1.5 to −2.0 µm. The total dose applied was 40 e^−/Å^2, achieved by using a dose rate of approximately 12.5 e^-/s/phys pixel per frame across 40 frames, resulting in a total exposure time of 2.5 s.
Image processing and 3D reconstruction
The mGlyR cryo-EM dataset was processed using56 and cryoSPARC57. The 6689 movies were initially motion-corrected for beam-induced motion using MotionCor258 within RELION. Motion corrected images were then imported into cryoSPARC57, where the patch Contrast transfer function (CTF) estimation tool was used for CTF estimation.
For particle picking, the TOPAZ algorithm, which employs a convolutional neural network algorithm implemented in CryoSparc, was used59. A training set of 1000 micrographs were used to generate a trained model, which was subsequently used for particle picking across the entire dataset, resulting in a total of 3,247,619 particles, which were then extracted from the micrographs with a box size of 340. The extracted particles underwent three rounds of reference-free 2D classification to discard poor-quality particles. The protein particles exhibiting favorable 2D class averages were combined and subjected to several rounds of ab initio and heterogeneous refinement. This iterative refinement process led to the generation of two subsetsone containing 91,859 particles corresponding to the Nb20-mGlyR-RGS complex, and the other consisting of 121,523 particles corresponding to the mGlyR-Nb20 complex. The final resolution of these subsets was estimated to be approximately 3.49 Å and 3.89 Å, respectively, using the gold standard Fourier shell correlation (GSFSC) method within cryoSPARC57. To improve the maps for ECD-Nb20 and TM-RGS7-Gβ5, focused refinement was performed using soft masks (0.001 threshold, 12-pixel padding, 3-pixel dilation) corresponding to each region. This focused refinement approach produced maps at 4.14 Å for ECD-Nb20 and 4.18 Å for TM-RGS7-Gβ5, enabling model building. EM density visualization was done in UCSF Chimera60.
Model building and refinement
The models of mGlyR-Nb20 and Nb20-mGlyR-RGS7-Gβ5 were built based on the previously determined structure of mGlyR (PDB ID: 7SHE and 7SHF) using COOT61. When building the model for mGlyR, the density corresponding to Nb20 was observed, indicating the presence of the bound nanobody. The shape and size of this density were consistent with the bound nanobody. The Nb20 model generated using the AlphaFold method was docked into the cryo-EM map and manually adjusted, built, and refined using COOT61.
The cryo-EM map of Nb20-mGlyR-RGS7-Gβ5 had a final resolution of 3.89 Å. The map exhibited well-resolved density for the transmembrane (TM) domain but relatively low density for RGS7, with the RGS domain missing from the maps. To build the atomic model of the Nb20-mGlyR-RGS7-Gβ5 structure, the mGlyR-Nb20 model generated in this study (from the same dataset) was used as a template. The model was docked into the map using UCSF Chimera and further manually adjusted, built, and refined in COOT.
In the Nb20-mGlyR-RGS7-Gβ5 map, the density for the RGS domain of RGS7 was poorly resolved and fragmented, making it challenging to build a reliable model. The TM domain of both the mGlyR-Nb20 and Nb20-mGlyR-RGS7-Gβ5 models underwent iterative manual building in COOT, followed by real-space refinement in PHENIX62. The Gβ5 and RGS7 regions were not resolved well, and therefore, these regions were docked into the map as rigid bodies. The RGS domain, which is not visible in the map, was not built and remains absent from the final model. Local rotamer fitting and restrained group ADP refinement were also performed. The resulting models were refined against both the unfiltered half maps and sum maps in real space using PHENIX. Structures were visualized, and figures were prepared in UCSF Chimera60, ChimeraX63,64 and PyMOL65. The data collection and refinement statistics are listed in Table 1.
Table 1 Cryo-EM data collection, refinement and validation statisticsCulture and transfection of mammalian cell lines
HEK293FT cells were obtained from ThermoFisher and grown in Dulbecco’s modified Eagle’s medium (DMEM) supplemented with 10% fetal bovine serum (v/v), minimum Eagle’s medium non-essential amino acids, 1 mM sodium pyruvate, and antibiotics (100 units/ml penicillin and 100 mg/ml streptomycin) at 37 °C in a humidified incubator containing 5% CO2. Cells were transiently transfected using Metafectene Pro (Biontex, Germany) in 96 96-well plate following the manufacturer’s instructions.
Cell-based bioluminescence resonance energy transfer (BRET) assays
HEK293FT cells were seeded in a white flat-bottom 96-well plate (Greiner Bio-One) at 50,000 cells per well and transiently transfected using Metafectene Pro with the manufacturer’s instructions. pcDNA3.1 plasmids coding for Dopamine D2R (1), mGlyR (1), RGS7 (1), Gb5 (1), Gao (2), Venus-1-155-Gγ2 (1), Venus 156-239-Gβ1 (1) and masGRK3ct-Nluc (1) were used to transfect cells (ratio in parenthesis). An empty vector (pcDNA3.1(+)) was used in order to normalize the quantity of transfected DNA. 24 h after transfection in DMEM complete medium supplemented with 0.1% of Matrigel (Corning), cells were washed with BRET buffer (Dulbecco’s Phosphate-Buffered Saline (PBS) containing 0.5 mM MgCl2 and 0.1% glucose). Measurements of BRET between Venus-Gβ1γ2 and masGRK3ct-Nluc were performed to monitor the release of free Gβγ dimers after activation of heterotrimers containing Gα subunits in living cells, as described before66. Cells were incubated with 1 µM of Nb20 or with 100 µM of glycine or both when indicated and with the NanoLuc (Nluc) substrate at the manufacturer’s instructions. In order to release Gαo and start deactivation of Gαo, 100 µM of dopamine and 100 µM of haloperidol were injected sequentially and automatically (t = 10 s and t = 25 s) by the plate reader (PHERAstar FSX, BMG Labtech), and dual-luminescence was measured at 475 ± 30 nm and 535 ± 30 nm. The BRET signal was determined by calculating the ratio of the light emitted by the Venus- Gβ1γ2 (535 nm with a 30 nm band path width) over the light emitted by the masGRK3ct-Nluc (475 nm with a 30 nm band path width). The average baseline value (basal BRET ratio) recorded prior to agonist stimulation was subtracted from the experimental BRET signal values, and the resulting difference (netBRET ratio) was normalized against the maximal netBRET value recorded upon agonist stimulation. The rate constants (1/τ) of the deactivation phases were obtained by fitting a one-phase exponential decay curve to the traces with Graphpad Prism 9.0. The kGAP rate constants were determined by subtracting the basal deactivation rate (kapp) from the deactivation rate measured in the presence of exogenous RGS protein.
Flow cytometry
HEK293FT cells were cultured in 6-well plates at a density of 1.106 per well and transfected with 2 µg of cDNA of mGlyR or empty pcDNA3.1+ in control experiments, using Metafectene Pro. 48 h after transfection, cells were mechanically detached by pipetting up and down, washed in PBS supplemented with 0.1% BSA, counted and incubated in PBS-0.1% BSA for 1 h at 4 °C under rotation. Nanobody-20 (Nb20) and 10 µl of anti-myc-APC conjugated antibody (R&d Systems #IC3696A) were added and incubated in the dark with rotation, at 4 °C for 1 h. After 3 washes, cells were analyzed in the LSR-II BD flow cytometer. A gating strategy to sort individual cells from debris and doublets was used as indicated in each figure. Sorted cells were measured for fluorescence in respective channels. Negative control conditions were used to set the positive threshold for APC (mock cells incubated with Nb and anti-myc-APC antibody), and for Venus (mock transfected cells). Acquired data were analyzed using FlowJo software (FlowJo).
Surface plasmon resonance (SPR)
Surface plasmon resonance (SPR) measurements were performed on a Biacore X100 instrument at 25 °C using 1x HBS-EP+ (Cytiva) as a running buffer. A mouse anti-human IgG CH2 monoclonal antibody (Cytiva) was immobilized to a density of ~9500 response units (RU) on a CM5 sensor chip via standard NHS/EDC coupling methods (Cytiva). Subsequently, GPR158-Fc at 10 μg/mL was captured to ~1,800 RU on the active flow cell. A concentration series with two-fold dilutions (500–31.25 nM) of the nanobody Nb20 were injected using a multi-cycle method. The lowest concentration (31.25 nM) was repeated to confirm regeneration of the sensor chip. Biacore X100 Control Software 2.0.1 (Cytiva) was used to collect data, and Biacore X100 Evaluation Software 2.0.1 (Cytiva) was used to analyze data.
Brain slice preparation and whole cell recordings
Electrophysiological recordings from layer II-III neurons of the prelimbic cortex were performed with mice of either sex aged between 4–12 weeks. Mice were anesthetized with isoflurane and decapitated. The brain was quickly removed and rested for 30 s in ice-cold oxygenated solution containing (in mM): 93 NMDG, 2.5 KCl, 1.2 NaH2PO4, 30 NaHCO3, 20 HEPES, 25 glucose, 2 thiourea, 5 Na-ascorbate, 3 Na-pyruvate, 0.5 CaCl2·, 10 MgCl2, (adjusted to 7.3–7.4 pH with HCl). Coronal slices (300 μm thick) were cut on a vibratome (VT1200S, Leica), mounted on a porous membrane and incubated for 12 min at 34 °C in NMDG. Slices were then transferred to a modified HEPES ACSF containing (in mM): 92 NaCl, 2.5 KCl, 2 CaCl2, 2 MgCl2, 1.2 NaH2PO4, 30 NaHCO3, 20 HEPES, 25 glucose, 5 Na-ascorbate, 2 thiourea, 3 Na-pyruvate, (adjusted to 7.3–7.4 pH with NaOH) and allowed to recover for 1 h at room temperature. For recordings, slices were transferred to a submerged recording chamber where they were continuously perfused at 2 ml/min with oxygenated ACSF containing the following (in mM): 126 NaCl, 2.5 KCl, 2 CaCl2, 2 MgCl2, 18 NaHCO3, 1.2 NaH2PO4, 10 glucose, in presence of the following synaptic blockers: picrotoxin (100 µM), strychnine (1 µM), CNQX (20 µM), APV (50 µM). Pipets (3–5 MΩ) were pulled from P-1000 (Sutter Instruments, CA) and filled with an intracellular solution containing the following (in mM): 119 K-MeSO4, 12 KCl, 1 MgCl2, 0.1 CaCl2, 10 HEPES, 1 EGTA, 0.4 Na-GTP, 2 Mg-ATP (280–300 mOsm, pH 7.3 adjusted with KOH). Slices were incubated with Nb-20, Nb-20* (1 µM), or ACSF and changes in neuronal excitability were assessed by counting the number of spikes evoked in response to a 1-s depolarizing ramp ranging from 0 to 200 pA with a 20-s intertrial interval. The Rheobase current was defined as the minimum current necessary to elicit the first AP. Acquisition was done using Clampex 10.7, MultiClamp 700B amplifier and Digidata 1440 A (Molecular Devices, CA). Data were analyzed with Clampfit 10.7.
Mouse studies
No statistical method was used to predetermine sample size. No data were excluded from the analyses. No specific randomization methods were used. Animals were randomly assigned to experimental groups depending on genotype. Experimenters were blinded to the treatment groups.
Drug treatments
Intracerebroventricular (ICV) administration was performed according to a previously described method67. Mice were injected with 5 µl of purified and endotoxin-free nanobody solution in saline (1.92 mg/ml) of nanobody or 5 µl of vehicle. Behavioral evaluation was conducted starting 24 h after treatment over the course of three days. Marble burying was performed in the morning on day one, followed by the elevated plus maze in the evening. Tail suspension was done the next day, and the force swim test was performed on day three. The same sequence and timing of behavioral testing was repeated two weeks after treatment. For the intranasal (IN) administration, 24 h after the last stressor, mice received two treatments on the same day, separated by a 6-h interval. Each treatment involved the application of 10 µl of purified, endotoxin-free nanobody solution in saline (0.95 mg/ml) or racemic ketamine hydrochloride (20 mg/kg; VetaKet; Patterson Veterinary; Cat# 78925834) dissolved in saline, delivering 5 uL to each nostril, using a P-10 pipette.
Stress paradigm
The chronic variable stress (CVS) paradigm consists of daily exposure to one of three stressors over 21 consecutive days. All mice are exposed to one stressor per day, and the three stressors are repeated every three days. The times for each stressor vary from day to day to increase unpredictability. The stressors include restraint stress, where mice are placed in ventilated 50 mL conical tubes for 1 h in the home cage. The next stressor is foot shock, which is performed in shock boxes (6 mice can be simultaneously run). Mice receive 100 mild foot shocks at 0.4 mA for 1 h at random intervals. The final stressor is 30 min of predator odor exposure. 15 uL of TMT (Fisher Scientific; 501844430) is pipetted onto a cotton tip applicator and placed into a clean, empty standard mouse cage. The single housing is also considered an additional stressor on the mice. Termination criteria were used to determine whether mice should continue in the stress paradigm, including bleeding, excessive weight loss (>20% initial), and hunched or moribund phenotypes. Behavior was run 24 h after drug treatment in counterbalanced groups, and animals were numbered to maintain blinding in the manually scored tests. 48 h after the final behavioral test, mice were sacrificed.
Marble burying
Marble burying (MB) was conducted in a standard mouse cage (27 × 16.5 × 12.5 cm) with 5 cm corncob bedding and 20 glass marbles overlaid in a 4 × 5 equidistant arrangement. Background white noise (approximately 70 dB) was used during trials. The mouse was placed in the center of the cage, and testing consisted of a 30 min exploration period. The marbles, at least half-buried at the end of the trial, were counted as buried.
Sucrose splash test
The splash test (ST) was performed using a 10% sucrose solution freshly prepared the day of the test (Sigma-Aldrich; S9378) and was sprayed onto the dorsal coat of the mouse (~0.35 mL per mouse), and placed into an empty, inescapable cylindrical Plexiglas container (121 cm in length and 15 cm in diameter). Mice were habituated to the cylinder for 5 min before spraying with sucrose solution and returning to the container. The behavior of the mouse was recorded for 5 min and later scored manually by blinded observers. The videos were scored for total grooming time. The scores of the observers are averaged to give final values.
Elevated plus maze
The elevated plus maze (EPM) was performed using a black, plexiglass elevated plus maze (apparatus with two open and two enclosed arms, 33 × 6 cm, with a wall of 25 cm on the closed arm, elevated 60 cm from the floor; Med Associates, St. Albans, VT). Lighting for the maze was set at 200 lux in the center of the plus maze, 270 lux on the open arms, and 120 lux on the closed arms. Background white noise (approximately 70 dB) was used during trials. Mice were placed in the center of the elevated plus maze and left to explore for 5 min in a dim light condition. Mice were recorded using Ethovision XT, and the time spent in the open and closed arms, as well as the number of entries from the closed to the open arm, were calculated.
Tail suspension test
The tails of the mice were wrapped with tape that covered approximately 4/5 of the tail length and then fixed upside down on a hook. The immobility time of each mouse was recorded and tracked over a 6 min period using Ethovision XT. Automated tracking values were validated via manual scoring by a blind observer.
Force swim test
The Porsolt Forced Swim Test (FST) was conducted using a vertical clear glass cylinder (10 cm in diameter, 25 cm in height) filled with water (25 °C). The mice spent 6 min in the water, and immobility was scored. A mouse was regarded as immobile when floating motionless or making only those movements necessary to keep its head above the water. Automated tracking values were validated via manual scoring by a blind observer.
Analysis of emotionality score
The behavioral paradigm used to calculate the emotionality score were performed in the following order: MB, ST, EPM, TST and FST. To obtain a comprehensive measure for emotionality, we used z-scoring methodology to integrate standard measures of anxiety-like and depressive-like behaviors, as previously described68. The testing parameters analyzed were as follows: marble burying (number of marbles buried), elevated plus maze (time spent on open arm, number of entries into the open arm), tail suspension test (immobility) and forced swim test (immobility). For each parameter, the z-score for every individual animal was calculated using the previously described approach20. Briefly, for each parameter, the z-score of each individual animal was calculated using the formula \({{{\rm{{Z}}}}}=\frac{X-\mu }{\sigma }\), where X represents the individual data point, m represents the mean of the control group, and s represents the standard deviation of the control group. The emotionality score (ES) for each individual subject was first averaged within test, and then across each test to ensure equal weighting of all tests. \({ES}=\frac{{Z}_{{MB}}+{Z}_{{EPM}}+{Z}_{{TST}}+{Z}_{{FST}}}{{number\; of\; tests}}\). The mean emotionality score for each group is an average of the individual scores within each group for each experiment.
Novelty-suppressed feeding
Novelty-suppressed feeding (NSF) was measured in 24-h food-deprived mice, isolated in a standard housing cage for 30 min before individual testing. Three pellets of ordinary lab chow were placed on a white tissue in the center of each arena, lit at 80 lux. Each mouse was placed in a corner of an arena and allowed to explore for a maximum of 15 min. Latency to feed was measured as the time necessary to bite a food pellet. Immediately after an eating event, the mouse was transferred back to the home cage (free from cage-mates) and allowed to feed on lab chow for 5 min. Food consumption in the home cage was measured.
Novel object recognition
The experiments were conducted in 4 equal square arenas (50 × 50 cm) separated by 35 cm-high opaque gray Plexiglas walls. The light intensity of the room was set at 15 lux to facilitate exploration and minimize anxiety levels. The floor was a white Plexiglas platform (View Point, Lyon, France), spread with sawdust. The room was equipped with an overhead video camera connected to a computerized interface, allowing visualization and recording of behavioral sessions on a computer screen in the adjacent room. The experimental paradigm lasted for 2 days (3, 4). On day 1, the animals were placed in an arena for a 15 min-habituation session with two copies of an unfamiliar object (T-shaped plastic tubing, 1.5 × 3.5 cm). These objects were not used later for the recognition test. On day 2, the recognition test was performed, consisting of 3 trials of 10 min separated by 2 intertrial intervals of 5 min, during which the animals were returned to their home cage. On the first trial, or familiarization phase, the mice were presented with two copies of an unfamiliar object. On the second trial, or place phase, one of the two copies was displaced to a novel location in the arena. On the third trial, or object phase, the copy that had not been moved on the previous trial was replaced by a novel object. Stimuli objects used in all previous experiments were Lego bricks, plastic rings, dice or marbles (size 1.5–3 × 2–3 cm). The identity of the objects, as well as the spatial location in which these objects were positioned, was balanced between subjects. The number of visits and the time spent exploring each object were scored manually on video recordings. A visit was acknowledged when the nose of the mouse came in direct contact with an object. A percentage of discrimination was calculated for the number of visits and time exploring the objects as following: exploration of displaced or novel objects / total exploration. The discrimination ratio during the familiarization phase was arbitrarily calculated for the object located in the right upper corner of the arena.
Open field
Locomotor activity was monitored at 15 lux either in open fields placed over a white Plexiglas infrared-lit platform. Locomotor activity was recorded via an automated tracking system (Ethovision, Noldus, Wageningen, Netherlands).
Rotarod
The apparatus (UgoBasile, Germonio, Italy) was set to accelerate from 4 to 40 rpm in 5 min. On day 1, mice were habituated to rotation on the rod at 4 rpm, until they were able to stay more than 180 s. On day 2, mice were tested for three daily trials (60 s intertrial). Each trial started by placing the mouse on the rod and beginning rotation at a constant 4 rpm-speed for 60 s. Then the accelerating program was launched, and the trial ended for a particular mouse when falling off the rod. Time stayed on the rod was automatically recorded.
Blood collection and corticosterone measurements
Mice were euthanized by rapid decapitation 24 h after treatment with Nb20 or vehicle/PBS (48 h after last stressor). Trunk blood was collected in Eppendorf tubes and allowed to clot for 30 min. Serum was isolated after 2000 g centrifugation and stored at −20 °C. Corticosterone levels were measured using a commercially available ELIZA kit (ThermoFisher #EIACORT) according to the manufacturer’s instructions.
Immunogenicity analysis
Amino acid sequence of nanobodies was analyzed using NetMHCIIpan version 4.0 to predict binding affinities to MHC class II molecules69. The sequence was submitted in FASTA format to the online tool, and binding predictions were generated for a comprehensive panel of MHC class II alleles. Binding strength was categorized based on percentile ranks, with published thresholds identifying strong, weak, and non-binders.
Data analysis and statistics
The functional data shown represent the average ± SEM of at least 3 individual experiments each performed in triplicate and expressed as means ± standard error means (s.e.m). For the GAP assay, cells with the same transfection conditions were compared in their treatment and a two-way ANOVA test was performed. The non-linear regression curve was used to fit the dose-response curve, giving the IC50 value. For the flow cytometry binding assays, cells transfected with an empty vector were used as a control, and the non-linear regression curve was used to fit the dose response curve, giving the EC50 value. For the SPR, calculation of association (kon) and dissociation (koff) rate constants was based on a 1:1 Langmuir binding model. For the mouse experiments, Marble Burying, Splash Test, Tail Suspension, Elevated Plus Maze and Force Swim Test, comparisons were by one-way ANOVA with Dunnett or Kruskal-Wallis post hoc tests. Assumptions of normality and homogeneity of variance were studied using Shapiro–Wilk tests and Levene’s tests, respectively. *P < 0.05; **P < 0.01; ***P < 0.001; ****P < 0.0001. Mean values with s.e.m. are shown. For the ELIZA, a one-way ANOVA test was performed to compare the control treatment with the treated condition. *P < 0.05; **P < 0.01; ***P < 0.001; ****P < 0.0001. Mean values with s.e.m. are shown. For the electrophysiology experiments, changes was assessed in a nonparametric t-test; the Wilcoxon test. Values of *P < 0.05, **P < 0.01 and ***P < 0.001 ***P < 0.0001 were considered to be statistically significant. Calculations, graphs and statistics were generated using GraphPad Prism 9 software (San Diego, CA, USA).
Reporting summary
Further information on research design is available in the Nature Portfolio Reporting Summary linked to this article.