The change of faculties’ highest degrees
Among all the samples, 10,702, 23,735, and 95,113 faculties are only BA holders, MA holders, and PhD holders, respectively, accounting for 8.26%, 18.32%, and 73.42% separately. Around 71.04% of BA holders graduated before 2000, with a tiny proportion after 2010. About 83.78% of MA holders graduated before 2010. The two categories of faculties without Ph.D. degrees are more commonly employed in ordinary universities than elite universities (985 and 211 universities). See Table 1 for the statistics. It is worth noting that before 2000, the proportion of these two types of faculties distributed in 985 and 211 universities was relatively high because many ordinary universities were not established earlier. In earlier times, universities had relatively low requirements for faculties. The proportion of faculties without PhD degrees is relatively high (more evident in ordinary universities), which has decreased significantly over time, and faculties with PhD degrees occupy an absolute advantage. All universities have increasingly strict requirements for newly enroled faculty members, and holding a PhD degree has become a basic standard.
Table 1 Data statistics of the highest degree types.The change in faculties’ academic backgrounds
Focusing on the group holding PhD degrees, this part explores the changing trend in the academic structure of faculties. In the bachelor’s phase, elite universities account for a small proportion, while ordinary universities make up a large part. In contrast, in the master’s and doctorate phases, overseas and elite universities take up the majority (See Fig. 1). This reflects an improvement in academic institutions’ quality and a growing trend toward studying abroad. Notably, the proportion of faculties working in elite universities, especially 985 universities, who studied overseas and at key universities during their academic stages has a significant advantage (particularly in the doctorate phase). Concerning faculties’ institutions during their study phases, from 2000 to 2010, the proportion of overseas and elite universities increased, while the proportion of ordinary universities decreased. Among them, the growth rate of overseas universities during the doctorate phase is the most pronounced. It is evident that, regardless of the university level, the educational structure of faculties has continuously improved.
Fig. 1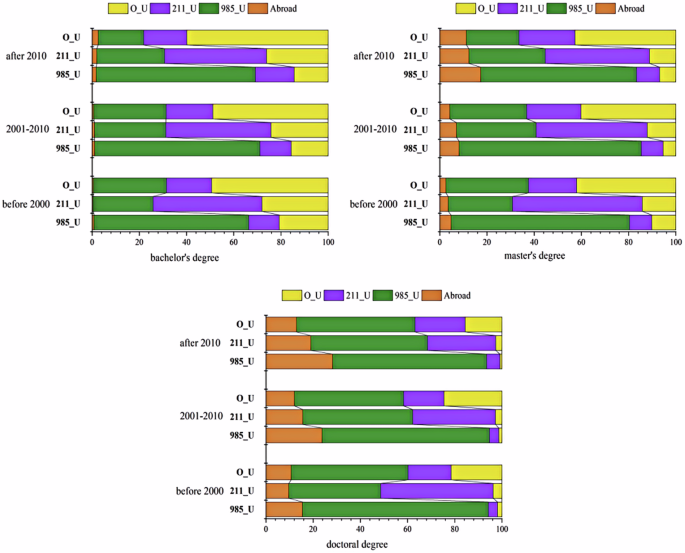
Faculties’ academic backgrounds.
Figure 2 shows that from 1990 to 2022, the rankings of universities where faculties from three categories studied during their study phases have risen. This trend is particularly noticeable among those who work in 985 universities. The recent pattern indicates that faculties employed at 985 universities graduated from higher-ranked universities in each phase of their academic journey. From the last century to now, the ranking of the institutions where faculties pursue their education at all stages has consistently improved.
Fig. 2: Faculties’ university ranking in the study phase.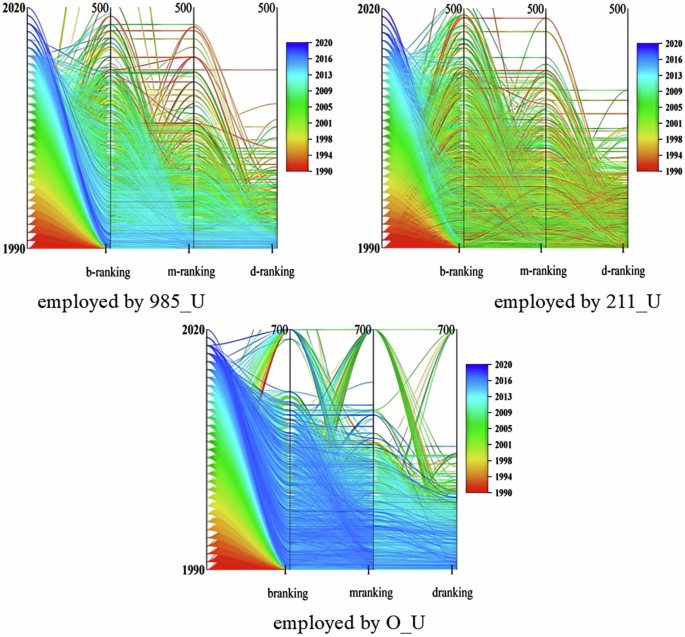
Note: the ranking of institutions where they earned their BA, MA, and PhD degrees. “branking”, “mranking”, and “dranking” represent the ranking of undergraduate, master’s, and doctoral institutions attended by faculties.
The overall trend of the ranking of employed universities
This part shows the changing trend of employed universities’ ranking of PhD holders (grouped according to the year of their doctoral graduation; see the box chart in Fig. 3). It shows that from 1990 to 2022, the ranking number of employed universities of all faculties is rising; that is, the ranking is declining. Besides, we classify faculties into two groups, respectively, that is, studying at home and abroad (adopting the definition of “treat 2” to partition), and present the average and median of the ranking of their employed universities from 1990 to 2022. Overall, the ranking of employed universities, whether studying at home or abroad, has shown a downward trend.
Fig. 3: Ranking of all faculties’ employed universities-a.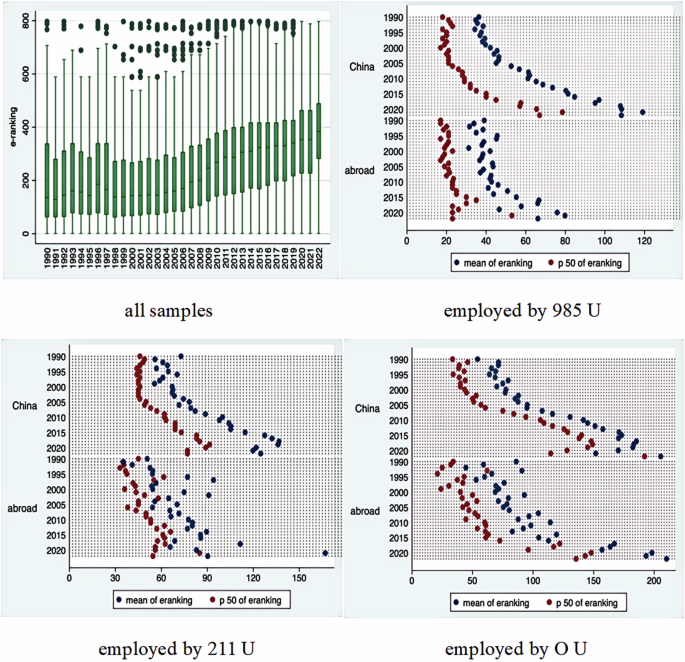
Note: divided into three groups based on being employed by different types of universities (985 university, 211 university, and ordinary university).
Considering the importance of the first degree, this part analyses the ranking of employed universities by categorifying faculties with different undergraduate types to explore the changing trend of faculties’ employed universities of those with the same academic background work overtime (see Fig. 4). Overall, the employed universities’ ranking of those with undergraduate degrees from 985 universities ranks the highest, followed by those from 211 universities, and those from ordinary universities rank the lowest. From the density distribution map from 1990 to 2022, the number of lower-ranked universities has been increasing, and the employed universities’ rankings of all faculties have shown a downward trend of varying degrees.
Fig. 4: Ranking of all faculties’ employed universities-b.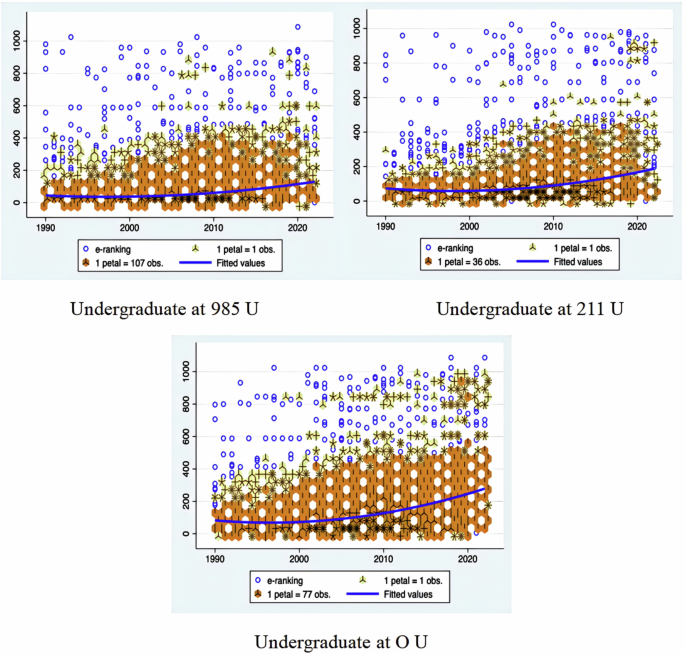
Note: classified three groups based on faculties’ different undergraduate types (985 university, 211 university, and ordinary university).
The highest degree and the ranking of employed university
By introducing the corresponding independent variables, this part discusses the relationship between faculties’ highest degree and the ranking of their employed universities. The independent variables include bachelor’s degrees, master’s degrees, and doctoral degrees. However, some samples did not obtain MA and PhD degrees, so only the level, ranking, and location of faculties’ undergraduate institutions were introduced as independent variables, and the year of graduation was adopted. Regression results in Table 2 show that compared with the faculties with PhD degrees, the ranking of employed universities of those with BA and MA degrees are 108 and 103 places lower, respectively. It also shows that the level of undergraduate university faculties influences their employed universities’ ranking. The employed universities’ ranking of faculties in 985 and 211 universities during the bachelor phase is 46 and 26 places higher than those in ordinary universities. There is also a significant positive correlation between the ranking of faculties’ undergraduate universities and the ranking of employed universities. The employed universities of males rank about 16 places higher than females. In addition, there is also a significant positive correlation between the graduation year and the ranking of faculties’ employed universities. That is, the ranking of faculties’ employed universities shows a decline (the number becomes larger) over time.
Table 2 OLS regression results.Hierarchical regression of doctoral degree holders
Based on the above conclusions, this part further focuses on the largest proportion of faculties with doctoral degrees. The samples are conducted using hierarchical regression by introducing the corresponding independent variables. In the first layer, “gender, subject, blevel, blogging, dranking, mlevel, mlocation, mranking, dlevel, bilocation, branking” and other variables are put into the model. The second level includes “dyear” in the model to focus on whether time plays a significant role in ranking faculties’ employed universities. Meanwhile, several interaction terms, such as g, were included as new variables. The results indicated that except for the interaction variable “gender and subject”, which is significant in Model 3, most of these variables were not significant, or there were multicollinearity issues, leading to exclusion. Based on the above, each model underwent a multicollinearity test, and the results indicate that none exhibit significant multicollinearity issues (VIF
The results in Table 3 show that the employed universities’ ranking of males ranks higher than females; its ranking of faculties studying in elite universities at the undergraduate, master, and doctorate phases ranks higher than those in ordinary universities; its ranking of faculties studied in eastern area ranks higher than those in the western area; the rankings of undergraduate, master’s and doctoral institutions are positively correlated with the ranking of faculties’ employed universities, and the correlation between the ranking of undergraduate institutions and the ranking of their employed universities is stronger. After adding the variable “dyear”, the above results are still similar, but the relationship between each variable and the ranking of their employed universities is weakened overall. This shows that the role of variable “dyear” on the dependent variable is very significant. The year of doctoral graduation has a significant positive correlation with the ranking of employed universities, with a coefficient of 3.13 (Model 2), which can be roughly explained as the ranking of their employed universities will decrease by about 3 places for each additional year.
Table 3 Hierarchical regression results.
Furthermore, this part analyses the classification of faculties based on the types of universities where they are employed. Specifically, most faculties employed by 985 universities have also studied in elite universities (mainly 985 university). Considering the sample size of this part is relatively limited, which may impact the results, certain variables “blevel”, “mlevel”, “dlevel” are excluded, while others are retained in the regression. The results indicate that the rankings of universities during undergraduate, master, and doctorate phases substantially positively influence the ranking of their employed universities. The lower the ranking of universities in faculties’ study phases (the larger the number), the lower the ranking of their employed universities. Results of the second model of each type of university reveal that the graduation year is significantly positively correlated with the ranking of employed universities. This suggests that the ranking of employed universities for faculties in 985, 211, and ordinary universities decreased by 0.16, 0.55, and 1.77, respectively, for each additional year. Because 985 universities rank in 1–84 (range of difference is 83), 211 universities rank in 33–216 (range of difference is 183), and ordinary universities rank in 54–1087 (range of difference is 1033), it can be inferred that the ranking of employed universities for those three types of faculties decreases by 0.19%, 0.30%, and 0.17% with each additional year.
Threshold regression of doctoral degree holders
By establishing a threshold model, this part aims to verify whether the academic background and time have threshold characteristics on faculties’ employed universities. The model is estimated under no threshold, one threshold, and two in turn. The result shows that the year of doctoral graduation has a double threshold effect on the ranking of faculties’ employed universities, and the estimated values of threshold parameters are 2008 and 2014, respectively.
The results in Table 4 indicate that when the year of doctoral graduation is before 2008, the impact coefficients of undergraduate, master, and doctoral institutions on the ranking of employed universities are 0.0710, 0.0420, and 0.0684, respectively. As the year is between 2008 and 2014, these coefficients increase to 0.171, 0.186, and 0.131, respectively. Upon reaching 2014, the coefficients experience another rise to 0.207, 0.324, and 0.194, respectively. This indicates that the ranking of employed universities is influenced by the threshold characteristics associated with different years. In earlier periods, the impact of the ranking of institutions during faculties’ study phases on the ranking of their employed universities was relatively low. For instance, for every 1-place drop in the undergraduate ranking, there was a 0.0710-place drop in the ranking of employed universities. However, this impact has increased since 2008 and continued to rise in 2014. In 2014, for every 1-place drop in the undergraduate ranking, the ranking of employed universities would drop by 0.207. This suggests that the effect of credential inflation among university faculties continues to accelerate as time goes on.
Table 4 Threshold regression results.The benefits of studying abroad
This part conducts PSM using the k−nearest neighbour matching method. “treat 1” and “treat 2” are selected as treatments. The results show that all variables’ standardised deviation (% bias) after matching is less than 5%, meaning the matching results are reliable. The results show that ATT = −10.585 and −15.327, and corresponding T values (|−8.74 | = 8.74, |−8.40 | = 8.40) are more significant than the critical value of 1.96, so they are significant (See Table 5). That is to say, for faculty i, overseas study (treat 1 and treat 2) can increase by 10.585 and 15.327 places, respectively, in their employed university ranking compared to studying domestically (the ranking number is reduced). The results of other matching methods are used as robustness tests, similar to the above results (See Table 6).
Table 5 Matching results (all samples).Table 6 Matching results of other matching methods.
Based on the above, this part further conducts a comparative analysis of different types of universities and different periods. First, all samples were divided according to different periods to carry out the above matching, mainly based on the above double threshold values (2008 and 2014). Additionally, with the implementation of the expanding enrolment policy in 1999, the growth rate of studying abroad increased sharply after 2000. Therefore, the samples are categorised into the following groups: before 2000, 2001–2007, 2008–2014, and 2015–2022. The results are reliable through balance tests and other matching methods. Before 2000, studying abroad had no significant impact on ranking faculties’ employed universities. From 2001 to 2007, the ranking of employed universities increased by about 3.709 or 2.933 places. From 2008 to 2014, this increase escalated to about 18.737 or 27.975 places; after 2014, the rise was about 19.286 or 44.283 places.
After 2010, the sample size from ordinary universities increased, potentially contributing to the above result to some extent. Besides, because the ranking ranges of 985, 211, and ordinary university differ significantly, the ATT effects of the three types of universities cannot be compared on the same scale. To eliminate those problems, this part further classifies the samples in detail according to the two classification standards of time and the level of their employed universities. We select treat 2 for the subsequent analysis to refine the results further. Table 7 shows that before 2000, the results were not significant. From 2001 to 2007, for faculties employed by 985, 211, and ordinary universities, studying abroad can improve their employed universities’ ranking by 1.689, 3.621, and 31.663 places, respectively (the calculated increase ranges are about 2.035%, 1.979%, and 3.065%). From 2008 to 2014, for the three categories of faculties, studying abroad can improve the ranking of their employed universities by 2.858, 5.201, and 45.352 places, respectively (the increase ranges are about 3.443%, 2.842%, and 4.390). After 2014, the result of faculties employed by 211 university is not significant, while for those employed by 985 and ordinary universities, studying abroad can improve the ranking of their employed universities by 4.618 and 31.949 places (the increase ranges are about 5.564% and 3.093%).
Table 7 Matching results-different universities and period.
In conclusion, the effect of studying abroad on the improvement of faculties’ employed universities’ level (SAD) became significant. There is no evidence of devaluation or credential inflation of overseas degrees; instead, there is a sustained and increasing positive impact on faculties’ employment over time.