Power outage and natural disaster
Mapping the power outages and natural disasters in China enables us to investigate the spatial distribution of power outage risk and natural disasters. Panels (a) and (b) in Fig. 1 show the maps of power outages in China from December 2019 to September 2021. We use the outage frequency and outage duration as the main indices for analysis. To enable cross-county comparisons and minimize the impact of population differences, the outage frequency for a given day is calculated by aggregating the total number of outages within a county and normalizing it by the county’s population. Details of the indices are shown in the Methods section.
Fig. 1: Maps of power outages and natural disasters in China.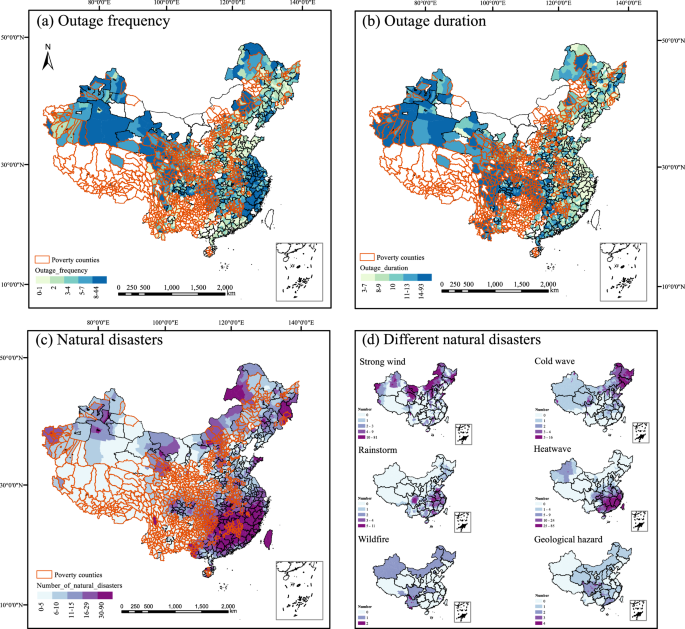
Note: The data is plotted at the county level (2245 county-level units nationwide, including 457 poverty counties). Grid-related natural disasters include strong winds, rainstorms, cold waves, geological hazards, wildfires, and heatwaves. a Shows the outage frequency for each county during the study period. b Shows the power outage duration at the county level. Areas depicted in white indicate a lack of available power outage data. c Shows the total number of natural disasters during the study period. d Shows different types of natural disasters during the study period. The Orange tracing represents poverty counties. The poverty counties in this study were identified by the Chinese government in 2014. The data span from December 2019 to September 2021. The base map used in this study is the 2019 China map, which has been reviewed and approved with the map review number GS (2019)1822 by the Standard Map Service System of the Ministry of Natural Resources.
As depicted in the bar chart located in the lower-left panel of Panels (a) and (b) in Fig. 1, we find that both the outage frequency and outage duration in officially defined poverty counties are higher than those in non-poverty counties. The poverty counties are identified by the Chinese government, determined through a comprehensive set of assessment factors such as per capita annual income, natural conditions, geographical features, infrastructure, and economic conditions23. Poverty counties experience more severe power outages, with a frequency 1.29 times higher and a duration 1.46 times longer than those in non-poverty counties. Our observations also reveal that the outage frequency in poverty counties lasting more than 6 hours is 1.55 times higher than that of non-poverty counties, with a duration 1.34 times longer. Additionally, we find that unplanned power outages occur 1.93 times more frequently in poverty counties than in non-poverty counties, with a duration of 1.29 times longer. Panel (c) in Fig. 1 shows the distribution of grid-related natural disasters during the study period, including strong winds, cold waves, rainstorms, heatwaves, wildfires and geological hazards.
The electricity reliability may be influenced by various factors such as natural disasters, transmission lines, electricity demand, and generating capacity. This study will further estimate the marginal impact of natural disasters on power outage and explore the heterogeneous effects between poverty and non-poverty, using econometric models.
Natural disaster induces more power outages
We explore the impact of natural disasters on power outages using a fixed effects model. Table 1 presents the regression results. Column (1) shows the impact of natural disasters on power outage frequency. Column (2) shows the impact of natural disasters on power outage duration. Column (3) shows the impact of different types of natural disasters on power outage frequency. Column (4) shows the impact of different types of natural disasters on power outage duration. The regression results indicate that, in all model specifications, natural disasters have a statistically significant and positive impact on power outages. Specifically, natural disasters increase outage frequency by 4.04% (Column 1, Table 1) and extend outage duration by 5.93% (Column 2, Table 1) on average for an additional unit increase in natural disasters. All models’ specifications include county-month-by-year fixed effect (County*YM), which captures the month-by-year-specific characteristics in each county, such as cultural economic conditions, energy transition policies, and local infrastructure. We cluster the standard errors at the county level. We further explore the impacts of different types of natural disasters on power outages. We find that strong wind, rainstorms, cold waves, geological hazards, and heatwaves significantly increase outage frequency by 2.98%, 7.99%, 3.77%, 4.45%, and 3.60% (Column 3, Table 1), respectively. Additionally, these natural disasters increase in outage duration by 4.38%, 11.63%, 6.63%, 5.98%, and 4.99% (Column 4, Table 1), respectively.
Table 1 Impacts of grid-related natural disasters on power outages
Among these natural disasters, rainstorms have the most significant influence on both the outage frequency and duration (Columns 3 and 4, Table 1). It must be emphasized that the observed impact of rainstorms on power outages could be a result of the combined effects of rainstorms and lightning due to the collinearity issues between these two factors. Rainstorms and lightning strike electrical equipment and disrupt the power supply network, thereby exacerbating the vulnerability to power outages. Notably, we find no substantial impact from wildfires. This may be due to the relatively infrequent occurrence and moderate severity of wildfires in China. Based on the wildfire data in 2020, the United States experienced 51 times more forest fires than China, with an economic loss 161 times higher24,25. To further eliminate the influence stemming from other confounding factors, we conduct a reanalysis controlling for, and thus excluding the central environmental protection inspections (CEPI), coal price fluctuations, and the impact of COVID-19 on power outages (Supplementary Table 5). The reanalysis results are consistent with our main results, indicating that all grid-related natural disasters, except wildfires, result in increased outages. Given that power outage data were not collected for some counties, we employed the Heckman two-step estimation method to test the robustness of our results. The results are consistent with our main results, indicating their robustness (Supplementary Table 6).
We further compare the impact of natural disasters on planned and unplanned outages. Planned outages are pre-scheduled and notified in advance, while unplanned outages are unexpected and can be triggered by both natural and human-induced factors. We find that natural disasters lead to a 3.50% increase in the frequency of unplanned outages and a 1.04% increase in planned outages (Supplementary Table 7). Natural disasters extend the duration of unplanned outages by 5.78% and planned outages by 1.65% (Supplementary Table 8). Although natural disasters also contribute to an increase in planned outages, this is likely due to heightened maintenance efforts aimed at stabilizing the power grid and mitigating potential risks. The T-test results comparing the coefficients of the two types of outages reveal a significant difference, indicating that unplanned outages are far more strongly impacted by natural disasters than planned outages (Supplementary Table 9).
Additionally, we compare the impact of natural disasters on power outages in counties with varying frequencies of natural disasters. We categorize the cumulative number of natural disasters during the study period into two groups: 0-10 occurrences, and more than 10 occurrences during the study period. The results show that counties with more frequent natural disasters experience a greater impact on power outages due to these disasters (Supplementary Table 10). Specifically, natural disasters increase outage frequency by 1.65% and extend outage duration by 3.13% on average for an additional unit increase in natural disasters during the regions experiencing 0-10 natural disasters in our study period (Supplementary Tables 7 and 8). Natural disasters increase outage frequency by 4.43% and extend outage duration by 6.35% on average for an additional unit increase in natural disasters during the regions of more than 10 natural disasters in our study period.
We also explore the impact of power outages caused by natural disasters across different durations of outages, regions and seasons (Supplementary Tables 7, 8, 9 and 10). Natural disasters increase outage frequency by 2.20% for outages lasting less than 6 hours and by 2.54% for those exceeding 6 hours. Additionally, natural disasters extend outage duration by 2.51% for outages under 6 hours and by 5.20% for outages over 6 hours. Natural disasters in southern China lead to a substantial 5.52% increase in outage frequency and an 8.32% extension in outage duration. In contrast, northern China shows a more modest rise, with outage frequency increasing by 1.08% and duration extending by 1.22%. Southern China experiences a higher overall occurrence rate of natural disasters compared to the north, particularly with events such as heatwaves and rainstorms, which exert substantial pressure on the power grid system. Natural disasters in summer lead to a 4.52% increase in outage frequency, along with a 6.26% extension in duration. In contrast, during winter, there is a 1.91% escalation in outage frequency and a 3.76% increase in duration.
Power outages caused by natural disasters in poverty counties
The estimates of the disproportionate impact of natural disasters on the outage frequency and duration in both poverty and non-poverty counties are presented in Panels (a) and (b) of Fig. 2. The poverty counties exhibit a higher frequency and longer duration of power outages caused by natural disasters compared to non-poverty counties. Specifically, natural disasters increase the outage frequency by 5.19% for poverty counties, and by 3.80% for non-poverty counties. Natural disasters extend the outage duration, resulting in an average increase of 8.96% for poverty counties and 5.34% for non-poverty counties. We also examine the unequal power outages caused by natural disasters by introducing interaction terms of natural disasters and the dummy variable of poverty counties(Supplementary Table 11). Additionally, we use the alternative definition of poverty counties and natural disasters to show the robustness of the results (Supplementary Table 11). Considering the different baseline levels of outages in different counties, we examine the impact of natural disasters on incremental values of power outages (Supplementary Tables 2 and 3). The results show that poverty counties experience more outage frequency and longer outage duration caused by natural disasters, showing the robustness of the results. We also construct a more comprehensive indicator (Total_outage_hours), which simultaneously captures the frequency and duration characteristics of power outages (see Methods section). The results are highly consistent with baseline results (Supplementary Table 4). Considering the importance of outage loss, we further compare the marginal economic losses caused by power outages due to natural disasters in poverty and non-poverty counties by the average proportion of outages impacting various loads in poverty and non-poverty counties and the corresponding economic losses for each load. We find that the marginal losses in poverty counties are 1.56 times higher than those in non-poverty counties, based on the estimated parameters of natural disasters on Total_outage_hours (Supplementary Table 4).
Fig. 2: Heterogeneity of power outages caused by natural disasters.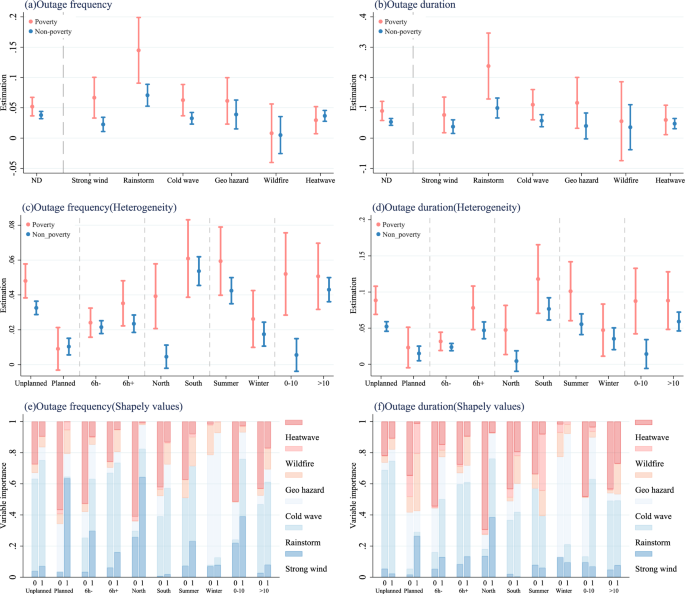
Notes: In a and b, we show the impacts of Natural disaster, Strong wind, Rainstorm, Cold wave, Geo hazard, Wildfire and Heatwave on power outages. In c and d, we show the heterogeneity impact of Natural disaster on power outages. The solid dots denote the point estimation coefficients and the lines refer to the 95% confidence interval of the coefficients in a–d. In e and f, we show the decomposition results of natural disaster impacts on power outages based on Shapley Values. The definition of summer is from May to October. The definition of winter is the remaining months. 0-10 represents counties with fewer than 10 natural disaster occurrences, whereas >10 indicates counties experiencing more than 10 natural disasters during the study period. The 1 and 0 in the X-axis in e and f represent the poverty and non-poverty counties, respectively. Our regression analysis dataset comprises data from 2245 counties across China. The significance of the regression coefficients is assessed using a two-sided t-test, which evaluates whether the coefficients are statistically different from zero. Source data can be found in sheets Supplementary Data 2–7 of file Supplementary Data 1–7.
Plausible explanations for the lower electricity reliability in responding to natural disasters for the poverty counties may be the lower level of development of the local grid infrastructure26 and the maintenance capacity27 of the grid, both of which likely play a key role in ensuring power stability. We use electric grid investment data as a proxy variable for assessing the development of grid infrastructure, while utilizing the labor force of power supply stations at the county level as a proxy variable to evaluate the maintenance capability of the grid network to validate the importance of both mechanisms to power outages. Our results (Supplementary Table 12) indicate that increased investment in grid infrastructure and the augmentation of the workforce at county power supply stations can effectively mitigate the frequency and duration of power outages during natural disasters. Given the vulnerable power grid infrastructure construction and limited power maintenance capacity in poverty areas (the labor force in county power supply stations for poverty counties is 0.38 times that in non-poverty counties), the occurrence of natural disasters leads to higher frequency and longer duration of power outages in these regions.
We further explore the impacts of different types of disasters on power outages in poverty and non-poverty counties. Panels (a) and (b) of Fig. 2 show the impact of different natural disasters on outage frequency and outage duration. Specifically, in poverty counties, the strong wind, rainstorms, cold waves, geological hazards, and heatwaves increase outage frequency by 6.67%, 14.48%, 6.27%, 6.14%, and 2.96%, respectively, compared to 2.26%, 7.07%, 3.27%, 3.90% and 3.67% in non-poverty counties. Furthermore, these natural disasters extend outage duration by 7.64%, 23.78%, 11.02%, 11.64%, and 6.00% in poverty counties, while in non-poverty counties the increases are 3.78%, 9.92%, 5.75%, 4.01% and 4.77%. The Empirical P-Values indicate that poverty counties are more vulnerable to power outages caused by strong winds, rainstorms, and cold waves (Supplementary Table 13).
To explore potential variations across subgroups, we also conduct heterogeneity analyses. Panels (c) and (d) in Fig. 2 show the results. Empirical P-Values indicate that poverty counties experience a higher frequency and longer duration of power outages caused by natural disasters compared to non-poverty counties, particularly in several specific scenarios: unplanned outages, outages lasting more than 6 hours, outages in northern China, outages during the summer season, and in areas with 0 to 10 outage occurrences during the study period (Supplementary Table 13).
Based on the Shapley value approach, we find that 43.86% of the impact of natural disasters on power outage frequency is attributed to rainstorms, and 31.63% is attributed to heatwaves. Similarly, 42.86% of the impact of natural disasters on power outage duration is attributed to rainstorms, while 28.05% is attributed to heatwaves, as indicated by the Shapley value. The primary factor contributing to the outage frequency caused by natural disasters in poverty-stricken counties is rainstorms, accounting for 50.49%, followed by strong winds at 18.00%. The primary factor contributing to power outage duration caused by natural disasters is rainstorms, accounting for 49.61%, followed by cold waves at 15.07% in poverty counties. In non-poverty counties, rainstorm is the primary contributor influencing power outage frequency caused by natural disasters at 41.71%, followed by heatwaves at 38.94%. In terms of power outage duration caused by natural disasters, rainstorms have the most significant contribution at 41.53%, followed by heatwaves at 33.07% for non-poverty counties. We also provide the contribution of rainstorms alone, strong winds alone, and their simultaneous occurrence to power outages (Supplementary Fig. 1).
Panels (e) and (f) in Fig. 2 illustrate the heterogeneous results of contribution decomposition based on Shapley values. Rainstorms significantly contribute to unplanned outages both in poverty and non-poverty counties. Cold waves and heatwaves have a greater impact on planned outages in non-poverty counties, while strong winds and geological hazards have a greater contribution to poverty counties. Rainstorms make a significant contribution to more-than-6-hour power outages. In northern regions, strong winds exacerbate outages in poverty counties, while heatwaves intensify outages in non-poverty counties. Winter power outages are primarily driven by cold waves. Heatwaves are the second-largest contributor to summer power outages in non-poverty counties, but their contribution to summer power outages in poverty counties is significantly smaller. Supplementary Fig. 1 also provides the contributions of more detailed types of natural disasters to the impact on power outages.
Projections under different scenarios
In this section, we predict the power outage hours caused by natural disasters under different climate scenarios. We obtain the data from the Coupled Model Intercomparison Project 6 (CMIP6). We use the daily meteorological projections under two Shared-Socioeconomic Pathway-Representative Concentration Pathways (SSP-RCP): SSP-RCP126 and SSP-RCP585. The SSP-RCP126 scenario represents a low-emission trajectory, while the SSP-RCP585 scenario depicts a high greenhouse gas emission pathway. We calculate the change of future natural disasters from 2022-2099 compared to the current period (2019-2021) based on the scenarios’ data, including maximum wind speed, maximum temperature, minimum temperature, average temperature and precipitation.
We focus on the change in power outage hours caused by strong winds, heatwaves, cold waves, and rainstorms. We quantify the impact of natural disasters on power outage hours between poverty and non-poverty counties based on Eq. (12). The change in outage hours (compared to the period 2019-2021) is determined by multiplying the change of each type of natural disaster with its respective natural disaster-induced outage hours coefficients, as derived from our previous findings presented in Supplementary Table 4. The calculation assumes that the grid infrastructure remains unchanged from its current state. Considering the population affected by each power outage, the distribution of the increased outage hours caused by natural disasters in scenarios of SSP-RCP126 and SSP-RCP585 from 2022-2099 is shown in Fig. 3.
Fig. 3: The distribution of increased power outages due to natural disasters in scenarios of SSP-RCP126 and SSP-RCP585.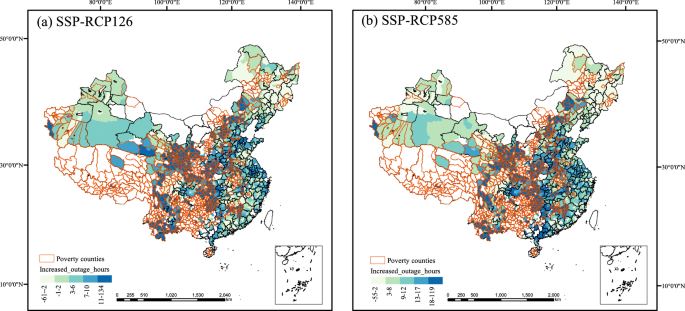
a Presents the cumulative increase in per capita power outage hours for each county from 2020 to 2099 under the SSP126 scenario, driven by natural disasters. b Presents the cumulative increase in per capita power outage hours for each county from 2020 to 2099 under the SSP585 scenario, driven by natural disasters. Areas depicted in white indicate a lack of available power outage data. The color indicates the intensity of the power outages. The orange tracing represents poverty counties. The base map used in this study is the 2019 China map, which has been reviewed and approved with the map review number GS (2019)1822 by the Standard Map Service System of the Ministry of Natural Resources.
The projected increase in power outages is expected to result in 0.072 h/person/year from 2022 to 2099 under the SSP-RCP126 scenario, and 0.142 h/person/year under the SSP-RCP585 scenario. We also perform a back-of-the-envelope calculation of the economic cost of power outages induced by natural disasters (see Methods). Based on our calculations, the projected damages from 2022 to 2099 are estimated to range from 192 to 468 billion RMB. And we find that climate change will further widen the outage gaps caused by natural disasters between poverty and non-poverty counties in SSP-RCP126 (157.82%) and SSP-RCP585 scenarios(157.76%). These findings indicate that the reliability of power supply in poverty counties will face substantial challenges in the future.
Building upon the calculation of economic costs using the original population-based method, we also incorporate a total GDP-based analysis as a comparative benchmark. The new projected damages between 2022 and 2099 are estimated to range from 257 to 481 billion RMB, which is slightly higher than the losses of 192 to 468 billion RMB calculated considering the population affected by power outages.
In the Supplementary section titled “Projections under different scenarios”, we explore the potential impact of improvements in emergency response capabilities and grid infrastructure upgrades on power outages caused by natural disasters. Apart from the Reference Scenario, we also construct two scenarios: the Improvement to the Non-Poverty Counties Level Scenario and the Improvement to the Top 20% Level Scenario. The results indicate that the improvement of emergency response capabilities and grid infrastructure significantly reduces the increase in outage hours caused by the changes in natural disasters compared to the Reference Scenarios. Furthermore, the gaps between poverty and non-poverty counties in the Improvement to Non-Poverty Counties Level Scenario and the Improvement to the Top 20% Level Scenario also reduce compared to the Reference Scenarios (see Supplementary Table 14). This estimation provides us with an indication of the potential damage that can be mitigated through investments in enhanced power systems.