Study cohort
This study was approved by the Memorial Sloan Kettering Cancer Center (MSKCC) Institutional Review Board (12-245) and all patients provided written informed consent for tumor sequencing and review of medical records for demographic, clinical and pathology information. A total of 5,831 breast cancer samples, which underwent prospective genomic profiling by the MSK-IMPACT targeted sequencing panel9,63,64 from January 2014 to December 2021, were retrieved. After removing samples with a sequencing-estimated tumor purity
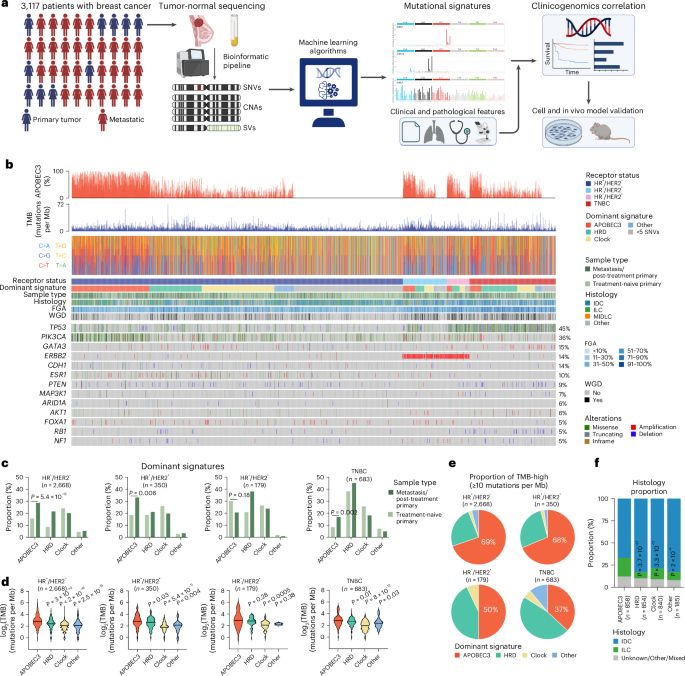
Histological subtypes, tumor stage at diagnosis, tumor grade of primary breast cancer and receptor status were determined as described in Razavi et al.9. Briefly, breast cancer histological subtypes were classified as either invasive ductal carcinoma, invasive lobular carcinoma or mixed/other histologic types. Tumor grade was defined based on the Nottingham combined histologic grade of the primary breast cancer. The primary tumors with total tumor score of 3–5 were classified as G1 (well differentiated); 6–7 as G2 (moderately differentiated) and 8–9 as G3 (poorly differentiated). Patients were classified into breast cancer subtypes based on ER and progesterone receptor IHC results and the HER2 IHC and/or fluorescence in situ hybridization results rendered at the time of diagnosis in accordance with the American Society of Clinical Oncology and College of American Pathology guidelines65,66.
Each patient in our cohort was assigned a singular receptor status. Recognizing potential intertumoral heterogeneity, we sought a unified definition as follows: (1) in cases where any metastatic biopsy was sequenced, receptor status was defined by treating clinician interpretation and assigned first-line treatment; (2) in cases where only a primary tumor is sequenced, receptor status was defined by receptor status of the sequenced primary. Employing these definitions, our cohort consisted of 2,133 patients (68.4%) with HR+/HER2− tumors, 276 (8.9%) with HR+/HER2+ tumors, 149 (4.8%) with HR−/HER2+ tumors and 559 patients (17.9%) with TNBC.
MSK-IMPACT targeted sequencing analysis
Breast cancer samples underwent tumor-normal sequencing by the United States Food and Drug Administration-authorized MSK-IMPACT assay, which targets between 341 (2014) and 505 (2021) cancer-related genes. Genomic data extracted from MSK-IMPACT included somatic SNVs, CNAs, SVs and additional genomic metrics (TMB, mutations per Mb) and FGA (the percentage of the genome affected by CNAs63,64). Somatic mutations were classified as pathogenic, likely pathogenic or predicted oncogenic as defined by OncoKB annotation67. We used FACETS68 to define the allele-specific gene amplifications and homozygous deletions, tumor purity and ploidy, as previously described69. WGD status was inferred from MSK-IMPACT sequencing data, as previously described69. Briefly, tumor samples were considered to have undergone WGD if the fraction of major allele greater than one was >50%.
Validation of SigMA performance on MSK-IMPACT and cell line WGS data
Although SigMA was designed originally to identify tumors positive for HRD, it has also proven effective in accurately classifying other types of mutational signatures, excelling particularly with APOBEC3 signatures25. SBS2 and SBS13 exhibit distinct trinucleotide context spectra, differing strongly from flat signatures like SBS3 and SBS5, or other specific signatures such as POLE and SMOKING, even with a minimal number of mutations for analysis. We thus aimed to independently assess the ability of SigMA to detect APOBEC3 signatures in breast cancer samples across three distinct datasets: TCGA breast cancers (primary, WES), Bertucci et al.20 (metastatic, WES) and Nik-Zainal et al.28 (primary, WGS). To validate SigMA, we adopted the same simulation approach as its developers, which involves MSK-IMPACT panel simulation.
This method is based on the concept that a high-quality signature evaluation requires a substantial mutation count, achievable only through WES and WGS. We initially computed signatures using real WES and WGS data, considering these results as the ground truth. Subsequently, we simulated MSK-IMPACT samples by reducing the mutations in each WES and WGS sample to only those within genomic regions covered by the MSK-IMPACT panel (version impact 468). SigMA (v.1.0.0.0) was then applied to these simulations to determine exposure and the dominant signature. Finally, we compared these outcomes with the established ground truth to obtain performance metrics, focusing on the ability to predict APOBEC3-dominant samples. Only samples with greater or equal to 5 SNVs in the simulated panel were considered for performance metric analysis.
WGS analysis
To validate findings on MSK-IMPACT and provide further information regarding the evolution of APOBEC3 mutagenesis over time, WGS was carried out on five pairs of selected primary and MBC patient samples by the MSK’s Integrated Genomics Operations using validated protocols25,27. Briefly, microdissected tumor and germline DNA were subjected to WGS on HiSeq2000 (Illumina). The median sequencing coverage depth of 102× (range, 88×–132×) for tumor and 44× (range, 36×–58×) for normal samples. In addition, genomic DNA was extracted from 29 cell lines using the E.Z.N.A Tissue DNA Extraction Systems (Omega Bio-Tek, cat. no. 101319-018) and subjected to WGS, with a median sequencing coverage depth of 63× (for T47D lines) or 33× (for BT-474 lines) (range, 28×–103×).
For samples and cell lines subjected to WGS, data were processed through a validated bioinformatics pipeline25,27. Initially, sequence reads were aligned to the human reference genome GRCh37 utilizing the Burrows-Wheeler Aligner (BWA, v.0.7.15)70. SNVs in both WGS and MSK-IMPACT analyses were identified using MuTect (v.1.0)71. Indels were detected by employing a suite of tools: Strelka (v.2.0.15)72, VarScan2 (v.2.3.7)73, Platypus (v.0.8.1)74, Lancet (v.1.0.0)75 and Scalpel (v.0.5.3)76. CNAs and LOH assessments were conducted using FACETS (v.0.5.6)68. Mutations in tumor suppressor genes deemed deleterious/loss-of-function, or those targeting a known mutational hotspot in oncogenes, were classified as pathogenic. Hotspot-targeting mutations were annotated with reference to cancerhotspots.org (ref. 77).
Structural variants were identified using Manta (v.0.29.6)78, SvABA (v.1.1.0)79 and Gridss (v.2.13.2)80 from WGS data. Structural variants identified by at least two of the three callers were retained and utilized for subsequent analyses. Setup and call procedures are described in detail in their respective code repositories: for Manta, https://github.com/ipstone/modules/blob/master/sv_callers/mantaTN.mk and for SvABA, https://github.com/ipstone/modules/blob/master/sv_callers/svabaTN.mk. These processed SV calls, along with additional genomic data (SNVs, indels, CNAs), were integrated to create circos plots via the signature.tools.lib R package81 (code repository https://github.com/Nik-Zainal-Group/signature.tools.lib, v.2.4.0) using Rcircos (v.1.2.2) package. For all patients and cell lines with more than one sample, all unique variants from any samples in a given patient or cell line were genotyped in all other samples from the same patient or cell line using Waltz (v.3.2.0) (https://github.com/mskcc/Waltz).
Mutational signature analysis
We have applied various tools to compute mutational signatures across different types of data. For WES data, DeconstructSigs (v.1.8.0)31, MutationalPatterns (v.3.4.1)30 and SigProfiler (v.0.0.25)29 were employed. For WGS data, we opted for Signal82 and, for the MSK-IMPACT panel, SigMA was used. The DeconstructSigs method is designed to identify the most accurate linear combination of predefined signatures that reconstructs a tumor sample’s mutational profile. This method employs a multiple linear regression model. DeconstructSigs—an R package extension—leverages the Bioconductor library at CRAN (https://cran.r-project.org/). MutationalPatterns operates as a non-negative least squares optimization algorithm. The non-negative least squares problem is studied extensively, and MutationalPatterns utilizes an R-based active set method from the pracma package (v.2.3.8) for its ‘fit_to_signatures’ function, available at CRAN. We ran MutationalPatterns with two different settings: ‘regular’ and ‘strict’. The ‘strict’ method suffers less from overfitting but can suffer from more signature misattribution. SigProfiler attributes a set of known mutational signatures to an individual sample, determining the activity of each signature and the probability of each causing specific mutation types. It integrates SigProfilerMatrixGenerator (v.1.2.5) for its functionality. We also used SigProfilerSimulator (v.1.1.4) and SigProfilerClusters (v.1.0.11) to assess the clustered mutations. Signal is considered one of the best state-of-the-art tool for WGS, offering a comprehensive workflow for mutational signature analysis. We set the number of bootstraps to 100, sparsity threshold type was fixed, sparsity threshold was 5% and sparsity P value was 0.05. Kataegis was detected using the Signal web portal (https://signal.mutationalsignatures.com).
SigMA can process samples with at least five somatic SNVs, making it particularly suitable for MSK-IMPACT samples. It encompasses five steps: discovery of mutational signatures in WGS data using NMF; clustering to determine tumor subtypes; simulation of cancer gene panels and exomes; calculation of likelihood, cosine similarity, and signature exposure; and training of gradient boosting classifiers for a final score. SigMA score thresholds are established based on simulated data, considering tumor type and sequencing platform.
The dominant mutational signature in each MSK-IMPACT sample, that is, the primary mutational process occurring in a cancer genome, was assessed using SigMA. We translated mutational exposures into percentages for cross-sample comparisons. For all other tools used in WGS and WES data, the dominant signature was defined as the mutation process with the highest percentage of exposure. This included groupings as Clock (SBS1 + SBS5), APOBEC3 (SBS2 + SBS13), HRD (SBS3 + SBS8) and considering Other signatures independently (for example, SBS17, SBS18, and so on). The process with the maximum exposure was considered dominant. To determine whether a mutation was APOBEC3-context, we identified characteristic peaks from cosmic signatures related to SBS2 (C>T mutations in the contexts TCA, TCC, TCG, TCT) and SBS13 (C>G mutations in the contexts TCA, TCC, TCG, TCT; C>A mutations in the contexts TCA, TCC, TCG, TCT), as described previously25.
Treatment outcome analysis
All patients included in the treatment outcome analyses were treated at MSKCC. The exact regimen, dates of start and stop therapy, as well as date of progression was annotated via expert review. Progression events were defined as (1) radiographic or clinical event prompting change in systemic therapy or recommendation for locally targeted radiation therapy, (2) documented clinician impression detailing progression, after which there was documented patient or MD preference to continue same therapy, as previously described9.
We determined the association between dominant mutational signature and PFS with disease progression on therapy with ET ± CDK4/6 inhibitors or patient death. ETs, either as monotherapy or as partner of CDK4/6 inhibitors were categorized as following: aromatase inhibitor versus selective ER degrader. The log rank test was used to compare the survival distributions among two or more groups. Both univariate and multivariate Cox proportional hazard models (stratified by ET partner, and treatment line where available) were applied. For patients with several lines of therapy from the same class of treatment, only the first treatment line from that class that was started after the MSK-IMPACT biopsy was included in the analysis.
Permutation analysis for APOBEC3 enrichment
To assess the correlation between APOBEC3 enrichment and the occurrence of SNVs within a gene, we adapted a method previously described83 for our dataset. The aim was to detect potential correlations between mutations in specific genes and APOBEC3 enrichment. To mitigate the impact of high TMB in APOBEC3-dominant samples, high frequency of mutations in longer genes, or the presence of high frequency genetic alterations in breast cancer, we applied a permutation-based method aimed at standardizing the overall mutation count for each sample and gene. This process randomized the gene × sample binary mutation matrix while preserving the mutation counts for each gene and sample, following the approach described by Strona et al.84. In this matrix, rows represent samples and columns represent genes, with ‘1’ indicating a mutation and ‘0’ indicating a wild-type nonmutated gene. We conducted an APOBEC3 enrichment analysis across all genes using a Wilcoxon rank sum P value to compare APOBEC3 exposure in mutant versus wild-type samples for each gene. To correct for multiple testing, P values were adjusted for the false discovery rate (FDR) using the Benjamini–Hochberg procedure. For the original dataset and each of 10,000 permutations, we calculated the P value_observed and P value_Random, respectively (for a total of 10,000 P value_Random). The final P value was calculated as the number of permutation iterations where P value_Random ≤ P value_observed, divided by the total number of permutations (10,000), ensuring a fair assessment of gene-mutation frequencies across samples with high mutation burdens. For the permutation analysis, we utilized the R package EcoSimR (v.0.1.0). The permutation test was carried out under various conditions, separately for HR+/HER2− and for TNBC in both primary and metastatic settings, using pathogenic and likely pathogenic SNPs by OncoKB annotation. For each data group, we filtered for genes mutated in at least 1% of the subset obtained and for samples with at least one mutation in one of these genes. This filtering was necessary to ensure the EcoSimR package performed correctly during the randomization process. To compute P values, odds ratio, FDRs and other statistics we used different functions from the Python packages scipy (v.1.10.0) and statsmodels (v.0.13.2), whereas for visualization we used matplotlib.
Genomic analysis of patients with several samples collected over time
To investigate the evolution of mutational processes over time, we subset the initial cohort of 3,800 breast cancers from MSK-IMPACT identifying patients with HR+/HER2− subtype and several tumor samples collected over time and various treatments (patients with two samples, n = 449; patients with three or more samples, n = 43). Tumor sample pairs with complete somatic mismatches on the levels of SNVs, indels and/or CNAs were excluded.
To assess whether a somatic mutation was truly acquired over time and exposure to therapy, somatic mutations identified in samples collected afterward were interrogated in the matched respective primary tumor/first metastatic biopsy in a matched tumor-informed manner (genotyping) using Waltz (https://github.com/mskcc/Waltz), which required at least two duplex consensus reads, comprising both strands of DNA, to call a somatic SNV at a site known to be altered in the matched tumor sample from a given patient, as described previously85.
Immunohistochemical analysis
Immunohistochemical analyses were conducted on a Leica Bond III automated stainer platform. Formalin-fixed paraffin-embedded (FFPE; 4 μm thick) tissue sections were subjected to heat-based antigen retrieval for 30 min using a high pH buffer solution (Bond Epitope Retrieval Solution 2; Leica, cat. no. AR9640). Subsequently, they were incubated with the A3A-13 (LQR-2-13 (UMN-13)) or the A3B (5210-87-13) primary antibodies at a 1:2,500 and 1:200 dilution, respectively for 30 min. A polymer detection system (Bond Polymer Refine Detection; Leica, cat. no. DS9800) was used as secondary reagent. Extent (percentage of tumor cells) and intensity (weak, moderate, strong) of A3A and A3B expression was evaluated was evaluated by two pathologists (F.P. and J.S.R.-F.).
Cell lines
The following cell lines were used: T47D (ATCC HTB-133), MCF7 (ATCC HTB-22), BT-474 WT and A3A KO, and MDA-MB-453 WT and A3A KO (a gift from J. Maciejowski) and HEK293T (ATCC CRL-3216, a gift from P. Chi). T47D cells were cultured in RPMI medium; MCF7, BT-474 and MDA-MB-453 were cultured in DMEM/F12 medium; HEK293T were cultured in DMEM medium. All media were supplemented with 10% fetal bovine serum (Corning, cat. no. 35-010-CV), 2 mM l-glutamine, 100 U ml−1 penicillin and 100 µg ml−1 streptomycin (Gemini Bio 400-109). Tetracycline-free fetal bovine serum (Takara Bio, cat. no. 631367) was used for experiments using the doxycycline-system. All cells were maintained in a humidified incubator with 5% CO2 at 37 °C. All cell lines were routinely tested and were negative for mycoplasma contamination.
Cloning and lentiviral transduction
The A3AWT, A3AE72Q, A3BWT and A3BE255Q sequences (cDNA plasmids were a gift from J. Maciejowski) were cloned into pDONR221 (Invitrogen, cat. no. 12536017) using the Gateway BP Clonase II Enzyme mix (Invitrogen, cat. no. 11789020). Expression vectors were generated by cloning into pInducer20 (a gift from S. Elledge, Addgene plasmid 4401; ref. 86) using the Gateway LR Clonase II enzyme mix (Invitrogen, cat. no. 11791020). Lentiviral particles were prepared by transfecting 293T cells with expression clones along with the lentiviral envelope and packaging plasmids using X-tremeGENE HP DNA transfection reagent (Sigma-Aldrich, cat. no. 6366546001). The medium was refreshed after 24 h. After 48 h, the supernatant was collected and filtered through 0.45 µm filters. T47D and MCF7 cells were transduced with the lentiviral particles and stably expressing cells were generated after selection using G418 (InvivoGen, cat. no. ant-gn-1) for 2 weeks. Cells were treated with 0.1 µg ml−1 doxycycline (Sigma-Aldrich, cat. no. D9891) to induce overexpression.
Generation of resistant cells
T47D dA3AWT-5 and dA3AE72Q-5 cells were treated with DMSO or 500 nM abemaciclib for 14 days, after which the drug concentration was increased to 1 µM. Surviving dA3AWT-5 cells were tested for resistance after 2 months of continuous culture in 1 µM abemaciclib. dA3AE72Q-5 cells did not grow out even after 5 months under selection. Additionally, resistant cells were expanded after selection from the long-term growth assays.
Antibodies and reagents
The following primary antibodies were obtained from Cell Signaling Technology and used for immunoblotting at a dilution of 1:1,000: anti-HA (C29F4), anti-p-Rb S780 (D59B7), anti-p-Rb S807/811 (D20B12), anti-Rb (4H1), anti-E2F1 (3742), anti-Cyclin E2 (4132S), anti-Cyclin A2 (BF683), anti-YAP1 (D8H1X), anti-β-tubulin (D3U1W) and anti-Vinculin (E1E9V). Anti-Vinculin (V9131) was obtained from Sigma-Aldrich and used at a dilution of 1:1,000. The secondary antibodies used were anti-Rabbit IgG, HRP-linked (1:3,000, Cell Signaling Technology, cat. no. 7074), anti-Rabbit IgG IRDye 680 RD (1:10,000, LI-COR Biosciences, cat no. 926-68071), and anti-Mouse IgG IRDye 800 RD (1:10,000, LI-COR Biosciences, cat. no. 926-32210). The following primary antibodies were obtained from R. Harris and used for IHC: anti-A3A-13 (1:2,500, cat no. LQR-2-13 (UMN-13)) and anti-A3A/B/G (1:200, cat. no. 5210-87-13). The following drugs were purchased from Selleck Chemicals: fulvestrant (S1191), abemaciclib (S5716), palbociclib (S1579), lapatinib (S2111), neratinib (S2150) and MK2206 (S1078), and dissolved in DMSO. Trastuzumab deruxtecan (Daiichi Sankyo, cat. no. DS-8201a) was dissolved in saline.
Immunoblotting
Cells were lysed on ice using RIPA lysis buffer (Thermo Scientific, cat. no. 89901) supplemented with protease and phosphatase inhibitor (Thermo Scientific, cat. no. 78444). Lysates were cleared using centrifugation and total protein concentration was measured with BCA protein assay (Thermo Scientific, cat. no. 23225). Total protein 30–50 µg was separated on 4–12% Bis-Tris protein gels (Invitrogen NuPAGE) and transferred onto polyvinylidene fluoride or nitrocellulose membranes. Blots were blocked with Intercept (TBS) Blocking Buffer (LI-COR Biosciences, cat. no. 927-60001) or 5% milk, and incubated with primary antibodies overnight at 4 °C. After incubation with secondary antibodies, the blots were scanned by Odyssey CLx Imaging System (LI-COR Biosciences) or developed using the Western Lightning Plus-ECL (PerkinElmer, cat. no. NEL104001EA) and processed using Fiji v.2.0.0.
DNA deaminase assay
In vitro deamination assay was performed as described previously87. Briefly, 50 µg total cell lysates were incubated with RNase A (1.75 U), ssDNA substrate (4 pmol), UDG buffer and UDG (1.25 U) in HED buffer (25 mM Hepes pH 7.8, 5 mM EDTA, 10% glycerol, 1 mM dithiothreitol freshly supplemented with protease and phosphatase inhibitor) for 2 h at 37 °C; 100 mM NaOH was then added and heated at 95 °C for 10 min to cleave the DNA at abasic sites. The sample was then heated with Novex Hi-Density TBE sample buffer (Invitrogen, cat. no. LC6678) at 95 °C for 5 min, cooled down on ice and run on a 15% TBE-urea PAGE gel. Separated DNA fragments were imaged on an ImageQuant 800 (Amersham). The ssDNA oligo substrates were 5′-(6-FAM)-GCAAGCTGTTCAGCTTGCTGA for A3A88 and 5′-ATTATTATTATTCAAATGGAT-TTATTTATTTATTTATTTATTT-fluorescein for A3B.
In vitro growth assays
For cell viability measurement, 500–2,000 cells per well were plated in triplicates in 96-well plates in complete medium with 10% FBS or tetracycline-approved serum for doxycycline-inducible models. After overnight incubation for attachment, cells were treated with drugs (day 0). Medium was replaced once every week and doxycycline was topped up twice every week for overexpression cells. Viability was measured using the redox-sensitive dye Resazurin (R&D Systems, cat. no. AR002; 25 µl per well incubated at 37 °C for 4 h and read at 544 nm excitation and 590 nm emission using SpectraMax M5 (Molecular Devices)) or brightfield imaging of attached cells using Incucyte S3 (Sartorius). IC50 values were calculated by nonlinear regression of inhibitor concentrations with response in GraphPad Prism v.9.4.1. For colony forming assays, 2 × 10⁵ MDA-MB-453 cells were plated in triplicates in six-well plates. The cells were treated with drugs after 24 h, and their media replaced with fresh drugs twice every week. The cells were fixed with 100% methanol when confluent, washed with water, stained with 0.5% crystal violet (Sigma-Aldrich, cat. no. C0775) in 25% methanol, washed with water, dried and scanned using the AxioObserver 7 inverted microscope (Zeiss).
Statistical analyses
Statistical analyses were conducted using R (v.3.1.2, v.4.1.0 and v.4.3.2) and GraphPad Prism v.9.4.1. Summary statistics were used to describe the study population. Fisher’s exact test or Pearson’s chi-squared test were used to compare categorical variables, whenever appropriate. Mann–Whitney U or Wilcoxon rank sum, or two-way analysis of variance (ANOVA) tests were used to compare continuous variables. A log rank test was used to compare the survival distributions between groups. Comparisons of frequencies of genes altered by somatic SNVs and CNAs as well as for site-specific gene alterations were performed using the Fisher’s exact test and logistic regression. Multiple testing correction using the Benjamini–Hochberg method was applied to control for the FDR whenever appropriate. Pearson’s coefficient R was computed using the python package scipy.stats (v.1.10.0). All P values were two-tailed, and 95% confidence intervals (CIs) were adopted for all analyses.
Reporting summary
Further information on research design is available in the Nature Portfolio Reporting Summary linked to this article.