A dynamic phenotypic continuum during CRC evolution
The presence of an LGR5− fetal-like population has been well documented in BRAFmut/MMRd (mismatch repair-deficient) CRC12,13. Although considered a feature of WNT-independent tumors14,15, recent work suggests that the fetal-like state can be adopted by LGR5+ stem cells in Apc mutant premalignant lesions16. As a similar aberrant state emerges only transiently in the regenerating epithelium17,18, its persistence beyond the precancerous stage in WNT-driven CRC remains unclear. Without a comprehensive understanding of its temporal dynamics during tumor evolution and its biological importance, assessing the clinical relevance of this aberrant state is challenging.
To elucidate cell state dynamics along the entire malignancy continuum, we generated isogenic mouse organoid models that mimic the clinical progression of WNT-driven CRC (Fig. 1a and Extended Data Fig. 1a). Specifically, we induced common driver mutations in intestinal SCs using Lgr5-driven CreERT2 (Extended Data Fig. 1a). Transcriptome profiling of single cells from normal wild-type (WT) intestinal organoids, precancerous Apcnull (A) and advanced malignant Apcnull::KrasG12D::Smad4null::Trp53null (AKSP) tumoroids revealed the emergence of tumor-specific cell clusters (Extended Data Fig. 1b,c and Supplementary Table 1a,b). Notably, cells within this neoplastic metacluster re-expressed markers of fetal intestinal progenitors19 (Extended Data Fig. 1d and Supplementary Table 1c). We henceforth refer to this population as oncofetal (OnF) and define a 51-gene signature (Extended Data Fig. 1e and Supplementary Table 1d) to chart and track its dynamics during tumorigenesis. Changes in cellular composition along the CRC malignancy continuum were characterized by a significant reduction in enterocytes, indicative of a differentiation block in tumoroids (Fig. 1b, Extended Data Fig. 1f and Supplementary Table 1e). Moreover, although a burst of LGR5+ SCs was triggered by adenomatous polyposis coli (APC) loss of function (LoF), a subset of these mutant cells adopted an OnF state (Fig. 1b, Extended Data Fig. 1g,h and Supplementary Table 1e). This observation unveils a heterogeneous response to APC depletion, reconciling divergent claims regarding both the expansion of LGR5+ cells14 and fetal-like reprogramming16 in WNT-driven precancerous tumors. Intriguingly, the progression to a malignant stage (AKSP) was marked by a decline in canonical LGR5+ SCs and a noticeable expansion of OnF cells (Fig. 1b, Extended Data Fig. 1g,h and Supplementary Table 1e). These data indicate that, contrary to the transient emergence of fetal-like cells in response to injury17, the OnF state is perpetuated in CRC. This raises the question of whether OnF reprogramming generates a discrete, de novo cellular entity. Analysis of the evolution of SC phenotypes along the CRC malignancy continuum confirmed that healthy intestinal SCs are exclusively in an LGR5+ state (Fig. 1c,d). However, their neoplastic counterparts did not distinctly adopt either this canonical state or the OnF state but rather appeared to traverse a phenotypic spectrum delimited by these cellular states (Fig. 1c,d and Extended Data Fig. 1g–i). Although most cells along this spectrum retain Lgr5 expression, extreme OnF states are Lgr5− (Extended Data Fig. 1j). Collectively, these findings indicate that, although cell plasticity is tightly regulated in the healthy epithelia, APC LoF is sufficient to lift these restrictive barriers. The subsequent expansion of plastic potential during CRC progression suggests that accumulation of additional mutations may instruct cell state dynamics. To investigate the effects of various genetic events subsequent to APC LoF, we analyzed the transcriptome of dual mutant tumoroids (that is, Apcnull::Smad4null = AS, Apcnull::KrasG12D = AK and Apcnull::Trp53null = AP). This analysis indicated that SMAD4 LoF has a limited effect on fate decision, whereas KRASG12D mutation and TP53 LoF favor the OnF and canonical LGR5+ states, respectively (Extended Data Fig. 1k).
Fig. 1: Evolution of neoplastic cell states during CRC progression.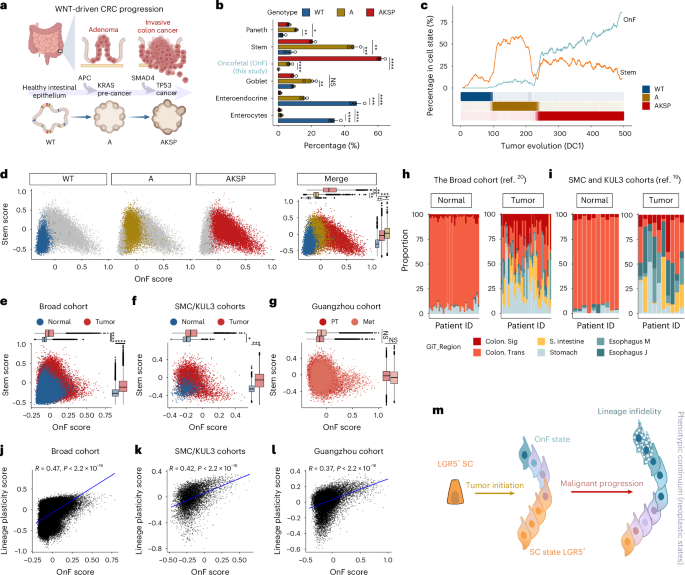
a, Schematics of the organoid models used to recapitulate the malignancy continuum of CRC. b, The percentage of various cell types and states in the indicated models (n = 3 independent organoid cultures per group). Cell numbers per group are given in Supplementary Table 1a. The bar plots are mean ± s.e.m. Linear regression tested for significant differences in log(transformed cell-type proportions) between genotypes, with P values adjusted using the Benjamini–Hochberg method. c, Percentage of cells in stem and OnF states along diffusion component 1 (DC1), grouped into 500 bins by increasing DC1 values. The bottom color bars show the percentage of cells from each genotype per bin. d, Scatter plot showing cell state distribution along the SC–OnF phenotypic spectrum across the CRC malignancy continuum. Horizontal and vertical box plots indicate OnF and LGR5+ SC module score enrichment, respectively (n = 3 independent organoid cultures per group). e–g, Scatter plot depicting cell state distribution along the SC–OnF phenotypic spectrum in the Broad (n = 36 patients) (e), SMC/KUL3 (n = 10 patients) (f) and Guangzhou (n = 5 patients) (g) cohorts. The horizontal and vertical box plots indicate OnF and SC module score enrichment, respectively. PT, primary tumor; Met, metastasis. In d–g, box plots show the center line as the median, box limits as the interquartile range (IQR: 25th to 75th percentiles), the whiskers the ±1.5× the IQR and individual points the outliers. The P values were calculated using two-sided, paired Student’s t-test comparing sample means. h,i, Proportions of cells expressing lineage-specific signatures of the indicated gastrointestinal tract tissues, in individual patients from the Broad (h) and SMC/KUL3 (i) cohorts: J, junction; M, mucosa; S, small; Sig, sigmoid; Trans, transverse. j–l, Correlation between the OnF and lineage plasticity scores (Methods) in the Broad (j; n = 36 patients), SMC/KUL3 (k; n = 10 patients) and Guangzhou (l; n = 5 patients) normal CRC-matched cohorts, respectively. Two-sided Pearson’s correlation for significance is used. m, Schematic model depicting the evolution of the phenotypic spectrum of neoplastic SCs throughout CRC progression. In b–d, WT = 4,058 cells, A = 5,890 cells and AKSP = 10,946 cells. *P **P ***P ****P P values are given in Supplementary Table 7. Illustrations in a created using BioRender.com.
These genetically engineered models offer an ideal platform for accurately investigating cell state dynamics, free from confounding factors typically associated with human datasets, such as treatment exposure and inconsistent temporal sampling. Nevertheless, given the inherent genetic heterogeneity and microenvironmental diversity among patients, we defined a human OnF signature to investigate OnF reprogramming in patients with CRC (Methods and Supplementary Table 1f). Our analysis of matched normal colons and adenocarcinomas from the Cancer Genome Atlas Colon Adenocarcinoma (TCGA/COAD) dataset confirmed activation of the OnF program in CRC (Extended Data Fig. 2a). Moreover, single-cell analysis of the Broad and SMC/KUL3 CRC cohorts20,21 unequivocally demonstrated that the OnF state is significantly enriched in tumors (Fig. 1e,f). Further examination of 27 samples of matched primary tumors and liver metastases from five patients with CRC22 confirmed its persistence in metastatic tumors (Fig. 1g). Notably, patient stratification based on both mismatch repair (MMR) and APC mutation status proved that OnF reprogramming is a common feature in APCmut/MSS (microsatellite-stable) CRC (Extended Data Fig. 2b–d). These data address a long-standing ambiguity surrounding OnF reprogramming in WNT-driven CRC12,13,14,15,16,18,23,24 and indicate that lack of comparison to adjacent healthy tissue in previous studies led to inaccurate conclusions.
Despite the widespread occurrence of OnF reprogramming in CRC, its biological significance remains largely elusive. We reasoned that this developmental rewind may endow neoplastic cells with enhanced plasticity, enabling them to transcend their typical lineage restraints. Comparative transcriptomic analysis of CRC tumors and various developmental stages of the human gastrointestinal tract25 revealed remarkable similarities across tumors, fetal intestines, and adult stomach tissues (Extended Data Fig. 2e). Overall, we noticed a discernible shift in neoplastic tissue identity from its posterior colonic origins toward more anterior regions of the gut tube (Extended Data Fig. 2f). Further examination of single-cell transcriptomic data using lineage-specific signatures26 (Supplementary Table 1g) corroborated that CRC tumors have acquired a metaplastic multiregional identity (Fig. 1h,i). It is interesting that we noted a significant correlation between the OnF score and lineage plasticity, characterized by a loss of the original colonic identity and acquisition of noncanonical cell fates (Fig. 1j–l and Extended Data Fig. 2g–j).
Collectively, these findings reveal the prevalence of the OnF state in WNT-driven CRC and shed light on its functional significance. During tumor initiation, OnF reprogramming extends the plastic potential of neoplastic SCs beyond their normally restricted capability. The resulting phenotypic spectrum continues to broaden throughout disease progression, leading to lineage infidelity (Fig. 1m). These observations offer insights into why more advanced tumors often exhibit increased resistance to therapies.
Distinct roles of YAP and AP-1 in driving phenotypic plasticity
Despite the potential clinical relevance of OnF reprogramming, its molecular drivers remain poorly characterized. Activation of the Hippo pathway effector YAP (yes-associated pathway) in response to injury17,23 or tumor initiation23,24,27 induces fetal-like reprogramming. However, our data show a dynamic evolution of OnF states during CRC progression (Fig. 1c,d), indicating a more intricate regulation at play.
To investigate the molecular mechanisms underlying cell state dynamics in CRC, we analyzed the chromatin accessibility landscapes across its malignancy continuum (Extended Data Fig. 3a). Assay for transposase-accessible chromatin using sequencing (ATAC–seq) data revealed a striking evolution of chromatin landscapes across the adenoma–adenocarcinoma sequence. Although most changes induced by APC LoF at the premalignant stage were maintained, additional events emerged during the progression to cancer (Extended Data Fig. 3b). Unsupervised hierarchical clustering of ATAC–seq peaks identified two primary patterns of chromatin accessibility (Fig. 2a). Genomic regions in clusters 1 (c1) and 2 (c2) exhibited reduced and increased accessibility, respectively, in the mutant tumoroids (Fig. 2a and Supplementary Table 2a,b). The progressive nature of these changes reflects the dynamic evolution of neoplastic cell states in CRC (Fig. 1d). To examine their functional significance, we performed transcription factor (TF) footprinting analysis, using TOBIAS28, and calculated a ‘combined binding score’ to assess TF activity across the malignancy continuum (Methods). C1 was enriched for footprints of the caudal-related homeobox (CDX) and hepatocyte nuclear factor family (HNF) members (Fig. 2b,c and Extended Data Fig. 3c) involved in establishing the caudal identity of intestinal cells and their maturation, respectively29,30,31. The progressive reduction in activity of these TFs (Extended Data Fig. 3d,e) aligns with the gradual regression to a more primitive state and loss of intestinal identity during CRC evolution (Fig. 1). Intriguingly, we noted a significant decrease in the activity of several ligand-regulated nuclear receptors, including PPAR, RXR, LXR, VDR and FXR, all of which require retinoid X receptor (RXR) dimerization to become functional (Fig. 2b,c and Extended Data Fig. 3f–i).
Fig. 2: Distinct roles of YAP and AP-1 in OnF reprograming during CRC evolution.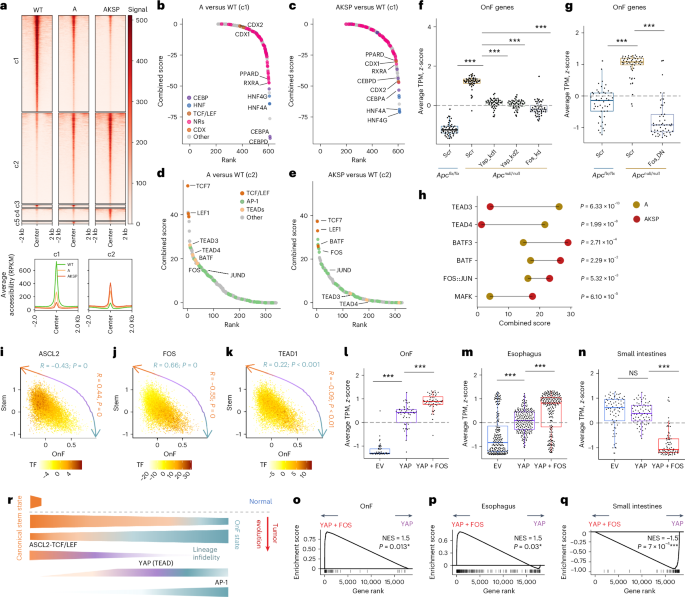
a, Heatmap of ATAC–seq signal in WT, A and AKSP organoids at genomic DARs (top). Average ATAC–seq signal profile ±2 kb is around the peak center in clusters c1 and c2 (bottom). RPKM, reads per kilobase million. b–e, Elbow plots showing TF activity in A versus WT (b and d) and AKSP versus WT (c and e) using DARs from clusters c1 (b and c) and c2 (d and e). For a–e, n = 2 independent organoid cultures per group. CEBP, CCAAT-enhancer-binding protein; NRs, nuclear receptors; BATF, basic leucine zipper transcription factor, ATF-like; JUND, JunD proto-oncogene, AP-1 transcription factor subunit. f,g, Relative OnF signature enrichment during tumor initiation following knockdown (kd) of YAP or FOS (f) or the ectopic expression of a dominant-negative (DN) FOS (g). Each data point is a gene in the OnF signature (n = 4 independent experiments; ***P h, Line plot of differential TF activity (combined score), from d and e, during CRC evolution. Two-sided, paired Student’s t-tests were used for significance. JUN, Jun proto-oncogene, AP-1 transcription factor subunit; MAFK, v-maf avian musculoaponeurotic fibrosarcoma oncogene homolog K. i–k, Motif activity of ASCL2 (i), FOS/AP-1 (j) and TEAD1 (k) in AKSP single cells across the SC–OnF phenotypic spectrum determined by chromVAR z-scores for the indicated TFs. The correlation coefficients between TF activity and the LGR5+ SC or OnF score are indicated in orange and green, respectively. Multiome data are from two independent organoid cultures (n = 11,030 cells). l–n, Relative enrichment of the OnF (l), esophagus (m) and small intestine (n) signatures in WT organoids following ectopic expression of YAP or YAP then FOS, sequentially. Each data point is a gene (n = 4 independent experiments; NS, not significant, ***P o–q, GSEA of OnF (o), esophagus (p) and small intestine (q) gene signatures in YAP overexpression (OE) versus YAP + FOS sequential OE organoids, relative to l–n. Two-sided, permutation-based test was used for significance; P values were adjusted via the Benjamini–Hochberg method. r, Model of phenotypic spectrum evolution in neoplastic cells during CRC progression highlighting key TFs at play. Various gradients of ASCL2, YAP and FOS activity are pivotal to establishing a phenotypic continuum in neoplastic cells. In the box plots in f, g and l–n, the center line is the median, the box limits the IQR (25th to 75th percentiles) and the whiskers the highest and lowest values within ±1.5× the IQR. *P ***P P values are given in Supplementary Table 8. NES, normalized enrichment score; TPM, transcripts per million.
In contrast, tumoroid-specific events in C2 were predominantly driven by three TF families (T cell factor/lymphoid enhancer factor (TCF/LEF), transcriptional enhanced associate domains (TEADs) and activator protein 1 (AP-1)) (Fig. 2d,e). TCF/LEF operates under canonical WNT signaling and, together with ASCL2, sustains the canonical LGR5+ state32. TEADs, on the other hand, are the cognate DNA-binding partners of YAP, recently implicated in transient activation of a fetal-like program after injury and in precancerous lesions16,18,23. Meanwhile, although AP-1 has been associated with promoting aggressiveness in various cancer types, including CRC33,34, its role in regulating neoplastic cell states remains largely unexplored. To investigate its potential implication in OnF reprogramming, we initially conducted HOMER motif analysis on promoter regions of OnF markers compared with a set of random genes. This revealed a significant enrichment of both TEAD- and AP-1-binding motifs in the former (Extended Data Fig. 3j). Next, we examined the effects of YAP and FOS (Fos proto-oncogene, AP-1 transcription factor subunit) depletion on OnF reprogramming (Extended Data Fig. 4a) and found that both perturbations were sufficient to impede OnF reprogramming after APC LoF (Fig. 2f, Extended Data Fig. 4b–d and Supplementary Table 2c). Stronger inhibition of AP-1 using a dominant-negative form of FOS led to a complete repression of the OnF program (Fig. 2g, Extended Data Fig. 4e and Supplementary Table 2d). Together, these findings support a cooperative model whereby AP-1 acts in concert with YAP to drive OnF reprogramming during tumor initiation.
Notably, although binding sites of both TFs became more accessible in precancerous tumoroids (A), accessibility of AP-1 target regions further increased in the advanced AKSP model (Fig. 2h), suggesting a more intricate interplay during tumor evolution. The dynamic shift in the activity of these TFs supports a role of AP-1 in expanding the OnF state during CRC progression (Fig. 1d). To achieve a deeper understanding of the molecular mechanisms governing the establishment of a phenotypic spectrum in CRC, we performed single-cell multiome (single-cell (sc)ATAC–seq + scRNA-seq) analysis on AKSP tumoroids. This simultaneous examination of the transcriptome and chromatin accessibility landscape at single-cell resolution allowed us to chart TF activity across neoplastic cell states. We first ranked cells along the SC–OnF phenotypic spectrum using scRNA-seq (Extended Data Fig. 4f,g). Then, we projected scATAC–seq cells on to this continuum and used chromVAR35 to map TF motif activity. This analysis revealed that the SC master regulator, ASCL2, and AP-1 (FOS) motif activities were most enriched at either extreme of the phenotypic spectrum, correlating with SC and OnF scores, respectively (Fig. 2i,j). It is interesting that TEADs exhibited a broader activity profile characteristic of transitional states (Fig. 2k). Moreover, we found a substantially higher correlation between AP-1 activity and lineage infidelity (Extended Data Fig. 4h,i). These data indicate that, although the transition to a continuum of hybrid states is predominantly facilitated by YAP, increased AP-1 activity reinforces the OnF state, enabling lineage plasticity.
To functionally validate the distinct roles of YAP and AP-1 in OnF reprogramming, we sequentially expressed a constitutively active YAP (S6A) and FOS in WT organoids (Extended Data Fig. 4j). It is interesting that ectopic YAP expression induced an upregulation of several AP-1 subunits (Fos, Fosl1, Fosl2, Atf3 and Batf2) (Extended Data Fig. 4k and Supplementary Table 2e) and initiated OnF reprogramming (Fig. 2l and Extended Data Fig. 4l–n). The subsequent addition of FOS further enhanced the OnF program (Fig. 2l,o), triggering lineage infidelity (Fig. 2m,n,p,q).
Collectively, these findings demonstrate that the phenotypic spectrum in CRC is governed by varying gradients of OnF and SC state drivers. They support an adaptive bet-hedging model in which the cooperative action of YAP and AP-1 serves as a molecular switch facilitating OnF reprogramming during tumor initiation. Further hyperactivation of AP-1 during CRC progression promotes phenotypic heterogeneity and unleashes lineage plasticity (Fig. 2r).
RXR is a gatekeeper of early OnF reprogramming
Next, we set out to determine the molecular mechanisms underpinning activation of the OnF drivers YAP and AP-1 in CRC. In the context of injury, inhibition of the nuclear receptor RXR sustains the typically transient fetal-like state by maintaining YAP in an active form26. However, the role of RXR during intestinal tumorigenesis remains unexplored.
To address this, we first investigated RXR deregulation in CRC. TCGA/COAD dataset analysis indicated significantly lower RXRa levels in CRC tumors compared with matched healthy intestinal tissues (Fig. 3a). Our murine CRC models revealed an early downregulation of Rxra after APC LoF (Fig. 3b). Together with the reduced accessibility of RXR target sites and those of its partners in precancerous tumoroids (Fig. 2b), these data indicate that RXR operates downstream of APC in CRC.
Fig. 3: Deregulation of an APC–RXR regulatory axis during tumor initiation establishes an OnF memory.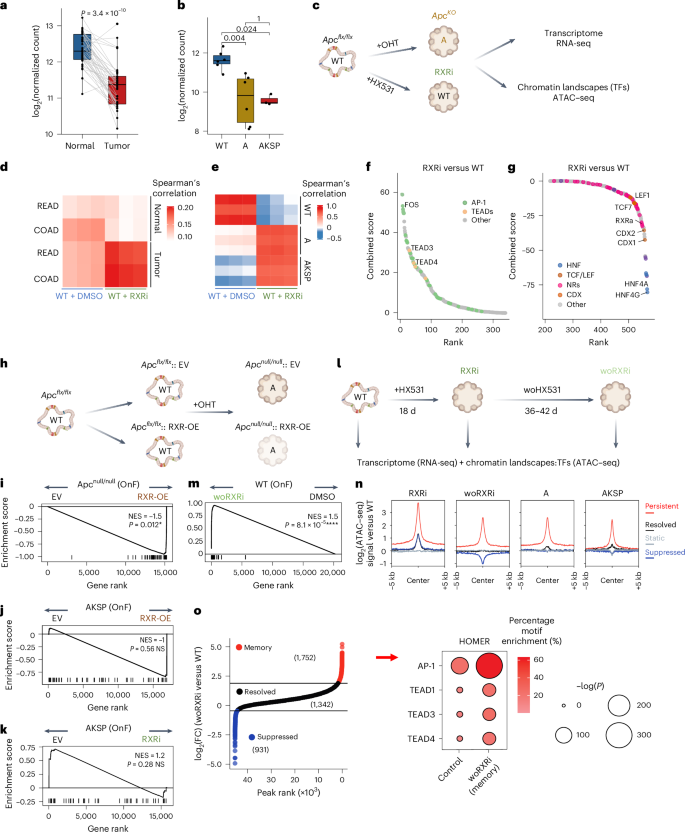
a, RXRa expression in matched human normal colon and tumors from TCGA/COAD (n = 41 patients). P values were calculated using two-sided, paired Wilcoxon’s test. b, Rxra expression during tumorigenesis (WT and A, n = 6 independent organoid cultures; AKSP, n = 3). The P values were calculated using two-sided, unpaired Wilcoxon’s test. In the box plots, the center line is the median, the box limits the IQR (25th to 75th percentiles) and the whiskers the highest and lowest values within ±1.5× the IQR. c, Experimental approach for the comparative analyses of Anull and RXRi (+HX531) versus WT organoids. d,e, Spearman’s correlation of the top 2,000 (d) or 1,000 (e) highly variable genes. READ, rectum adenocarcinoma. f,g, Elbow plots depicting TF activity in RXRi (f) versus WT organoids (g). TF combined binding score = −log10(P value) × log2(fold-change). Significantly more accessible or less accessible regions were used in f and g, respectively (WT, n = 2; RXR, n = 3 independent ATAC–seq experiments). h, Experimental design summary for Fig. 2i. i, GSEA of OnF genes following the APC–RXR axis perturbation during tumor initiation (n = 4 independent experiments). j,k, GSEA of OnF genes in CRC tumoroids (AKSP), following RXR-OE (j) or inhibition (RXRi) (k) (n = 4 and 3 independent experiments, respectively). l, Experimental design summary for Fig. 2m–o. m, GSEA of OnF genes >5 weeks post-RXRi washout (n = 3 independent cultures). In i–m, a two-sided permutation-based test for significance was used; P values were adjusted via the Benjamini–Hochberg method. n, ATAC–seq signal intensity in RXRi, woRXRi (>5 weeks post-HX531 withdrawal), A and AKSP versus WT organoids. o, Elbow plot of more accessible regions in RXR versus WT organoids ranked by their log2(fold-change) in woRXRi versus WT. Resolved peaks were subset to obtain the 1,342 regions (mean of number of suppressed and persistent regions) with log2(fold-change) closest to 0. The HOMER motif enrichment analysis indicates the top enriched TFBSs of the persistent ‘memory’ regions (>5 weeks post-RXRi washout (right)). n,o, RXR and woRXRi (n = 3 independent cultures; WT, A, AKSP, n = 2). FC, fold change. Illustrations in c, h and l created using BioRender.com.
Next, we conducted comparative analyses of RXR inhibition and APC LoF to determine whether RXR deregulation is responsible for activation of the OnF program during tumor initiation (Fig. 3c). Similar to APC depletion, treatment with the RXR antagonist HX531, hereafter referred to as RXRi, altered the budding structure of WT organoids, imposing a spheroid morphology (Extended Data Fig. 5a,b) reminiscent of fetal organoids19 and mutant tumoroids (Extended Data Fig. 5c). Transcriptomic analyses uncovered a striking resemblance between RXRi organoids and both human CRC and mouse tumoroids (Fig. 3d,e and Supplementary Table 3a). Furthermore, hallmarks of OnF reprogramming were significantly enriched in RXRi organoids (Extended Data Fig. 5d). Intriguingly, despite causing a similar block in differentiation, RXR inhibition induced a more prominent increase in OnF genes compared with APC depletion and did not result in the expansion of LGR5+ SCs (Extended Data Fig. 5e and Fig. 1b).
To better understand how RXR inhibition favors a complete reversion to an OnF-like state, we investigated its effects on global TF dynamics. Our ATAC–seq data revealed remarkable similarities in chromatin accessibility landscapes between Apc mutant tumoroids and RXRi organoids (Extended Data Fig. 5f–h). TF footprinting analysis (TOBIAS28) demonstrated that RXRi recapitulated most TF activity changes induced by APC LoF in tumorigenesis (Fig. 3f,g and Supplementary Table 3b), including reduced activity of retinoid X receptor alpha (RXRa) itself, CDX2 and HNF4 (Extended Data Fig. 5i–k).
Notably, RXR blockade induced a significant hyperactivation of the OnF TFs AP-1 and TEADs (Extended Data Fig. 5l,m) without activating WNT-related TFs (Fig. 3f,g and Extended Data Fig. 5n). HOMER analysis confirmed enrichment of the TCF/LEF DNA-binding motif in less accessible regions in RXRi organoids (Extended Data Fig. 5o and Supplementary Table 3c). These findings support a divergent regulation of the WNT signaling pathway (Extended Data Fig. 6a–c) after RXR inhibition and APC depletion. While hyperactivation of WNT signaling is known to reinforce the canonical SC state32,36, these data demonstrate that diminished RXR activity induces OnF reprogramming through activation of YAP and AP-1. Deregulation of both circuitries downstream of the gatekeeper APC (Fig. 2b,d and Extended Data Fig. 5o) elucidates the emergence of a continuum of neoplastic cell states during CRC tumorigenesis.
Consistent with these findings, blocking the APC–RXR regulatory axis through ectopic expression of RXRa impaired OnF reprogramming during tumor initiation (Fig. 3h,i and Supplementary Table 3d). Intriguingly, RXR perturbation in advanced AKSP tumoroids exhibited no significant effects on the OnF program (Fig. 3j,k and Supplementary Tables 3e,f), indicating its diminished relevance once the OnF state has been established. This suggests that early RXR deregulation, after APC LoF (Fig. 3b), is sufficient to epigenetically reprogram cells into an OnF state. Indeed, intestinal organoids temporarily exposed to RXRi largely maintained features of OnF reprogramming for >5 weeks post-inhibitor withdrawal (Fig. 3l,m). Intriguingly, although transcriptional changes were largely maintained, only a small fraction of chromatin accessibility changes persisted (Extended Data Fig. 6d,e and Supplementary Table 3g,h). Notably, the persistently more accessible regions were also more accessible in A and AKSP tumoroids (Fig. 3n). HOMER analysis of these ‘memory sites’ revealed a significant enrichment of YAP- and AP-1-binding motifs (Fig. 3o).
Together these findings indicate that RXR serves as a gatekeeper of OnF reprogramming during tumor initiation. Following its deregulation, YAP and AP-1 activation is sufficient to sustain the OnF state during tumor progression. Indeed, unlike RXR perturbation (Fig. 3j,k), knockdown of either YAP or AP-1 in VAKSP (Villin-Cre AKSP) tumoroids induced significant depletion of the OnF program (Extended Data Fig. 6f–h and Supplementary Table 3i).
Therapeutic relevance of the OnF state in CRC
In contrast to the well-characterized LGR5+ SC state in CRC, the functional relevance and potential therapeutic implications of the OnF state remain, to the best of our knowledge, unknown. Thus far, inference of the OnF state using transcriptional signatures has provided only a static snapshot of their presence. To comprehensively characterize the temporal dynamics of this cellular state, a well-defined and measurable tool is needed.
We have recently developed a new strategy to genetically trace cell fate transitions within a heterogeneous tissue37,38. To this end, we leveraged our in-depth understanding of the molecular underpinnings of the OnF program (Figs. 2 and 3) to construct a synthetic locus control region (sLCR) that contains specific cis-regulatory elements (CREs) reflecting the transcriptional output and activity of OnF state-associated TFs (Extended Data Fig. 7a,b and Supplementary Table 4a). Then, we fused this genetic tracing cassette to an enhanced green fluorescent protein (eGFP; Fig. 4a) to allow visualization and tracking of this cellular state. Flow cytometry analysis of WT organoids expressing this phenotypic reporter confirmed that only a small fraction of cells exhibited low-to-moderate levels of GFP expression (Extended Data Fig. 7c). In contrast, WT organoids treated with RXRi and tumor-derived VAKSP organoids displayed a notable shift in reporter activity, evidenced by a higher proportion of GFP+ cells and increased mean fluorescence intensity (Extended Data Fig. 7c,d). Moreover, transcriptomic analysis of sorted GFPhigh and GFP− cells from VAKSP tumoroids confirmed the enrichment of the OnF signature and markers of lineage plasticity in the former (Fig. 4b, Extended Data Fig. 7e and Supplementary Table 4b). These data support the validity and specificity of our phenotypic reporter as an effective tool for tracing OnF cells.
Fig. 4: Visualization and targeting of the OnF program in CRC.
a, Schematic of the OnF phenotypic reporter structure. PGK, phosphoglycerate kinase promoter; NEO, neomycin resistance gene. b, Experimental flow diagram (top) and gene-set enrichment in GFPhigh versus GFP− cells sorted from VAKSPOnF (Villin-Cre AKSP) tumoroids expressing the OnF reporter (bottom) (n = 3 independent sorts). c, Representative pseudocolor plots from flow cytometry of VAKSP tumoroids co-expressing OnF–GFP (y axis) and stem/STAR–mCherry (x axis) phenotypic reporters. VAKSPOnF/STAR tumoroids were treated with dimethyl sulfoxide or FOLFIRI for 3 days before analysis. d, Quantitative representation of flow cytometry data from c. In c and d, n = 3 independent experiments; error bars = s.d.; P values are by paired, two-sided Student’s t-tests. e, Heatmap reporting log2(fold-change) in WNT (left) and YAP or AP-1 (right) target gene expression (n = 3 independent experiments). f, Summary of the VAKSP tumoroid models used for functional studies. g,i, Schematic of the experimental strategy to genetically target the OnF state, stem state or both, either transiently (g) or persistently (i), relevant to h–j. h–j, Growth rate of subcutaneous VAKSP tumors with indicated reporter combinations, in response to DT treatment. Mean tumor volume ± s.e.m. The dotted lines indicate saline treatment (all models, n = 6 tumors). h, Dashed lines indicate transient DT treatment (5 d; 3 doses on alternate days): OnFDTR (n = 11), STARDTR (n = 9), OnFDTR/STARDTR (n = 10). j, The solid lines indicate persistent DT treatment, on alternate days, throughout the experiment: OnFDTR (n = 12), STARDTR (n = 11), OnFDTR/STARDTR (n = 9). Bottom, DT dosing schedule; the dashed red line indicates treatment duration. k, Schematic of the experimental strategy used in l. l, Dotted line, vehicle (n = 8 tumors); solid lines, DT (n = 6), FOLFIRI (n = 7) and DT + FOLFIRI (n = 8). Mice received three doses per week on alternate days. Values are mean tumor volume ± s.e.m. In h, j and l, the P values were calculated using a mixed-effects linear model with Tukey’s adjustment for multiple comparisons (two sided). m–p, Heatmaps showing percentage viability of VAKSP tumoroids with the indicated drug combinations. A single dose of MRTX1133 and IAG933 was used in n and p, respectively. The effects of these single doses of each drug are highlighted in m (MRTX1133) and o (IAG933), respectively. IC, inhibitory concentration. q, Dot plot indicating the combination index from drug combinations in m–p. The P values were calculated using two-sided, paired Student’s t-tests. In m–q, n = 3 independent experiments. Illustrations in b, g, i and k created using BioRender.com.
Next, to investigate the intricacies of their potential interplay with LGR5+ SCs, we sought to develop a tracing system that enables simultaneous tracking of both populations. To this end, we replaced the OnF sLCR cassette with the STAR minigene39 driving mCherry expression (Extended Data Fig. 7f) and generated a tumoroid line that expressed both reporters (VAKSPOnF/STAR). This strategy allowed us to visualize the continuum of neoplastic phenotypes (Extended Data Fig. 7g).
To trace cell state dynamics under therapeutic pressure, we treated VAKSPOnF/STAR tumoroids with FOLFIRI, a chemotherapy regimen commonly employed in clinical settings. Flow cytometry analysis of reporter activity revealed a significant enrichment of hybrid states at the expense of canonical SCs (Fig. 4c,d). This observation is consistent with the upregulation of key OnF markers and YAP or AP-1 target genes, alongside reduced expression of WNT-related genes (Fig. 4e, Extended Data Fig. 7h and Supplementary Table 4c). In contrast, the GFPhigh OnF population was largely preserved, suggesting intrinsic resistance.
To further investigate the response of these cell states to current therapies, we sorted individual clones from each population (GFPhigh, hybrid, and mCherryhigh) (Extended Data Fig. 7i) and treated their respective cultures with FOLFIRI. Although cells with an active OnF program (GFP+–OnF state and GFP+/mCherry+–hybrid state) remained largely unaffected under therapeutic pressure (Extended Data Fig. 7j,k,m–p), we noted a significant depletion of LGR5+ cells, which coincided with the enrichment of hybrid cells (Extended Data Fig. 7l,q,r). These findings confirm the key role of the OnF program in driving drug-tolerant states (that is, pure OnF or hybrid states) in CRC. Intriguingly, in the absence of treatment, we observed marginal phenotypic fluctuations in the sorted clones, indicating plasticity among neoplastic states (Extended Data Fig. 7i,m,o,q). Therefore, it is possible that activation of the OnF program in canonical SCs may contribute to adaptive resistance.
To investigate resistance mechanisms in human CRC, we used three independent patient-derived organoids (PDOs) (colo13, colo31 and colo41) exhibiting varying sensitivity levels to treatment (Extended Data Fig. 8a). Consistent with our findings in mouse tumoroids, exposure to FOLFIRI led to increased expression of OnF genes across all PDO lines, albeit to varying degrees (Extended Data Fig. 8b). Notably, colo13 displayed a more consistent upregulation of OnF markers and a conspicuous depletion of canonical SC markers and WNT target genes (Extended Data Fig. 8c), indicating a greater potential for adaptability. It is interesting that, although YAP activation levels were comparable across all PDOs, we observed a stronger activation of AP-1 targets in colo13 (Extended Data Fig. 8d). These data support a pivotal role of AP-1 in driving phenotypic plasticity and therapy resistance in CRC.
Although these findings underscore its potential therapeutic significance, the consequences of targeting the OnF state have yet to be uncovered. Previous studies provided unexpected evidence that ablation of the LGR5+ cells altogether is insufficient to achieve a durable regression of CRC6,7, which suggests that targeting their phenotypic plasticity alone is not enough to overcome resistance. Our data from organoid models (Fig. 4c,d and Extended Data Fig. 7j–l) imply that, in such scenarios, the pre-existing OnF cells may play a crucial role in sustaining tumor growth. To test this hypothesis, we developed a diphtheria toxin (DT) receptor (DTR)-expressing version of the OnF and canonical (STAR+) SC-tracing cassettes. We then generated VAKSP tumoroids that express various combinations of these reporters to allow selective attrition of either or both cellular states (Fig. 4f). In the absence of DTR expression, DT treatment did not affect cellular composition or viability of VAKSPOnF/STAR tumoroids (Extended Data Fig. 8e,f). However, the respective target populations, including hybrid cells, were efficiently ablated in the DTR+ models (Extended Data Fig. 8e,f).
To investigate the therapeutic potential of targeting the OnF state in CRC, we transplanted the different VAKSP reporter lines (Fig. 4f) into the flanks of immunocompromised mice. We first allowed tumors to reach a relatively large volume (350-400 mm3) before administering DT every other day for 5 days (Fig. 4g). Consistent with previous work6,7, selective ablation of cells with an active LGR5+ program led to tumor stasis in the VAKSPSTAR-DTR model, followed by prompt regrowth on DT cessation (Fig. 4h). More importantly, attrition of OnF+ cells halted tumor growth transiently but was not sufficient to induce tumor regression (Fig. 4h). In contrast, co-targeting both cell states resulted in tumor shrinkage and delayed resurgence significantly (Fig. 4h). It is interesting that sustained depletion of either OnF+ or STAR+ cells alone using continuous DT treatment (Fig. 4i and Extended Data Fig. 8g) failed to maintain tumor stasis indefinitely (Fig. 4j), suggesting that either population can fuel tumor growth in the absence of the other. However, we noted a prominent tumor regression in the VAKSPOnF-DTR/STAR-DTR model that was maintained for as long as DT treatment continued (Fig. 4j).
In the light of these findings, we reasoned that targeting the OnF program could sensitize tumors to chemotherapies, offering substantial clinical benefits. To test this hypothesis, we investigated the combined effects of FOLFIRI and DT on VAKSPOnF-DTR tumoroids in vivo (Fig. 4k). Although each treatment alone reduced tumor growth, their combination resulted in a durable tumor regression throughout the treatment period (Fig. 4l).
It is interesting that pharmacological inhibition of either YAP–TEAD with IAG933—a potent first-in-class and selective disruptor of the YAP–TEAD interaction40—or AP-1’s upstream regulator KRAS with the selective KRASG12D inhibitor MRTX1133 (ref. 41), marginally improved VAKSP tumoroid response to FOLFIRI (combination index (CI) = 0.96 and 0.94, respectively) (Fig. 4m,o,q). However, the trio combinations were highly synergistic (CI = ~0.40) (Fig. 4n,p,q), indicating that concurrent inhibition of YAP and AP-1 is key to enhancing the effectiveness of FOLFIRI. These data further support the cooperative, yet distinct, functions of both TFs or pathways in regulating the OnF program (Fig. 2).
Collectively, our findings shed light on the functional interplay between the canonical (LGR5+) SC and noncanonical OnF states. Unexpectedly, we found that the LGR5+ state is sensitive to FOLFIRI and tumors require an active OnF program to survive treatment. Importantly, the clinical relevance of each population in isolation is limited by their functional redundancy. However, we provide evidence that targeting the OnF program is key to enhancing effectiveness and durability of the current standard of care (SOC) in mouse models and patient-derived CRC tumoroids.