Transcriptomic analysis for identification of exercise-induced myokines
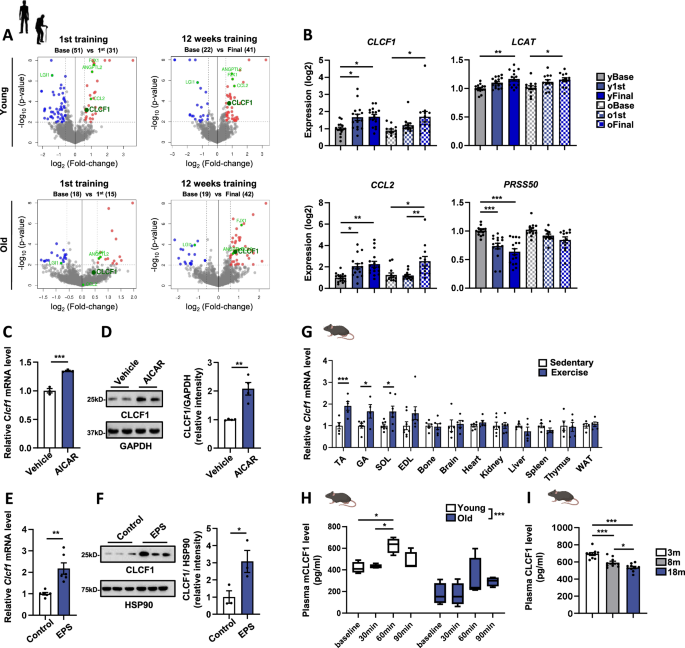
To identify the exercise-induced myokines, transcriptomic data (GSE28422)13 were analyzed using ‘GEOquery v2.60.0’ and ‘LIMMA v3.48.3’ in the R environment (v4.2). We followed the GEOquery-LIMMA pipeline to obtain and normalize the expression data, followed by the identification of differentially expressed genes in age groups between before and after exercise (p-value 1.5). To examine the expression of secretory protein genes, a list of predicted secretory proteins was downloaded from The Human Protein Atlas (2933 genes as of May 2022) at https://www.proteinatlas.org/humanproteome/tissue/secretome, and their expression fold-change values and p-values were extracted from the differential expression analysis result between pre- and post-exercise samples obtained earlier. Volcano plots were generated by the ‘ggplot2 v3.3.6’ package in R.
Ethics
Human cohorts 1–4 were conducted as Basic Experimental Studies involving Humans (BESH), and participants were not enrolled in a clinical trial. All procedures were approved by the relevant institutional review boards and were conducted in accordance with the Declaration of Helsinki. Human cohort 5 consisted of previously collected samples from a published study62, which reported the primary outcomes and was not considered a clinical trial. Human studies 1, 3, 4, and 6 were approved by the Institutional Review Board (IRB) at Pusan National University (IRB protocol number PNU_2021_140_HR). Human study 2 was approved by the IRB at Inha University (170621-1AC). Human study 5 was approved by the IRB at Seoul National University (SNUIRB no.1305/001-009). Written informed consent was obtained from all participants.
Human cohorts
Human study 1 (Young adults_acute resistance exercise): Ten young, active males (age 25.33 ± 1.837 years; height 178.4 ± 1.913 cm; weight 76.08 ± 2.983; BMI 23.84 ± 0.5952 kg/m2) males recruited to partake in this study. Participants were compensated with a monthly gym membership worth 45,000 won. Participants trained at a moderate intensity corresponding to 50–69% of their one-repetition maximum (1-RM), which is the heaviest weight they could lift for one repetition in this exercise. The exercise program is described in Table S1. Participants fasted for at least 8 h prior to exercise. Blood samples were collected before exercise and 1 h post-exercise.
Human study 2 (Young Jiu-Jitsu athletes_High-intensity interval exercise): Participants were selected based on the following criteria: a minimum of 4 years of Jiu-Jitsu training, training at least 4 days per week, a minimum of 8 h of training per week, and a history of placing in national Jiu-Jitsu competitions. Participants were compensated 200,000 won over the course of the study. Blood samples were collected from young Jiu-Jitsu athletes (age: 28.25 ± 3.62; height 176.63 ± 3.58 cm; weight 76.76 ± 8.62 kg; BMI 24.59 ± 2.48 kg/m²) before and immediately after completing the 4 rounds of the exercise program in a previous study by Park et al.63. Briefly, the high-intensity interval resistance exercise program, designed to mimic match conditions and induce exhaustion, consisted of six exercises, each performed for 1 min, followed by a 12-min rest period, and repeated for a total of 4 rounds. The exercises were: 1. Bar Cross Lateral Jump and Sprawl, 2. Bar hanging kimono holding, 3. 4-Step turtle control in the top position, 4. Gi grip jump over and roll back from the top position on the turtle, 5. Jump over the vaulting horse and tackle, 6. Rolling drill between the legs.
Human study 3 (Young adults_acute aerobic exercise): Ten young, active males (age 25.98 ± 1.74 years; height 175.9 ± 1.53 cm; weight 75.38 ± 2.53 kg; BMI 24.44 ± 0.98 kg/m²) participated in this study. Participants were compensated with a monthly gym membership worth 45,000 won. Participants fasted for a minimum of 8 h prior to exercise and then exercised on a treadmill for 60 min at a moderate intensity (heart rate between 40% and 59% of their maximum). The exercise program is described in Table S2. Blood was collected at rest before and one hour after exercise to evaluate plasma CLCF1 levels.
Human study 4 (Older adults_Chronic resistance training): Twenty-seven female older participants (age 72.32 ± 0.9484 years; height 155.7 ± 0.8637 cm; weight 60.04 ± 1.257 kg; BMI 24.79 ± 0.5447 kg/m²) participated in this study (details provided in Table S3). Participants were compensated with a monthly gym membership worth 45,000 won. Older participants exercised at 30~49% of 1-RM (light intensity) for one hour per day, 5 times per week for 16 weeks. Blood samples were collected from all participants the day after the final exercise session, following a minimum of 8 h of fasting. The exercise program is described in Table S4.
Human study 5 (Older adults_Chronic resistance band exercise): Blood samples were collected in a project investigating the effect of 12 weeks of elastic band-based high-speed power training on cognition and muscle function in elderly participants (n = 14, age 75.0 ± 3.46 years), as described in a study by Yoon et al.62. As a reward for their participation, participants were provided with exercise elastic bands and received personalized feedback on their exercise performance and blood test results. Briefly, the intensity was set by adjusting the length of the green elastic band (Hygenic Corporation, Akron, OH, USA). Participants engaged in a 12-week exercise program, completing two weekly 60-min sessions (Tuesday and Thursday). Each session included a 10-min warm-up, 40 min of elastic band training, and a 10-min cool-down period. Blood samples were collected before and after a 12-week exercise program in elderly participants. Following a minimum of 8 h of fasting, blood samples were collected from all participants the day after they completed the final exercise session.
Human study 6 (Plasma levels of CLCF1 in young and elderly subjects): To measure basal CLCF1 levels in young and elderly individuals, we utilized pre-exercise plasma samples from Human studies 1–5, along with additional plasma samples from 16 healthy young individuals and 10 healthy elderly individuals (age: 73.36 ± 4.69; height 153.57 ± 3.14 cm; weight 54.13 ± 4.12 kg; BMI 22.72 ± 1.92 kg/m²).
Animals
All animal experiments conducted in this study were approved by the Animal Care and Use Committee of the Korea Research Institute of Bioscience and Biotechnology (KRIBB). The mouse strains used in the experiments were of the C57BL/6J background. Young mice (3 months old), middle-aged mice (8 months old), and aged mice (18–24 months old) were obtained from the Laboratory Animal Resource Center (KRIBB). The mice were housed in cages maintained at 22–24 °C under a 12-h light/12-h dark cycle and were provided with free access to food and water. All mice were euthanized by CO2 inhalation followed by cervical dislocation. Serum and tissue samples were subsequently collected.
Generation of CLCF1-CRF1 TG mice and Clcf1-skeletal muscle-specific knockout mice
CLCF1 transgenic C57BL/6N mice were generated (Macrogen, Seoul, Korea). To facilitate efficient secretion, CRLF1 acted as a chaperone for CLCF140. A G4Sx3 linker was used to fuse CLCF1 with CRLF1. The cytomegalovirus (CMV) promoter was utilized to drive the expression of the Clcf1_G4Sx3_Crlf construct. Subsequently, the resulting plasmid, CMV_Clcf1_G4Sx3_Crlf_IRES_EmGFP, underwent digestion using NruI and PsiI enzymes to isolate the transgenic cassette. This expression cassette was purified and delivered through pronuclear injection into mouse zygotes with a C57BL/6N genetic background.
In order to create mice with skeletal muscle-specific Clcf1 deletion, mice harboring the conditional Clcf1 floxed allele were generated from Clcf1tm1a(EUCOMM)Wtsi ES cells obtained from EUCOMM. The floxed Clcf1 mice were kindly provided by the Korea Mouse Phenotyping Center (KMPC). They were bred with Flp recombinase mice to get homozygous Clcf1 floxed breeders. These breeders were crossed with Mlc-Cre mice to produce a strain of mice that lack Clcf1 specifically in their skeletal muscles.
Plasma sample assays ELISA
Blood samples were collected into tubes containing the anticoagulant EDTA (Greiner Bio-One, 450542) to prevent coagulation. The collected blood was then centrifuged at 1000 × g for 10 min at 4 °C to separate the plasma. After centrifugation, the plasma was carefully collected into new tubes to avoid contamination with cellular components and stored at −80 °C until further analysis. The concentration of CLCF1 in the plasma was measured using an enzyme-linked immunosorbent assay (ELISA) kit (USCN, SEC389Hu; Mybiosource, MBS762838) according to the manufacturer’s instructions. Mouse and human plasma samples were diluted 5-fold prior to performing the ELISA experiments. Samples were incubated at 37 °C for 1 h, followed by three washes with PBST (1 × PBS containing 0.05% Tween 20). The secondary antibody was diluted at 1:1000 in dilution buffer and incubated for 1 h. The plates were then washed three times with PBST, followed by incubation with TMB substrate solution at 37 °C for 20 min. The reaction was stopped by adding the Stop Solution. All samples and standards were assayed in duplicate, and absorbance was measured using a microplate reader.
Cell culture
The C2C12 mouse muscle cell line (ATCC, #CRL-1772) was maintained in a humidified incubator at 37 °C with 5% CO2 and cultured in Dulbecco’s modified Eagle’s medium (DMEM) supplemented with 10% fetal bovine serum (FBS) and penicillin/streptomycin (100 U/mL, 100 μg/mL). To induce differentiation, C2C12 cells were grown in DMEM containing 2% FBS and 1% penicillin/streptomycin (Pen/Strep) until they formed myotubes. 3T3-L1 cells were differentiated in DMEM supplemented with 10% FBS, 1% Pen/Strep, and MDI (5 mM isobutylmethylxanthine (IBMX), 5 μg/mL insulin, and 1 μM dexamethasone) for 2 days following cell confluence. The cells were then maintained in medium containing 5 μg/mL insulin for an additional 2 days.
Primary osteoblast precursor cells were isolated from neonatal mouse calvariae using enzymatic digestion. The first set of cells following an initial treatment of calvariae for 10 min at 37 °C with 0.1% collagenase (Life Technologies, Carlsbad, CA) and 0.2% dispase II (Roche Diagnostics GmbH, Mannheim, Germany) were discarded. Primary osteoblast precursor cells were isolated from clavariae by sequential enzymatic digestion with collagenase for four 10-min periods. Osteoblast differentiation was then induced using osteogenic medium (OGM) containing 100 ng/mL BMP2, 50 μg/mL ascorbic acid, and 100 mM β-glycerophosphate for 3 or 6 days. ALP activity analysis was performed on day 3 of osteogenic differentiation. The following lysis of cells using an osteoblast lysis buffer [50 mM Tris-HCl (pH 7.4), 1% Triton X-100, 150 mM NaCl, and 1 mM EDTA], cell lysates were incubated with p-nitrophenyl phosphate substrate (Sigma-Aldrich, St Louis, MO) and ALP activity was determined by measuring the absorbance at 405 nm using a spectrophotometer. The alizarin red staining was performed after 6 days of osteogenic differentiation. The cultured cells were fixed with 70% ethanol and treated with a 40 mM alizarin red (pH 4.2) for 10 min. The stained culture was visualized with a CanoScan 9900F (Canon Inc., Japan), and then alizarin red was extracted with 10% acetic acid to quantify the substrate calcification. The concentration of alizarin red was determined by measuring the absorbance at 405 nm using a spectrophotometer.
Bone marrow cells were isolated from the long bones of ICR mice by flushing with α-MEM and incubated with a Red Blood Cell Lysis Buffer (Sigma-Aldrich, St. Louis, MO, USA). Bone marrow cells were cultured in α-MEM containing 10% FBS and antibiotics in the presence of M-CSF (30 ng/mL) for 3 days. Adherent cells (osteoclast precursors) were cultured in the presence of M-CSF and RANKL for 3 days. The cultured cells were fixed with 3.7% formalin and treated with TRAP staining solution (Sigma-Aldrich) for 10 min. The stained cells were visualized with a ProgRes CFscan camera (Jenoptik, Jena, Germany) and ProgRes Capture Pro software (Jenoptik). TRAP-positive multinucleated cells containing more than three nuclei were counted as osteoclasts.
Electrical pulse stimulation (EPS)
C2C12 myoblasts were seeded in six-well plates and differentiated into myotubes by culturing in differentiation medium (DMEM supplemented with 2% FBS) for 3 days. Following the differentiation period, the myotubes were subjected to electrical pulse stimulation (EPS) using the C-PACE EP culture pacer system (IonOptix, Dublin, Ireland) in a humidified incubator maintained at 37 °C with 5% CO2. The EPS protocol consisted of monophasic square wave pulses with a pulse duration of 2 milliseconds (ms) delivered at a frequency of 1 Hz. The voltage applied was 11.5 volts (V). Prior to the initiation of stimulation, cells were allowed to equilibrate in the stimulation setup for 1 h to recover from handling stress. Electrical stimulation was then applied continuously for 24 h under the specified conditions.
All stimulation parameters, including frequency, pulse width, and voltage, were optimized based on previous studies to mimic in vivo muscle contraction and ensure viability of C2C12 myotubes during prolonged stimulation.
Treadmill exercise
Mice underwent a gradual acclimatization process over two days, starting with a low incline and slow speed to familiarize them with the exercise equipment. Over the next two days, the incline was moderately increased while progressively extending the session duration. From day 5 onwards, the incline was further increased, and speed was slightly adjusted based on the mice’s tolerance. The objective was to push both young and aged mice near exhaustion without causing complete physical collapse. After exercise adaptation, all exercise bouts were performed at 70% of maximal speed on an incline greater than 5°. While young mice could easily maintain a speed of 24 m/min on a 10° incline, aged mice could only manage a speed of 15–18 m/min on a 5° incline. Each exercise bout was maintained for a total duration of 1 h. High-resistance running was defined as maintaining a speed of 24 m/min on a 10° incline. The chronic training protocol involved daily exercise sessions conducted over 30 consecutive days. Blood samples were collected from the mice before the exercise and immediately after the final exercise session.
Mitochondrial DNA contents
Genomic DNA was isolated from differentiated C2C12 myotubes using the Quick-DNA Miniprep Plus Kit (Zymo Research, D4068) according to the manufacturer’s instructions. Mitochondrial DNA (mtDNA) content was assessed by measuring the relative abundance of the mitochondrial gene ND1 to the nuclear gene HK2 using quantitative real-time PCR (qRT-PCR). The relative mtDNA content was calculated using the ΔCt method, where ΔCt = Ct(HK2) − Ct(ND1). Lower ΔCt values indicate a higher mitochondrial-to-nuclear DNA ratio. Primer sequences used for ND1 and HK2 are provided in Supplementary Table S6.
Glucose uptake and free fatty acid uptake assay
Glucose uptake was measured in vitro using differentiated C2C12 myotubes and 3T3-L1 adipocytes. After full differentiation, cells were serum-starved for 4 h in glucose-free DMEM prior to treatment. For stimulation of glucose uptake, cells were incubated with 1 μM insulin for 20 min at 37 °C. Following treatment, cells were washed with PBS, lysed, and analyzed using the Glucose Uptake Assay Kit (Abcam, ab136955) according to the manufacturer’s instructions. Absorbance was measured using a microplate reader at the recommended wavelength, and relative glucose uptake was quantified by interpolation from a standard curve. To measure free fatty acid (FFA) uptake, differentiated C2C12 myotubes and 3T3-L1 adipocytes were cultured in 96-well plates and treated with recombinant CLCF1 (100 ng/mL) for 24 h. FFA uptake was then assessed using the Free Fatty Acid Uptake Assay Kit (Abcam, ab176768), according to the manufacturer’s instructions. Briefly, after CLCF1 treatment, cells were incubated with a fluorescent fatty acid substrate provided in the kit, and uptake was measured using a fluorescence microplate reader at Ex/Em = 485/535 nm. Background signal was subtracted using control wells containing no cells, and relative fluorescence units (RFU) were normalized to total protein concentration per well. All experiments were performed in at least five independent biological replicates.
Glucose tolerance and insulin tolerance test
For glucose tolerance tests (GTT), mice were fasted overnight (10–12 h) before receiving an intraperitoneal injection of glucose at a dose of 2 g/kg body weight. Blood glucose levels were measured at 0, 15, 30, 60, 90, and 120 min using the ACCU-CHEK Performa test strip. Similarly, for insulin tolerance tests (ITT), mice were fasted for 4 h before receiving an intraperitoneal injection of insulin at a dose of 0.75 U/kg body weight. Blood glucose levels were measured at the same time points (0, 15, 30, 60, 90, and 120 min) using ACCU-CHEK Performa test strips. For both tests, blood samples were collected from the tail vein at the indicated time points.
Western blotting
Cells and tissues were lysed with RIPA buffer containing 0.1 mM Na3VO4, 1 mM NaF, 1 mM 4-(2-aminoethyl)-benzenesulfonyl fluoride hydrochloride (AEBSF), and 5 mg/ml aprotinin (Sigma-Aldrich). Total proteins were quantified using the BCA (bicinchoninic acid) assay kit and Bradford assay (Thermo Fisher, 23227). Protein samples were loaded on SDS-PAGE, transferred to polyvinylidene fluoride (PVDF) membranes and nitrocellulose (NC) membranes. The membranes were blocked for 1 h at RT with 5% skim milk or 2% BSA in Tris-buffered saline (TBS). The membrane was incubated with the respective primary antibodies at 4 °C overnight. All listed primary antibodies were used 1:1000. After washing with TBST, membranes were incubated with horseradish peroxidase (HRP)-conjugated secondary antibodies (1:5000–1:10,000) for 1 h at RT. The image was detected using the ChemiDoc (Thermo Fisher, iBright CL1500). All primary antibodies used in this study are listed in Supplementary Table S5, along with their sources and catalog numbers.
Retroviral gene transduction
Retroviral vectors were transfected into the packaging cell line, Plat E, using FuGENE 6 (Promega, Madison, WI) according to the manufacturer’s instructions. Target cells were plated on 48-well or 6-well plates 24 h prior to infection. Viral supernatants, collected from the culture medium 48 h after transfection, were then incubated with the target cells for 6 h in the presence of 10 μg/mL polybrene (Sigma-Aldrich, St Louis, MO, USA).
Immunocytochemistry
C2C12 myoblasts were seeded on 24-well plates and differentiated into myotubes. Myotubes were rinsed in PBS, fixed in 4% paraformaldehyde for 15 min at room temperature, and washed three times with PBS and permeabilized in 0.25% Triton X-100 in PBS for 10 min. The myotubes were blocked with 1% BSA in PBS containing 0.1% Tween 20 for 30 min and incubated with anti-MYH (sc-376157) in blocking buffer overnight at 4 °C, followed by Alexa Fluor 488 (#A-21121, Thermo Fisher) with 1% BSA in PBS for 1 h at room temperature. And the myotubes were incubated with Vectashield with DAPI mounting medium (VECTOR Laboratories) for 1 min in the dark. Images were captured using a Nikon Eclipse Ti-U inverted microscope and Nikon DS-Ri2 camera using NIS-Elements software. The short-axis diameters of myotubes were analyzed by Image J software.
Immunohistology
Muscles were mounted in optimal cutting temperature medium (O.C.T, Tissue-Tek) at resting length and frozen in dry ice and stored at −80 °C. Muscle sections (7 μm) were cut from the mid at −20 °C on a cryostat (Leica, CM1950) and collected on Micro Slides (MUTO, Japan) and stored at −80 °C. For immunofluorescence staining, serial sections were air-dried for 30 min and washed three times with PBS. Sections were blocked and permeabilized in PBS and 0.4% Triton X-100 for 30 min before being incubated for 2 h at room temperature in a primary antibody solution containing laminin (L9393, Sigma-Aldrich) and 10% goat serum (ab7481, Abcam) followed by Alexa555 (A32732, Invitrogen), Alexa555 (A28180, Invitrogen) in PBS containing 10% goat serum. Sections were washed three times in PBS and mounted with Vectashield with DAPI mounting medium (VECTOR Laboratories). Images were captured using a Nikon Eclipse Ti-U inverted microscope and Nikon DS-Ri2 camera using NIS-Elements software.
Quantitative RT-PCR (qPCR)
Total RNA was isolated from tissues and cells using RiboEx reagent (GeneAll Biotechnology Co., South Korea). cDNA synthesis was performed using the iScript cDNA synthesis kit (Bio-Rad). Quantitative RT-PCR analysis was performed using StepOnePlus (Applied Biosystems) with a 20 μl reaction volume containing cDNA, primers, and SYBR Master Mix (Applied Biosystems). The sequences of the primers used in this study are provided in Supporting Information, Table S6.
CLCF1 supplementation
3-month-old and 20-month-old C57BL6 mice were injected intraperitoneally with either recombinant CLCF1 (Abcam, ab50021 or Enzynomics, C045) or PBS (vehicle control) at a dose of 0.1 or 0.5 mg/kg body weight per day for 14 consecutive days.
eCNTFR production and supplementation
We used an engineered CNTFR (eCNTFR)18 to achieve effective blockade of CLCF1. This blockade requires both increased binding of the decoy to CLCF1 and decreased binding of CLCF1 to gp130 and LIFR. The eCNTFR-Fc recombinant protein, containing eight consensus mutations (R110Q, T174P, S237F, I287F, Y177H, K178N, T268A, D269A), was synthesized by Y-Biologics (Y-Biologics, Deajeon, South Korea). Mice were treated with eCNTFR-Fc (10 mg/kg) or PBS (vehicle) by i.p injection for 1 month, three times per week.
Production of CLCF1/CRLF1 protein complex
The human Cardiotrophin-like cytokine factor 1 (hCLCF1, Uniprot Q9UBD9) and human Cytokine receptor-like factor 1 (hCRLF1, Uniprot O75462) genes were amplified by PCR (Sogent, SPX16-R250). Amplicons were digested with BamHI (New England Biolabs, R0136) / XhoI (New England Biolabs, R0146) and inserted into the pcDNA3.4 vector (Thermo Fisher Scientific, A14697). A polyhistidine tag was placed at the C-terminus of CLCF1 for affinity chromatography. For transient expression of CLCF1/CRLF1 protein complex, Expi293FTM cells (Thermo Fisher Scientific, A14527) were cultured in Expi293TM expression medium (Thermo Fisher Scientific, A1435102). The cells were maintained in a humidified chamber at 37 °C with 8% CO2. ExpiFectamineTM 293 transfection kit (Thermo Fisher Scientific, A14525) was used following the manufacturer’s instructions for efficient transfection of Expi293FTM cells with plasmids. Briefly, the cells were diluted at a density of 1.7 × 10⁶ cells/ml in 300 ml of fresh media in 1 L Erlenmeyer shake flask (Corning, 7513). On the following day, DNA plasmids encoding hCLCF1 and hCRLF1 genes and ExpiFectamineTM 293 were separately mixed in Opti-MEMTM (Thermo Fisher Scientific, 31985070) and incubated at room temperature for 5 min. Then, the ExpiFectamineTM 293 and DNA mixtures were combined and incubated for another 20 min at room temperature. Finally, the mixture was added to flasks containing the cells and incubated in a humidified chamber at 37 °C with 8% CO2. After 18 h, a cocktail of Enhancer I and II was added to the flask. The cells were then incubated for 72~96 h, and the culture media were collected. Recombinant CLCF1/CRLF1 protein complex was purified by affinity and size exclusion chromatography using a fast protein liquid chromatography machine (FPCL) (Cytiva, ÄKTA Go system). The flited culture media was applied at a flow rate of 5 ml/min to the HisTrap Excel column (Cytiva, 17371205) previously equilibrated with 20 mM imidazole, 500 mM NaCl, and 20 mM Na2HPO4 at pH 7.4. Unbound proteins were washed away with 50 ml equilibration buffer. Bound fractions were eluted with 75 mL elution buffer containing a 20-to-500 mM imidazole gradient in 20 mM Na2HPO4 and 500 mM NaCl at pH 7.4 for 15 min. The protein complex was collected, pooled, and analyzed by SDS-PAGE. The eluted proteins were polished by SEC on an FPLC machine using a HiLoad 16/600 Superdex 200 pg (Cytiva, 28989335) previously equilibrated with PBS (pH 7.4) at a flow rate of 0.5 ml/min. Finally, Fractions containing CLCF1/CRLF protein complex were collected, pooled, and analyzed by SDS-PAGE and immunoblot analysis.
Glycolysis measurement and oxygen consumption rate
Oxygen consumption rates of C2C12 myotube cells, seeded at a density of X cells/well in a 96-well cell culture plate, were recorded on an XF96 Extracellular Flux Analyzer using the XF Cell Mito Stress Test Kit (Seahorse Bioscience, North Billerica, MA) according to the manufacturer’s protocol. Following seeding, cells were washed and pre-incubated in XF DMEM media (pH 7.4) for 1 h prior to the assay. The XF Cell Mito Stress Test was then performed according to the manufacturer’s protocol. Oligomycin (1 μM), FCCP (2 μM), and rotenone & antimycin A (0.5 μM each Rot/Anti) were added as indicated. All measured values were normalized to total protein content, which was quantified using the BCA protein assay.
siRNA transfection
C2C12 cells were seeded in 24-well plates with 1 × 10⁵ cells per well and then differentiated into myotubes for 4 days using a differentiation medium (2% FBS DMEM). At 3 days during differentiation, myotube was transiently transfected with siRNA control (Dhamacon, ON-TARGET plus siRNA) or siRNA Cntfr, Il6st (gp130), and Lifr using Lipofectamin RNAiMAX reagent (Thermo Fisher Scientific, USA) according to the manufacturer’s protocols. Primary osteoblast precursor cells or osteoclast precursor cells were transfected with siRNA control, siRNA Stat1, or siRNA Stat3 (Dhamacon, ON-TARGET plus siRNA) using Lipofectamine RNAiMAX (Thermo Fisher Scientific, USA), according to the manufacturer’s instructions.
Skeletal muscle function explorationTime and distance to exhaustion
After five consecutive days of acclimation, running performance was tested in mice by measuring their ability to run until exhaustion. Mice were exercised on a treadmill at 10 m/min for 10 min, and the speed was increased every 2 min by 2 m/min until 24 m/min. Mice were considered to be exhausted when mice remained on the electric shock grid for more than 10 s. Time and distance were recorded and calculated.
Strength by grip test
Mice were allowed to grasp an angled grid with all four limbs. They were then gently pulled backwards until they lost their grip, for a total of three attempts. The force (in Newtons) applied to the grid during each attempt was recorded. The average of these three measurements was then normalized to the body weight of each mouse.
Inverted grid test
Mice were placed in the center of a wire grid system, which was then inverted and held steadily 40 cm above a padded surface. The latency to fall, measured by the time the mice spent hanging onto the grid system, was then recorded.
Ex vivo isometric force and fatigue measurements
Intact TA muscles were isolated from the hindlimb of euthanized mice and mounted vertically between a force transducer (Model FT03, Glass Instruments, USA) in an organ bath with platinum electrodes and continuous perfusion with 95% O2 + 5% CO2-saturated Krebs–Ringer solution (118 mM NaCl, 4.75 mM KCl, 24.8 mM NaHCO3, 1.18 mM KH2PO4, 2.5 mM CaCl2 ∙ 2H20, 1.18 mM MgSO4, and 10 mM glucose). Optimal muscle stretch was determined by applying a single twitch at a supramaximal voltage of 100 V for 1 ms, and set at the length that generated maximal twitch force after 10 min of equilibration, TA muscles were tested with a range of stimulation frequencies (tetanic with increasing frequencies from 30 to 200 Hz every 500 ms, with 2-min recovery intervals between each frequency). The fatigue properties of the TA muscles were assessed by repeated stimulation at 1 Hz and 100 V for 10 min. All experiments were conducted at 25 °C. Data acquisition and analysis were performed using LabChart Pro Software (Version 8; AD Instruments, Pty Ltd.). At the end of each experiment, muscle length, diameter, and wet weight were measured.
RANKL-induced bone loss and ectopic bone formation
For the RANKL-induced bone loss mouse model64, 7-week-old male ICR mice were divided into three groups: PBS, RANKL with PBS, and RANKL with CLCF1. PBS or CLCF1 (0.2 mg/kg) was intraperitoneally injected for 4 consecutive days. From the second day, PBS, RANKL with PBS, or RANKL with CLCF1 was intraperitoneally administered for 3 consecutive days. For the ectopic bone formation model, a sponge soaked with BMP2 (1 µg) and PBS or a sponge soaked with BMP2 (1 µg) and CLCF1 (1 µg) was subcutaneously implanted on the left or right side, respectively, of 5-week-old male ICR mice. After four weeks, all sponges were collected from mice and then subjected to micro-computed tomography analysis.
Micro-computed tomography (μCT) analysis
Distal femurs were scanned with a SkyScan 1172 system (SkyScan, Kontich, Belgium) using the following parameters: 50 kV, 201 μA, 0.5 mm aluminum filter, and a resolution of 11 μm per pixel. Images were captured every 0.7° over a 180° angular range. The raw images were reconstructed into serial cross-sections using NRecon 1.4 (SkyScan) for analysis of femoral morphometric parameters. CTAn (SkyScan) and Ant 2.4 (SkyScan) software were used for further data analysis and 3D model visualization, respectively.
Histological analysis
Harvested tibias from mice were fixed with 4% paraformaldehyde overnight, followed by decalcification in 3.8% formaldehyde buffer containing 5.5% EDTA for 3 weeks at 4 °C. Decalcified tibias were dehydrated and embedded in paraffin blocks. The paraffin blocks were cut into 4-μm-thick longitudinal sections. The sectioned samples were deparaffinized using xylene and subjected to tartrate-resistant acid phosphatase (TRAP) staining to identify osteoclasts located below the growth plate and hematoxylin & eosin (H&E) and Runx2 (ab192256, Abcam) staining to identify osteoblasts located below the growth plate.
Statistical analysis
All data here are expressed as the mean + standard error of the mean (SEM). Statistical analyses were performed using Student’s t-test (two-tailed paired or unpaired), one-way ANOVA followed by the post hoc Bonferroni’s and Tukey’s test, or two-way ANOVA followed by the post hoc Bonferroni’s and Tukey’s test with GraphPad Prism 10 software (GraphPad Software). p-values less than 0.05 (* or #), 0.01 (** or ##) or 0.001 (*** or ###) were statistically significant.
Reporting summary
Further information on research design is available in the Nature Portfolio Reporting Summary linked to this article.