Streblid and nyteribiid fly infestation in bat hosts
Between 2019 and 2022, a total of 1042 bats representing 28 species across seven families were examined for bat fly infestations (Table 1). The results revealed that 298 bats (28.59%) were infested with bat flies. Streblidae were the predominant ectoparasite (n = 737), with Hipposideros bicolor and H. cineraceus exhibiting the highest infestation rates at 100% (12 out of 12 H. bicolor and 15 out of 15 H. cineraceus bats, respectively). Rhinolophus coelophyllus showed mixed infestations (streblid and nycteribiid), with an overall infestation rate of 56.7% (36/67 bats), predominantly by streblid-only (50.7%, 34/67), while nycteribiid-only and mixed infestations each accounted for 2.9% (2/67). Hipposideros gentilis exhibited a Streblidae-specific infestation rate of 47.5% (145/305), while Myotis siligorensis displayed a more diverse infestation profile, with 13% (9/69) attributed to streblid-only, 10.1% (7/69) to nycteribiid-only, and 20.3% to mixed infestations (14/69). Among species with low infestation rates, Craseonycteris thonglongyai, the smallest bat species in this study, had an infestation rate of 1.44%, with only two out of 139 individuals infested by bat flies. Similarly, Megaderma spasma exhibited a low infestation rate of 1.58%, with two out of 63 individuals infested. These two species demonstrated the lowest infestation rates among those studied, indicating limited exposure to bat flies. The details of bat fly infestations observed in this study are provided in Table S3. Additionally, this study identified a strong positive correlation (ρ = 0.79, p 2).
Table 1 Bat species composition, abundance, and infestation rates across eight study sites in Thailand (2019–2022)Fig. 2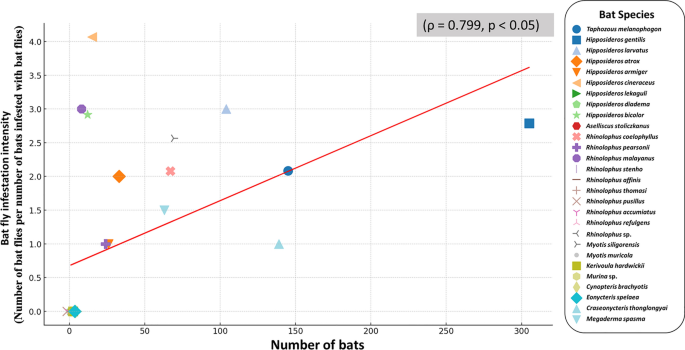
Relationship between bat population size and the number of infested bats. Each point represents a bat species, with the x-axis indicating the total number of bats and the y-axis representing the corresponding number of infested individuals
Bat fly infestation by sex, study site, and status of bat
The patterns of nycteribiid infestation across study sites, host sex, and physiological status are presented in Fig. 3 and Table S3. A total of 25 bats, representing two species (Myotis siligorensis and Rhinolophus coelophyllus), were infested with nycteribiid flies. The number of nycteribiids per bat ranged from one to four, with an average infestation rate of 1.44 nycteribiids per bat. The highest infestation rate was observed at Ma Gleua Cave, which accounted for 56% of the total infestations (14 out of 25 individuals), followed by Hintok Cutting (24%; 6 out of 25 individuals), Ma Now Phee Cave, and Khanom Electricity Generating Co., Ltd. (12% each, with three individuals from each site). Among the bat species, My. siligorensis hosted the majority of nycteribiids, accounting for 84% of all infestations (21 out of 25 individuals). Infestation patterns based on host sex revealed that male bats had higher infestation rates than females in both host species. Specifically, male My. siligorensis harbored 19 bat flies, whereas females had 12. Similarly, male R. coelophyllus carried four bat flies, while females carried only one. Additionally, 8% of the bats infested with nycteribiid flies were pregnant.
Fig. 3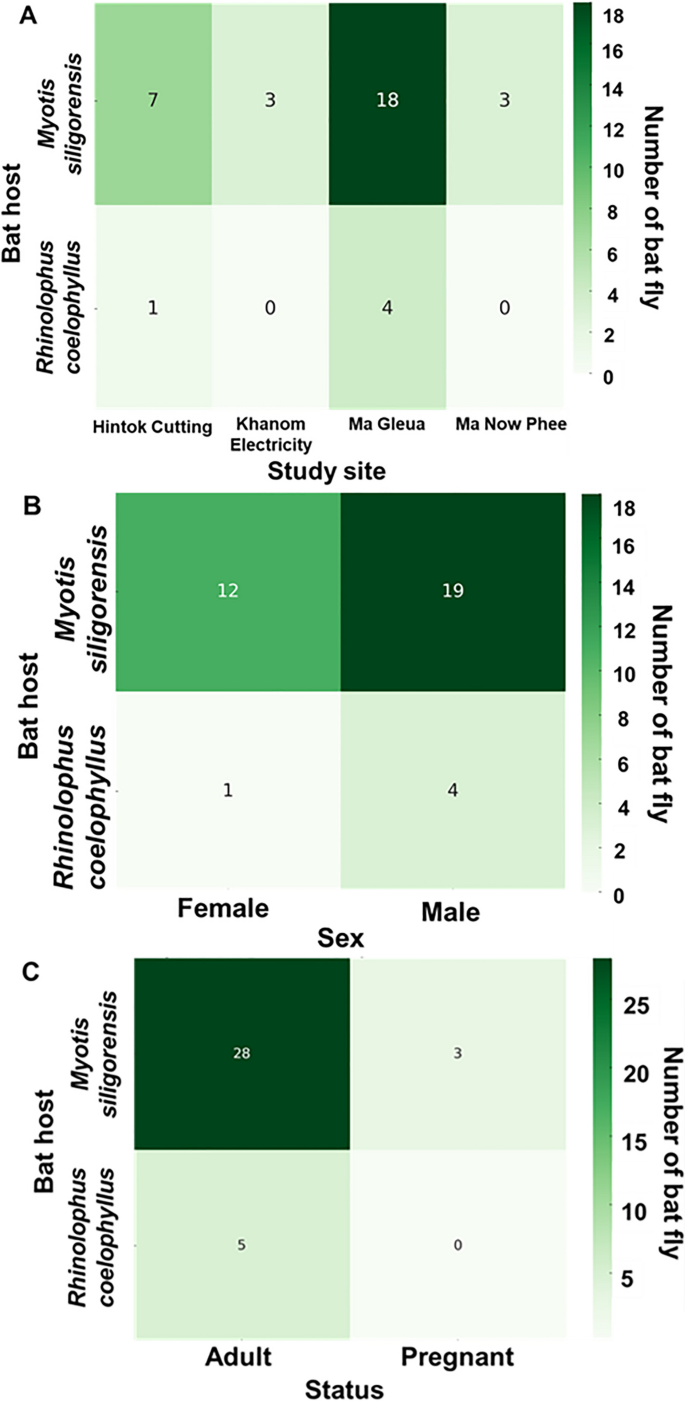
Distribution of host species infested by Streblidae across study sites (A), host sex (B), and reproductive status (C). The numbers inside the boxes in panels A–C indicate the number of bat flies. In panel C, the classification of adults by reproductive status includes all male and female bats except for pregnant females
The distribution of Streblidae infestations was also examined across study sites, host sex, and physiological status, as presented in Fig. 4 and Table S3. A total of 289 bats, representing 13 species, were identified as hosts of Streblidae flies. The number of streblids per bat ranged from one to 28, with a mean infestation intensity of 2.55 streblids per bat. Infestation prevalence showed significant spatial variation, with the majority of infestations recorded at Phra Cave (74.4%; 215/289), followed by Ma Gleua and Ma Now Phee. Infestation prevalence also varied by host sex, with males exhibiting a significantly higher proportion of infestations (61.9%; 179/289) than females (38.1%; 110/289). Moreover, adult bats accounted for 87.5% of all recorded infestations (253/289), whereas juveniles represented only a minor fraction (3.1%; 9/289).
Fig. 4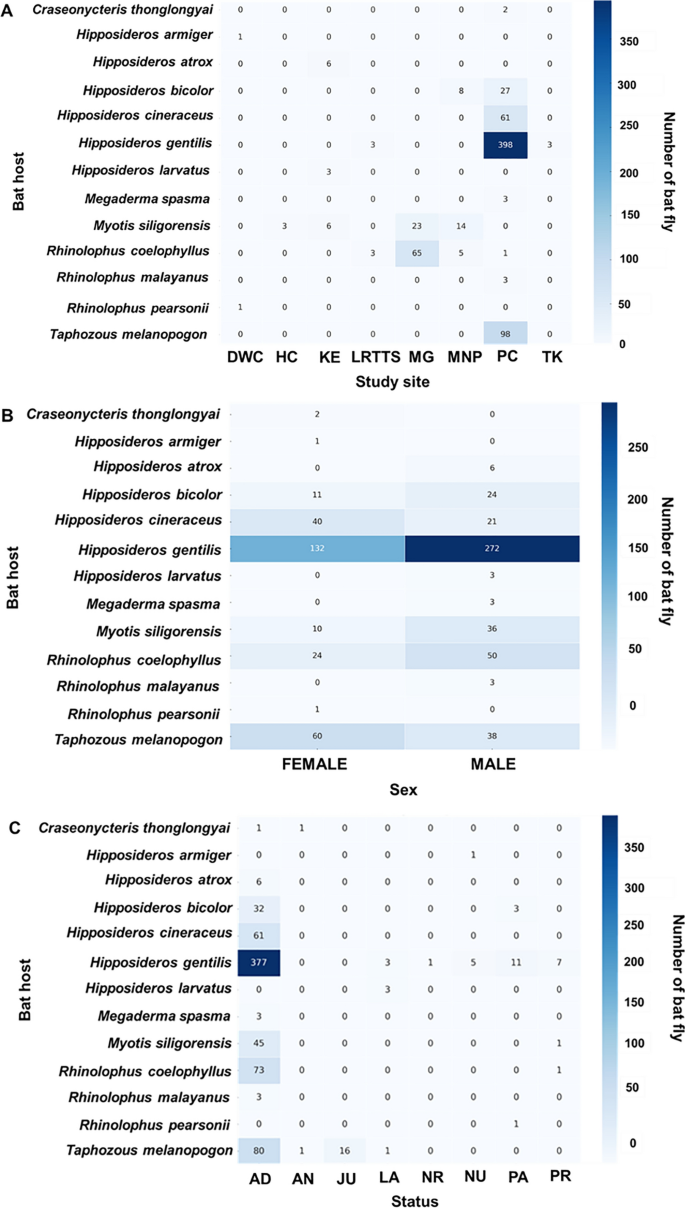
Distribution of host species infested by Streblidae across study sites (A), host sex (B), and reproductive status (C). DWC Daowadung Cave, HC Hintok Cutting, KE Khanom Electricity, LRTSS Lainan Research and Technology Transfer Station, MG Ma Gleua, MNP Ma Now Phee, PC Phra Cave, and TC Ta-Klor Cave. Bat reproductive status abbreviations: AD = adult, AN = adult nulliparous, JU = juvenile, LA = lactating, NR = nonreproductive, NU = nulliparous, PA = parous, and PR = pregnant
The Poisson generalized linear model (GLM) analysis revealed that bat species and physiological status significantly influenced bat fly infestation rates, whereas sex and study site did not show significant effects. Streblid infestation was notably higher in Hipposideros larvatus (p = 0.046). Additionally, pregnant bats had significantly lower infestation rates compared to non-pregnant individuals (p = 0.003). In the overall infestation model, H. larvatus remained significantly more infested than other bat species (p = 0.041), while pregnancy continued to be associated with reduced infestation levels (p = 0.006). In contrast, within the Nycteribiid infestation model, none of the tested predictors reached statistical significance, likely due to the limited sample size (n = 25). A detailed summary of the GLM results is provided in Table S4.
Diversity of bat flies based on morphological and molecular identification
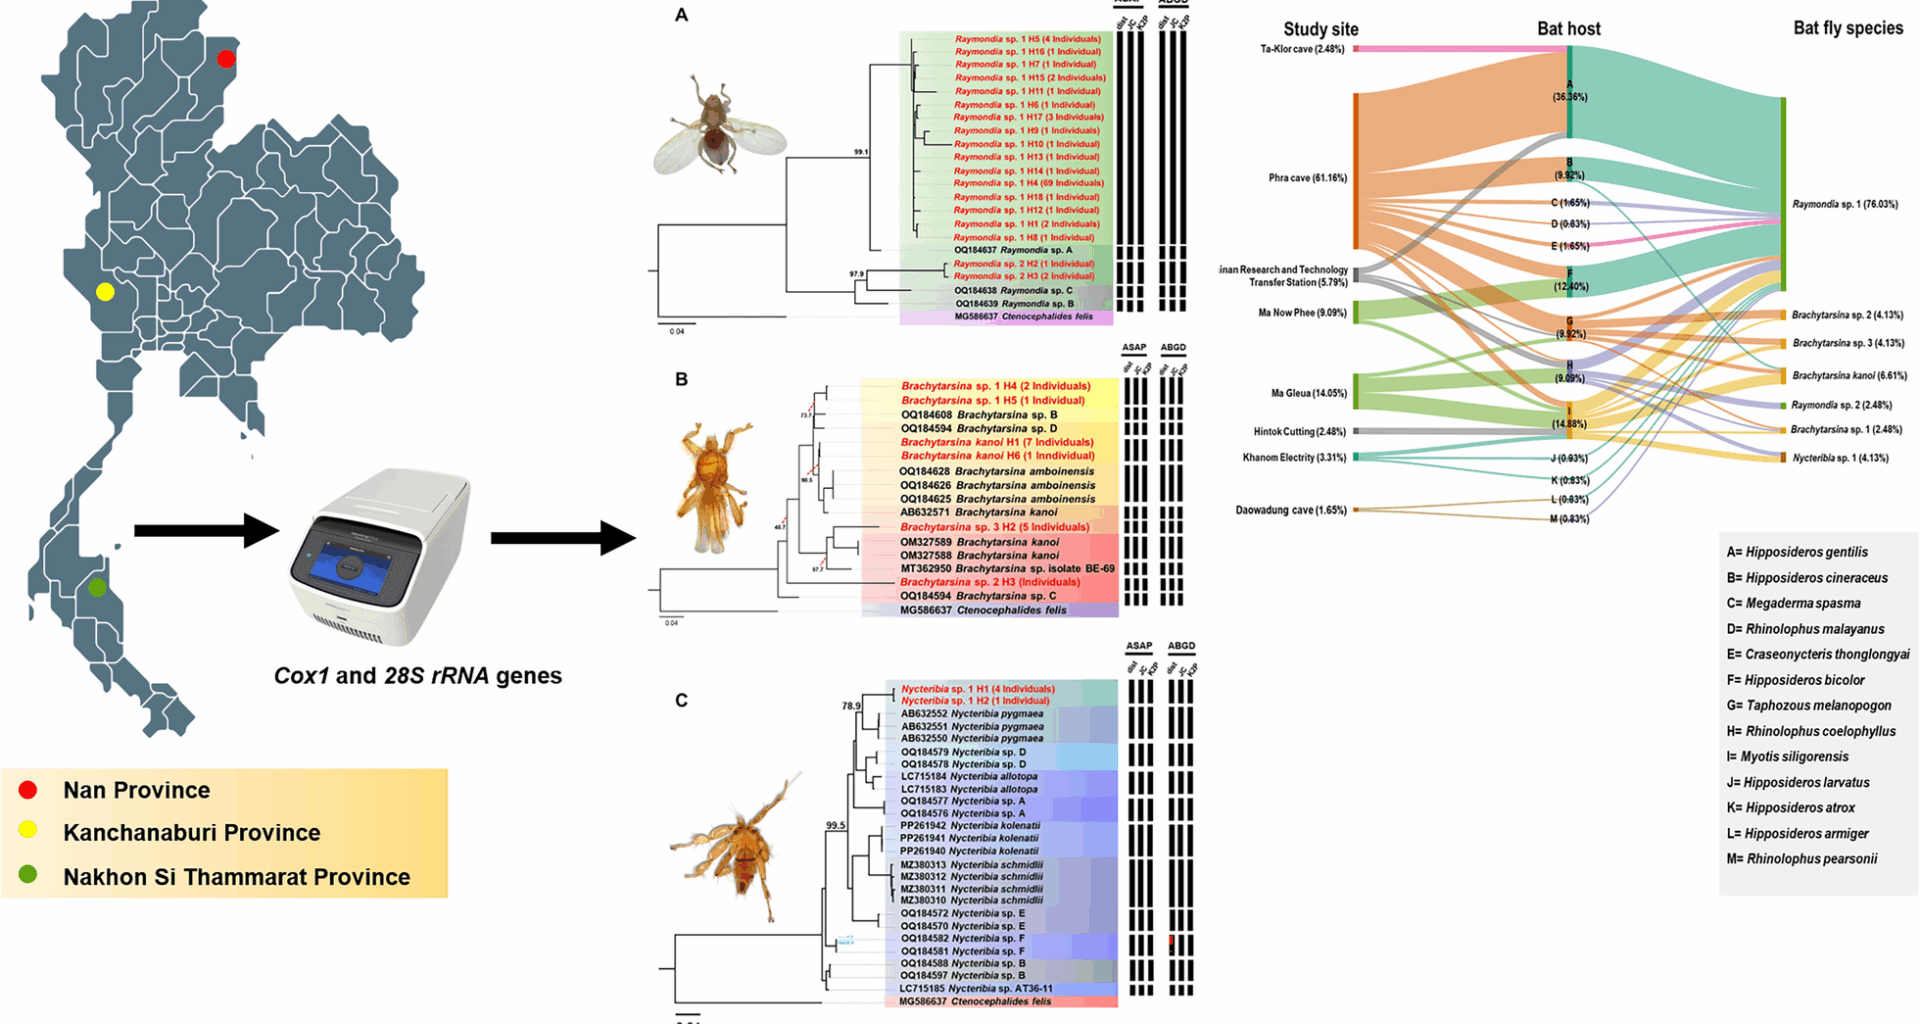
Through morphological identification, three genera of bat fly—Raymondia, Brachytarsina, and Nycteribia—were identified. Molecular analyses targeting mitochondrial (Cox1) and nuclear (28S rRNA) markers were conducted to evaluate species diversity. A total of 242 sequences (121 Cox1 and 121 28S rRNA sequences) were generated from 121 specimens collected from bat hosts across various locations in Thailand. Using a species identification threshold of ≥ 97% similarity, eight Cox1 sequences matched the Brachytarsina kanoi isolate from Japan (GenBank accession no. AB632571) with percent identities ranging from 98.14% to 98.31%, allowing for confident species-level classification. In contrast, the remaining 113 Cox1 sequences demonstrated lower similarity to existing GenBank entries, and none of the 28S rRNA sequences showed matches with available GenBank records for these genera. Notably, this study represents the first genetic characterization of Raymondia, Brachytarsina, and Nycteribia using 28S rRNA sequences, thereby expanding molecular knowledge of these taxa.
Phylogenetic analysis of bat fly Cox1 and 28S rRNA genes and species delimitation
In this phylogenetic analysis, a total of 121 cytochrome oxidase 1 (Cox1) sequences (each 538 bp) and 37 additional Cox1 sequences retrieved from the GenBank database were used. The Cox1 sequence of Ctenocephalides felis (MG586637) served as an outgroup. Phylogenetic analysis revealed distinct clades representing various genera and species of bat flies, offering valuable insights into their evolutionary relationships (Fig. 5). Detailed sequence data, including accession numbers, percentage identity, and query coverage, are provided in Supplementary Table S5. A major clade consisting of 92 individuals exhibited 99.1% bootstrap support and was identified as Raymondia sp. 1, which shared 96.9% sequence similarity with the reference sequence Raymondia sp. A (OQ184637). Similarly, three individuals formed a distinct clade, identified as Raymondia sp. 2, which also received 100% bootstrap support and showed a 97.9% sequence similarity with the reference sequence Raymondia sp. C (OQ184638). The genus Brachytarsina demonstrated significant phylogenetic complexity, forming four distinct clades, each corresponding to a separate species. The first clade, identified as B. kanoi, showed a BLASTN identity exceeding 98% and a bootstrap value of 90.5% relative to the reference sequence B. kanoi (AB632571). The second clade, comprising three individuals identified as Brachytarsina sp. 1, demonstrated strong bootstrap support (99.9%) but exhibited lower similarity (73.7%) to the reference sequences Brachytarsina sp. B and Brachytarsina sp. D (OQ184608 and OQ184594, respectively) from Hong Kong. The third clade, consisting of five individuals identified as Brachytarsina sp. 2, received 100% bootstrap support, although it displayed low sequence similarity (56%) with the reference sequence Brachytarsina sp. C (OQ184589). The fourth clade, comprising five individuals identified as Brachytarsina sp. 3, exhibited low bootstrap support compared to the reference sequences of B. kanoi (OM327589 and OM327588) from Pakistan and Brachytarsina sp. isolate BE-69 (MT362950) from Korea. Within the genus Nycteribia, seven clades were identified. Five sequences from this study formed a distinct clade with robust bootstrap support (100%) and were identified as Nycteribia sp. 1. This clade was phylogenetically distinct from the six clades of the reference sequences, which exhibited comparatively lower bootstrap support. Species delimitation was conducted using the Assemble Species by Automatic Partitioning (ASAP) and Automatic Barcode Gap Discovery (ABGD) algorithms. Both approaches consistently identified seven distinct hypothetical species, including two species of Raymondia, four species of Brachytarsina, and one species of Nycteribia (Fig. 5). These findings align with the phylogenetic tree reconstructed using the same gene, which is further corroborated by high bootstrap support values, providing robust validation for the proposed species classifications.
Fig. 5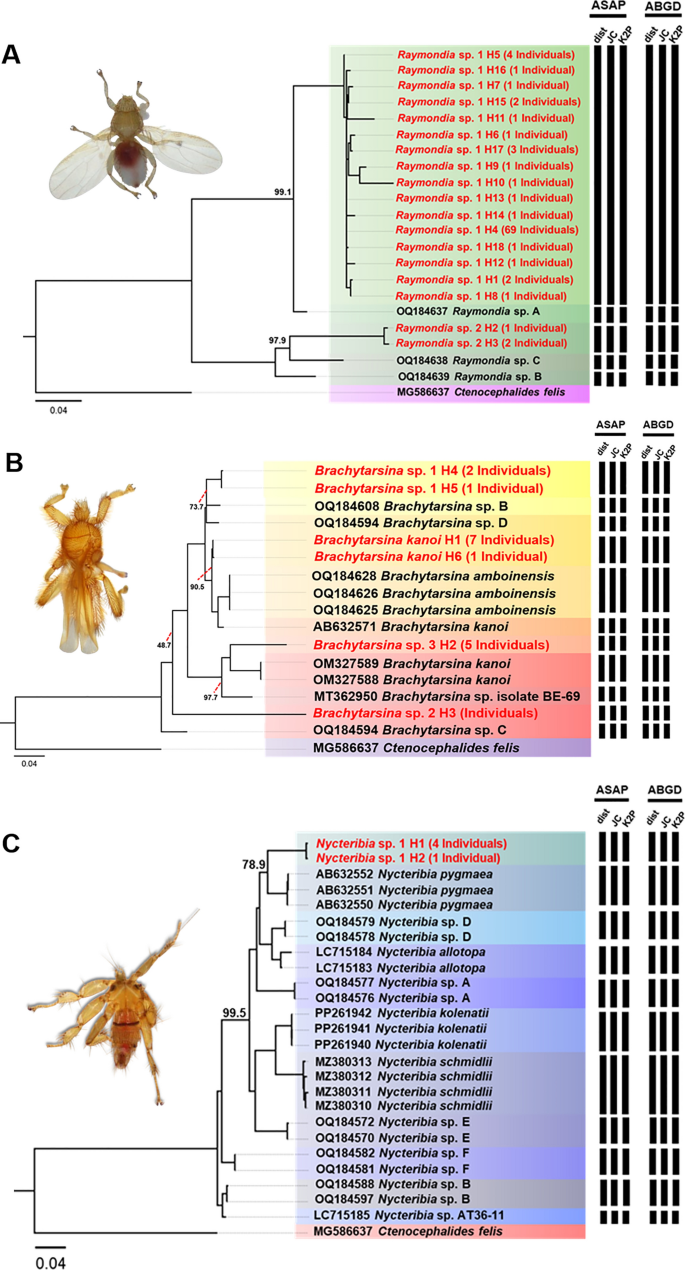
Phylogenetic trees of Raymondia (A), Brachytarsina (B), and Nycteribia (C) based on 157 nucleotide sequences of the Cox1 gene (538 bp), with Ctenocephalides felis (MG586637) used as outgroup inferred using the Maximum Likelihood (ML) method with the GTR + F + I + F4 model. Numbers near the branches indicate bootstrap values, representing the statistical support for the relationship between our sequence and the nearest reference sequence, as determined using ultrafast bootstrapping with 1000 replications. Additionally, species delimitation based on Cox1gene sequences (538 bp) was performed using the ASAP and ABGD web servers, incorporating three substitution models: simple distance (p-distance), Jukes–Cantor (JC69), and Kimura 2-Parameter (K2P). Black bars denote species delineated by each substitution model
The phylogenetic tree based on 28S rRNA was reconstructed using 121 sequences (498 bp), with Penicillidia pachymela (ON693304) serving as the outgroup, employing the maximum likelihood (ML) method. Due to the unavailability of 28S rRNA sequence data for the three genera identified in the study, representatives from these genera were excluded from the ingroup in the phylogenetic reconstruction. The resulting 28S rRNA tree closely mirrored the topology of the Cox1-based phylogeny, delineating seven well-supported and distinct clades (Fig. 6).
Fig. 6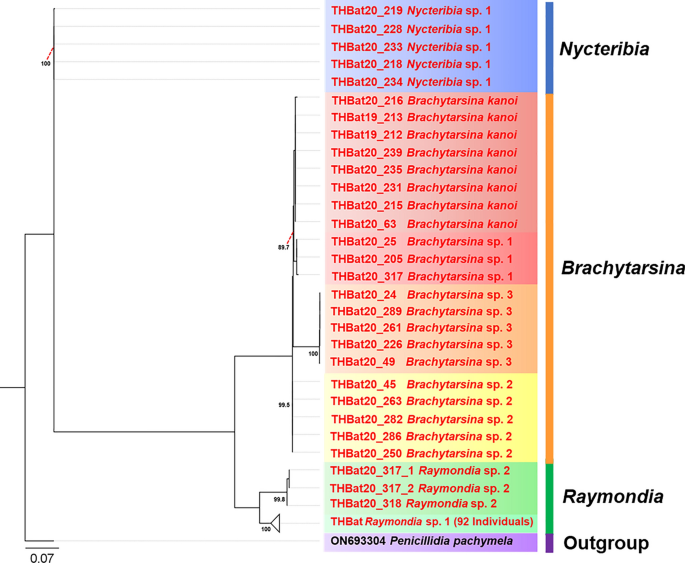
Phylogenetic tree of bat flies based on 121 nucleotide sequences of the 28S rRNA gene (497 bp), with Penicillidia pachymela (ON693304) serving as the outgroup. The tree was inferred using the maximum likelihood (ML) method with the F81 + F + G4 model. Bootstrap values, calculated using ultrafast bootstrapping with 1000 replications, are shown at the corresponding branches
Haplotype network analysis based on the Cox1 sequences of bat fly species
The study’s findings, as detailed in Table 2, provide a comprehensive summary of the diversity of bat fly species and their haplotypes across various study sites and bat hosts. Complementing this, Fig. 7 visually illustrates the distribution of haplotypes among hosts, offering insights into patterns of host specificity and genetic diversity. A total of 18 haplotypes were identified within the genus Raymondia, including 16 haplotypes for Raymondia sp. 1 (H1, H4–H18) and two haplotypes for Raymondia sp. 2 (H2, H3). Additionally, six haplotypes were recorded in the genus Brachytarsina, encompassing Brachytarsina kanoi (H1, H6), Brachytarsina sp. 1 (H4, H5), Brachytarsina sp. 2 (H3), and Brachytarsina sp. 3 (H2). The genus Nycteribia comprised two haplotypes. The distribution of Raymondia sp. 1 and its associated haplotypes varied substantially across the study sites. At Daowadung Cave, Hipposideros armiger and Rhinolophus pearsonii hosted Raymondia sp. 1, with haplotypes H8 and H4, respectively. Raymondia sp. 1 with haplotype H4 was also detected at Hintok Cutting and Khanom Electricity, hosted by Myotis siligorensis and Hipposideros species. At the Lainan Research and Technology Transfer Station, Hipposideros gentilis hosted Raymondia sp. 1 (H1), while Rhinolophus coelophyllus harbored Raymondia sp. 2 (H2, H3), and Taphozous melanopogon was associated with Brachytarsina sp. 1 (H5).
Table 2 Overview of bat fly species diversity and haplotype distribution across study sites and bat hostsFig. 7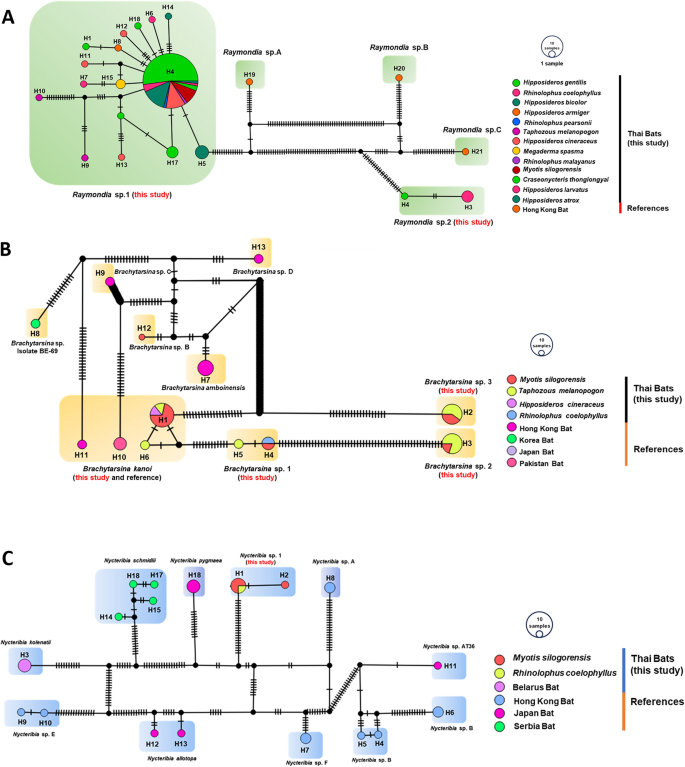
TCS network of partial Cox1 gene sequences from Raymondia (A), Brachytarsina (B), and Nycteribia (C), including reference data from GenBank. Each circle represents a haplotype, with branch markings indicating the number of mutations. Colors correspond to the host species or geographic origin. The size of each node represents the frequency or number of samples for each haplotype. Black circles denote missing haplotypes or median vectors
The Ma Gleua site exhibited greater diversity, with My. siligorensis hosting Brachytarsina kanoi (H1), Brachytarsina sp. 1 (H4), and Brachytarsina sp. 3 (H2). Rhinolophus coelophyllus hosted Raymondia sp. 1 (H4, H6, H7) and Nycteribia sp. 1 (H1, H2). At Ma Now Phee, Hipposideros bicolor supported Raymondia sp. 1 (H4, H5), while Phra Cave exhibited a high frequency of haplotype H4 in 32 individuals of H. gentilis, alongside other haplotypes (H13–H18) in the same host species. At Ta-Klor Cave, H. gentilis also hosted Raymondia sp. 1 (H4). These findings underscore the widespread occurrence of Raymondia sp. 1 across a range of bat species and study sites. Notably, haplotype H4 emerged as the most prevalent, suggesting its significant role in shaping the genetic structure of Raymondia sp. 1 populations. The pervasive distribution of haplotype H4 likely reflects ecological factors, such as host availability, and possible local adaptations to specific environmental conditions, highlighting the intricate dynamics among host species, parasites, and their environments.
Tripatrid network analysis
The tripartite network analysis, incorporating study sites, bat hosts, and bat fly species, is illustrated in Fig. 8. The analysis identified Raymondia sp. 1 as the most prevalent bat fly species, widely distributed across multiple study sites and bat hosts. Notably, 76.03% (92/121) of Raymondia sp. 1 individuals were recorded infesting various bat species, with a significant proportion (31.40%; 38/121) infesting Hipposideros gentilis at Phra Cave. In contrast, Raymondia sp. 2 was exclusively found infesting Rhinolophus coelophyllus at the Lainan Research and Technology Transfer Station, accounting for 2.48% (3/121) of all bat fly individuals.
Fig. 8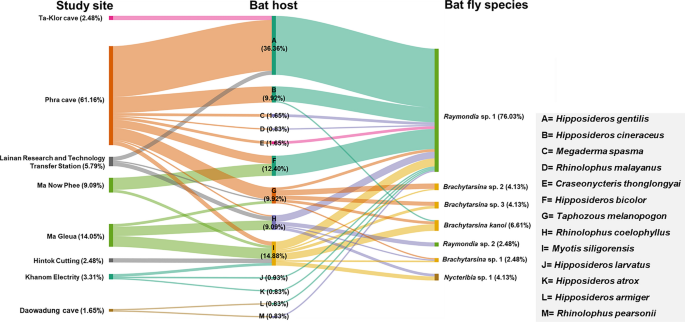
Tripartite network analysis based on study site, bat host, and bat fly species. The percentage values represent the relative abundance of the 121 bat fly specimens used in this analysis
The genus Brachytarsina, comprising Brachytarsina kanoi and three unidentified species (Brachytarsina sp. 1, sp. 2, and sp. 3), displayed a broader distribution across different sites and bat hosts. Brachytarsina kanoi was identified in three individuals of Myotis siligorensis (2.48%, n = 121) and two individuals of Taphozous melanopogon (1.65%, n = 121) at Ma Gleua Cave. Brachytarsina sp. 1 was observed in one My. siligorensis individual at Ma Gleua Cave (0.83%, n = 121) and one R. coelophyllus individual at Phra Cave Cave (0.83%, n = 121). Brachytarsina sp. 2 was found in one My. siligorensis individual at Phra Cave (0.83%, n = 121), while Brachytarsina sp. 3 infested one My. siligorensis individual at Ma Gleua Cave (0.83%, n = 121) and three T. melanopogon individuals at Phra Cave (2.48%, n = 121). Similarly, Nycteribia sp. 1 was detected in three My. siligorensis individuals (2.48%) and two R. coelophyllus individuals (1.65%) at Ma Gleua Cave. These findings highlight the diversity and host associations of bat fly species across the study sites, with Raymondia sp. 1 emerging as the dominant species and exhibiting the highest prevalence among bat hosts.
Genetic variations and estimates of intra- and interspecific sequence divergences of Cox1 and 28S rRNA sequences of bat flies in Thailand
The genetic diversity of Cox1 and 28S rRNA sequences among the seven bat fly species collected in Thailand revealed substantial interspecific and intraspecific variations (Table 3). Raymondia sp. 1 exhibited the highest genetic diversity across both markers. The Cox1 gene displayed 111 polymorphic sites and 18 haplotypes, resulting in a haplotype diversity (Hd) of 0.4371 ± 0.066 and a nucleotide diversity (π) of 0.0060 ± 0.04800. Similar trends were observed for the 28S rRNA gene, where Raymondia sp. 1 exhibited 35 polymorphic sites and 21 haplotypes, with Hd and π values of 0.765 ± 0.034 and 0.00523 ± 0.01485, respectively. Statistically significant negative values of Tajima’s D (– 2.88120) and Fu and Li’s D (– 8.19923) for the Cox1 gene suggest either population expansion or purifying selection for this gene. In contrast, Brachytarsina sp. 2 and 3 exhibited no genetic variation across either the Cox1 or 28S rRNA markers, with single haplotype and nucleotide diversity values of π = 0.00000. This lack of diversity suggests a potential bottleneck or the presence of a recently established population. Moderate genetic diversity was observed in other species, such as B. kanoi and Nycteribia sp. 1. Brachytarsina kanoi displayed low haplotype diversity (Hd = 0.250 ± 0.180) and nucleotide diversity (π = 0.00047 ± 0.0007) for the Cox1 gene, with similar trends for the 28S rRNA marker. Nycteribia sp. 1 showed higher haplotype diversity (Hd = 0.400 ± 0.237) and nucleotide diversity (π = 0.00082 ± 0.0009 in the Cox1 gene), indicating greater genetic variation within this species. Neutrality tests for both species did not yield significant results, suggesting that their evolution follows a neutral model.
Table 3 Genetic diversity indices and neutrality test of Cox1 and 28S rRNA sequences from seven species of bat flies in Thailand
The analysis of the Cox1 gene revealed intraspecific sequence divergence ranging from 0.00 to 0.01, with Raymondia sp. 1 exhibiting the highest values and Brachytarsina sp. 2 showing no divergence. Interspecific divergence was notably higher, ranging from 0.09 to 0.33, with the largest divergence observed between Raymondia sp. 2 and Nycteribia sp. 1 as well as between Brachytarsina sp. 3 and Nycteribia sp. 1 (0.33). Within Brachytarsina, interspecific divergence ranged from 0.10 to 0.19, reflecting moderate genetic differentiation. The divergence between Nycteribia and other genera was significantly higher (0.25 – 0.30), underscoring clear phylogenetic separation (Table 4).
Table 4 Estimates of intra- and interspecific sequence divergences as measured by the Cox1
Analysis of intra- and interspecific sequence divergences based on the 28S rRNA gene revealed distinct patterns among the studied bat fly species (Table 5). Intraspecific divergences ranged from 0.00 to 0.01 within most Raymondia species, demonstrating a high degree of genetic homogeneity. Specifically, Raymondia sp. 1 exhibited negligible divergence among samples (0.00 – 0.01), suggesting minimal genetic differentiation within the species. Similarly, B. kanoi showed no intraspecific divergence across all samples, indicating genetic stability. In contrast, interspecific divergences among Raymondia species and between Raymondia and other genera were significantly higher. Raymondia sp. 2 displayed an average interspecific divergence of 0.21 compared to Raymondia sp. 1, indicating a substantial genetic separation between these two species. Among the Brachytarsina species, Brachytarsina sp. 1, B. sp. 2, and B. sp. 3 exhibited higher interspecific divergence values (0.00 – 0.29), reflecting their genetic distinctiveness despite being in the same genus. Notably, Nycteribia sp. 1 displayed the highest intraspecific divergence (0.00–0.01) while maintaining substantial interspecific divergence compared to other genera. For example, Nycteribia sp. 1 diverged from Brachytarsina kanoi and Raymondia sp. 1 by 0.32 and 0.33, respectively, underscoring its unique genetic identity.
Table 5 Estimates of intra- and interspecific sequence divergences as measured by the 28S rRNA