Diversity of InDel patterns in PRRd
We generated a ‘ground truth’ set of isogenic cellular models by introducing CRISPR edits to key PRRd-associated genes in an hTERT-immortalized RPE1 (TP53−/−) cell line23. We created four single MMR gene knockouts (ΔMLH1, ΔMSH2, ΔMSH3 and ΔSETD2 (ref. 24)), two knock-in missense mutants of polymerase Pol ε (POLE exonuclease mutant p.P286R and p.L424V), two mutants of Pol δ (POLD1 exonuclease mutant p.S478N and polymerase mutant p.R689W) and three double mutants with combined polymerase proofreading mutation and MMRd (POLD1S478N/+ΔMLH1, POLD1S478N/+ΔMSH2 and POLEP286RΔMSH2; Supplementary Tables 1 and 2). Successfully edited clones were propagated in culture for approximately 45–50 days to permit mutation accumulation. Subsequently, two to five daughter subclones were isolated per genotype for whole-genome sequencing (WGS) and mutational signature analyses (Fig. 1a).
Fig. 1: Isogenic PRRd human cell lines exhibit distinct InDel patterns.
a, Mutation accumulation experiment in TP53-null hTERT-immortalized retinal pigment epithelial cell (hTERT-RPE1TP53-null, herewith referred to as the background control). b, InDel burden and average InDel fold increase of CRISPR gene edits (n = 2–5 subclones per genotype; Supplementary Tables 1–3). Red dashed line represents the mean InDel burden of control subclones. The y axis shows the InDel burden in log scale. c, Distinguishing COSMIC-83 InDel profiles of edited subclones from background control. Light blue error bars depict the mean ±3 s.d. of cosine similarities between n = 100 bootstrapped InDel profiles of unedited controls and the background profile (Extended Data Fig. 1d) aggregated from n = 7 unedited subclones. The x axis shows the InDel count in log scale. d, COSMIC-83 InDel mutational signatures associated with gene edits following background subtraction (Supplementary Table 4). e, Key features of COSMIC ID1, ID2 and ID7 (v.3.3). f, Heatmap of cosine similarities between gene-edit IDS and COSMIC IDS (v.3.3). Known, proposed etiologies are annotated above the heatmap (blue). g, Decomposed solution of gene-edit InDel signatures in d into COSMIC IDS (v.3.3).
Except for ΔSETD2, we observed elevated InDel burdens in all gene edits compared to an unedited control (background) (Fig. 1b and Supplementary Table 3). The mutation burden was approximately twofold higher in ΔMSH3 and POLD1R689W, tenfold in POLD1S478N, POLEL424V and POLEP286R, 55-fold in ΔMSH2 and ΔMLH1 and particularly significant in combined gene edits—around 200-fold in POLD1S478N/+ΔMLH1 and POLEP286RΔMSH2, and 300-fold in POLD1S478N/+ΔMSH2.
All lines except ΔSETD2 showed variations in their COSMIC-83 InDel signature profiles compared to control (Fig. 1c and Supplementary Table 4). We noted discriminative characteristics between gene edits (Fig. 1d and Extended Data Fig. 1). Dominant 1 bp T deletions at homopolymers of 6 bp or more (poly-T6+) were observed for ΔMLH1, ΔMSH2 and ΔMSH3, while POLD1S478N and POLEP286R showed exclusive 1 bp T insertions at poly-T5+. POLD1R689W, POLEL424V and all three combined polymerase/MMRd edits predominantly exhibited 1 bp T insertions at long homopolymers, although not exclusively, with variations of 1 bp T deletions between different genotypes. Together, these experiments revealed unique, diverse InDel signatures among different PRRd mutants. Remarkably, mutations within the same gene but affecting different functional protein domains manifested signature variations (that is, POLD1 exonuclease p.S478N versus polymerase p.R689W).
We also examined the substitution profiles of all gene edits (Extended Data Fig. 2 and Supplementary Table 5). Intriguingly, MMRd lines showed lower substitution-to-InDel ratios compared to control, while polymerase-dysfunction (Pol-dys) lines exhibited markedly increased ratios (Extended Data Fig. 2h). This suggests that genome instability is predominantly driven by an excess of InDel mutagenesis in MMRd, whereas substitution mutagenesis plays a more significant role in polymerase proofreading dysfunction. Furthermore, mutational asymmetry analyses revealed enrichment of both substitutions and InDels on the leading strand for POLE mutants while POLD1 mutants exhibited lagging strand bias, specifically T insertions at homopolymeric tracts of 5–7 nts (Supplementary Fig. 1 and Supplementary Table 6). This is in keeping with the hypothesized preferential activity of Pol ε and Pol δ in leading and lagging strand synthesis, respectively25,26, suggesting that POLE/POLD1 mutants tend to accumulate 1 bp A insertions on the nascent strand while replicating through 5–7 nts poly-T-tracts27,28. This lends support to the proposition that polymerase ε and δ are more proficient at detecting incorrectly paired bases at template adenines27.
Nevertheless, while the diversity of experimental InDel profiles was appreciable among PRRd genotypes, it was difficult to disambiguate gene-edit signatures from background mutagenesis. Clustering analyses and direct comparisons of gene edit and control InDel profiles showed extremely high similarity (cosine similarity > 0.9; Extended Data Fig. 1a,b,d). Discrimination between MMRd and Pol-dys signatures was also limited (Extended Data Fig. 1e). Unsupervised clustering using cosine distance revealed mainly two groups of signatures—deletion-driven MMRd signatures and insertion-driven polymerase mutant signatures (Extended Data Fig. 1f). We thus investigated the sufficiency of COSMIC-83 taxonomy, given that signal variation among the ten gene edits was primarily observed in two channels—1 bp T insertions at poly-T5+ and 1 bp T deletions at poly-T6+.
Limitations of current InDel taxonomy
We compared experimental gene-edit InDel signatures with COSMIC IDS7. InDel signatures of ΔMSH2 and ΔMLH1 showed no similarity to the purported MMRd-associated ID7 (Fig. 1f). Instead, ΔMSH2 and ΔMLH1 signatures most resembled ID1 and ID2, ascribed to normal replication errors associated with nascent and template strand slippage, respectively (Fig. 1d–g).
The COSMIC-83 taxonomy aggregates 1 bp InDels at homopolymers >5 bp into single channels (that is, T6+ for deletions and T5+ for insertions, respectively; Fig. 1e and Extended Data Fig. 3a–d). Yet, the probability of microInDel formation increasing with the length of simple nucleotide repeats in MMRd29 is a recognized hallmark of MSI30. We surmised that the conflation of discriminatory signals within longer homopolymers into single ‘insertion at T5+’ or ‘deletion at T6+’ channel likely reduces the separative capacity for signature extraction. Hence, MMRd signatures cannot be distinguished from signatures of normal replication errors. This contrasts with corresponding PRRd-associated substitution signatures, which manifest as distinct and diverse patterns amongst MMRd and/or Pol-dys cancers3,7,31 (Extended Data Fig. 2b–g).
Notably, ID7 lacks signal within reputedly the most informative homopolymer channel (>5 bp). Instead, signals are only present in channels associated with ID1 and ID2 (Fig. 1e), resulting in systematic misattribution of all MMRd gene-edit signatures to ID1 and ID2 (Fig. 1f,g). Moreover, InDel signatures of POLE, POLD1 mutants and all combined polymerase/MMRd edits were indistinguishable from ID1 using COSMIC-83 taxonomy and sometimes indistinguishable from each other (Extended Data Fig. 1e). The signature of polymerase mutant POLD1R689W did not resemble any reported signatures. Because InDel mutagenesis of gene edits occurred predominantly at longer homopolymers and was erroneously assigned to ID1 and/or ID2 (Fig. 1g), we explored whether expanding on the long homopolymer channels and modifying the information presented in individual InDel channels could improve the resolution to disentangle the ostensibly alike but distinct biological signatures without compromising the power for signature extraction.
A new framework for classifying InDels
As with substitutions, incorporating surrounding sequence characteristics may enhance the discriminatory capacity of InDel catalogs for signature analyses32. We first classified InDels according to whether they were insertions, deletions or complex InDels (simultaneous insertions and deletions; Fig. 2a). Within insertions and deletions, InDels were subclassified by motif size (1 bp versus ≥2 bp). For 1 bp InDels, we considered the nucleotide content (C/G versus A/T motifs), the 5′ and 3′ flanking bases and the length of homopolymeric tracts. For InDels ≥2 bp, we identified the maximally repetitive motif within the InDel and accounted for its repeat length in the 3′ sequence (Supplementary Note 1). For deletions occurring with microhomology at the InDel junction, we considered the deletion motif length (L) and the microhomology length (M). This comprehensive taxonomy yielded 476 nonoverlapping InDel subcategories (channels; Supplementary Table 7 and Supplementary Note).
Fig. 2: Redefined InDel taxonomy improves discriminatory power and reveals differential InDel patterns associated with PRR gene edits.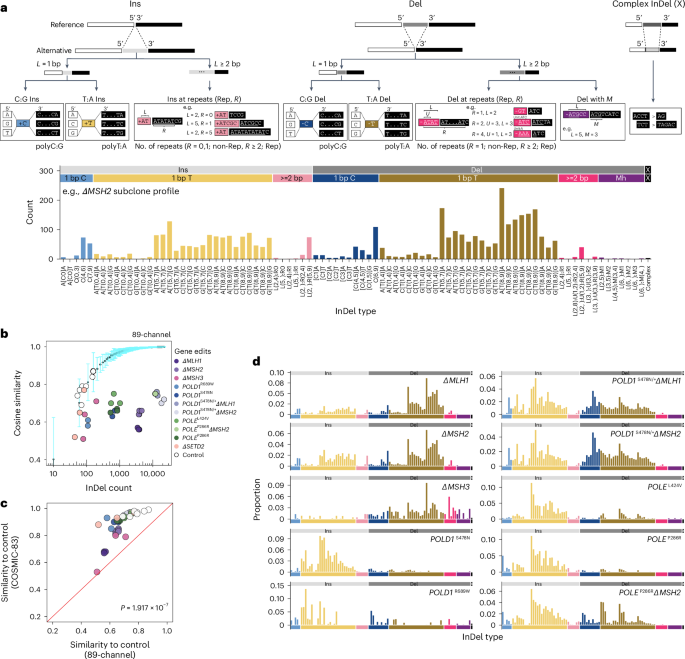
a, Proposed InDel classification schema and an example 89-channel InDel profile of an ΔMSH2 subclone. b, Distinguishing 89-channel InDel profiles of edited subclones from background control. Light blue error bars depict the mean ± 3 s.d. of cosine similarities between n = 100 bootstrapped InDel profiles of unedited controls and the background profile (Extended Data Fig. 5b) aggregated from n = 7 unedited subclones. The x axis shows the InDel count in log scale. c, Cosine similarities of edited subclones and bootstrapped controls in COSMIC-83 InDel profiles against 89-channel InDel profiles. Two-tailed Wilcoxon signed-rank test, P = 1.917 × 10⁻⁷). d, The 89-channel InDel mutational signatures associated with PRRd gene edits following background subtraction (Supplementary Table 4; https://signal.mutationalsignatures.com/explore/main/experimental/experiments?study=7). Ins, insertion; Del, deletion.
We examined whether all 476 channels were informative. By analyzing the InDel distribution across all channels in 18,522 tumors covering most cancer types from the International Cancer Genome Consortium (ICGC)/The Cancer Genome Atlas (TCGA)33, Hartwig34 and the Genomics England (GEL) 100,000 Genomes Project35 (Extended Data Fig. 3e), we identified noninformative channels (that is, channels with no signal) and consolidated those with low signal to reduce the total number of InDel channels to 89 (Fig. 2a, Extended Data Fig. 3f and Supplementary Table 8). Overall, compared to COSMIC-83, the 89-channel taxonomy expands upon channels that had most of the signals, here 1 bp A/T InDels, into a larger array of channels, and condenses longer InDels and/or genome motifs infrequent in the genome (where signals were scant or nonexistent) into fewer InDel subcategories (Extended Data Fig. 4). Although the final numbers are not vastly different between the two classification systems, our data-driven approach, incorporating sequence contexts and enhancing signal distribution of mononucleotide/polynucleotide repeat tracts into additional channels, provides alternative information to the mutational signature extraction and assignment process, potentially increasing the likelihood of detecting new biologically meaningful signatures.
To test this, we applied the new 89-channel InDel taxonomy to our ground truth gene-edit dataset (Supplementary Table 4). Cosine similarities between experimental InDel profiles and control were much lower with the 89-channel format than with COSMIC-83 (Fig. 2b,c and Extended Data Fig. 5a,b), indicating that the new classification improved separation of gene edits from the background (mean cosine similarity, 0.68 ± 0.08 for 89-channel versus 0.89 ± 0.11 for COSMIC-83; two-tailed Wilcoxon signed-rank test, P = 1.917 × 10⁻⁷). We subsequently determined signatures associated with each gene edit using the 89-channel format. The resultant signatures showed more evenly distributed signals across the entire 89-channel profile (Figs. 1d, 2d and Extended Data Fig. 5c). Gene-edit signatures were also more readily discernible from one another (mean signature pairwise cosine similarity, 0.57 ± 0.25 for 89-channel versus 0.64 ± 0.3 for COSMIC-83; two-tailed Wilcoxon signed-rank test, P = 1.483 × 10⁻⁵; Extended Data Fig. 5d,e). Notably, InDel signatures of combined MMRd/polymerase mutants were not simply the sum of the individual mutational processes, likely reflecting the biological interactions of Pol ε and Pol δ with MMR in suppressing InDel formation during the replication of repetitive DNA.
Interestingly, we noted that while MMRd deletions are particularly amplified at longer homopolymers (8–9 bp > 5–7 bp > 0–4 bp), polymerase mutants displayed strikingly different distribution of excess insertion mutagenesis at shorter homopolymers (5–7 bp > 8–9 bp > 0–4 bp; Fig. 2d). The higher InDel rates in shorter homopolymers conferred by defective proofreading of Pol ε and Pol δ likely reflect the distance over which they interact with duplex DNA upstream of the polymerase active site29. Indeed, crystal structures of Pol ε and Pol δ have shown numerous contacts made within 5–7 bp of the polymerase active sites with duplex DNA36,37, with experimental model reinforcing this optimal distance29, explaining how proofreading may offer reduced protection against InDels outside of this ‘footprint’ (that is, unpaired bases further upstream of the active site38; longer runs where MMR plays a more crucial role29). These unique insights were only appreciable due to the new 89-channel format, offering enhanced capturing of biological variation.
To compare the discriminatory capacity of both classification systems, we also performed de novo signature extraction on our ground truth experimental dataset (n = 37; Extended Data Fig. 6a). With COSMIC-83, only two de novo signatures were extracted—one dominated by T insertions at poly-T5+ (ID83A) and the other by T deletions at poly-T6+ (ID83B; Extended Data Fig. 6b). In contrast, the 89-channel format yielded four signatures, matching our expectation of a predominantly deletion-driven MMRd signature (InD89B), a predominantly insertion-driven polymerase signature (InD89D) and two distinct signatures with differing proportions of InDels (InD89A and InD89C), likely reflecting the combined polymerase/MMRd phenotypes (Extended Data Fig. 6c).
Finally, to determine whether this observed relationship between channel information content and signature extraction extended to other datasets and workflows, we applied three different algorithms3,8,39 to an unrelated cohort of 52 colorectal WGS from ICGC33 (Extended Data Fig. 6d). All three algorithms failed to discern all available signatures using COSMIC-83, reaching a discrimination limit of five, yielding sparse signatures with signal density highly concentrated in two channels (Extended Data Fig. 6d,e,g). Contrarily, the 89-channel format consistently enabled the detection of more de novo signatures across all algorithms used (Extended Data Fig. 6f,h). The extracted signatures also displayed signals across more channels, highlighting the superior performance of the 89-channel classification over COSMIC-83 in uncovering additional, true mutational processes.
New InDel signatures (InDs) in seven cancer types
To explore the impact of our new InDel taxonomy on signature discovery beyond PRRd phenotypes in human cancers, we analyzed seven tumor types (n = 4,775) known to display clinically relevant high tumor mutational burden (TMB) due to a range of abnormalities (for example, MMRd, environmental ultraviolet (UV) radiation, APOBEC-related mutagenesis)—bladder (n = 347), brain (CNS, n = 392), colorectal (n = 2,146), endometrial (n = 695), lung (n = 958), stomach (n = 181) and skin (n = 56) cancers from the GEL 100,000 Genomes Project35 (Fig. 3a).
Fig. 3: De novo signature extraction using redefined InDel taxonomy uncovers 37 InDS in seven cancer types in the GEL cohort.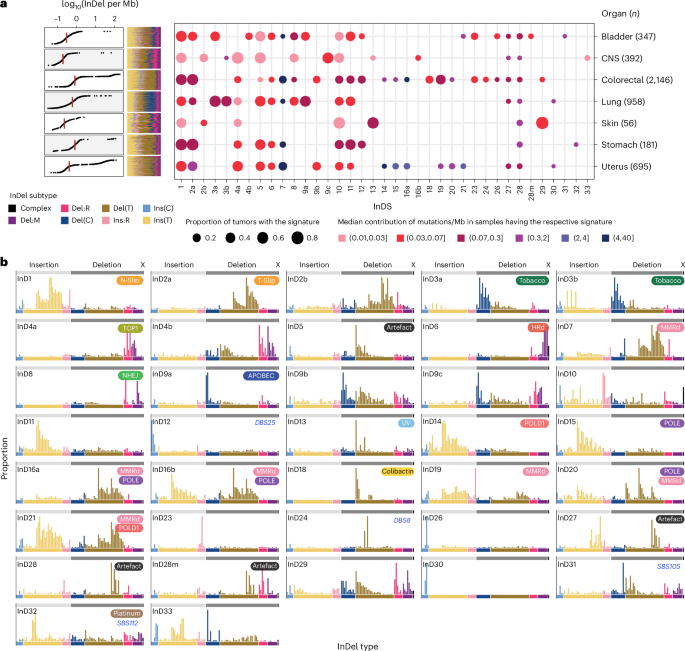
a, InDel burden across seven cancer types (n = 4,775; left) and the number of mutations contributed by each InD to the GEL tumors. The size of each dot represents the proportion of samples of each tumor type that shows the mutational signature. The color of each dot represents the median mutation burden (per Mb) of the signature in samples that show the signature. b, Profiles of 37 consensus InDel mutational signatures (InDS) extracted and curated from seven GEL cancer cohorts (Supplementary Table 10; https://signal.mutationalsignatures.com/explore/main/cancer/signatures?mutationType=3&study=7). Putative etiologies are provided in the top-left squircles. N-Slip, nascent strand slippage; T-Slip, template strand slippage; NHEJ, nonhomologous end joining.
We performed mutational signature analysis per tumor type as previously described3 (Fig. 3a, Extended Data Fig. 7, and Supplementary Tables 9–11; Methods). We identified 37 consensus InDel signatures, referred to as InDS (to distinguish from COSMIC IDS; Fig. 3b). Ten signatures shared characteristics mappable to known IDS (InD1, InD2a, InD3a/InD3b, InD4a, InD6, InD8, InD9a, InD13 and InD18)7. The remaining 27 were new.
Exogenous exposures underlie five InDS. InD3a and InD3b often co-occurred in lung cancers with tobacco exposure. InD3a/InD3b clustered with experimental signatures induced by benzo(a)pyrene and its metabolite benzo(a)pyrene diol epoxide (Extended Data Figs. 8 and 9), supporting the notion that they represent modulated versions of tobacco-related DNA damage. InD13, characterized by T deletions at TT dinucleotides, is linked to UV damage, and InD18, found exclusively in colorectal samples, is due to colibactin exposure40. InD32 was identified in samples with prior exposure to platinum and was associated with a new platinum-associated signature, SBS112 (ref. 3).
Twenty InDS had probable endogenous origins (Extended Data Fig. 9). Several have been described, including InD1 and InD2a, errors associated with nascent and template strand slippage during normal DNA replication, respectively7. InD1 and InD2a were seen universally across all tumor types except CNS and skin cancers, which showed a tissue-specific variant, InD2b (Fig. 3a). InD4a is attributed to TOP1 transcription-associated mutagenesis14. InD6, marked by microhomology-mediated deletions, is associated with deficiency in HR repair7. InD8, which had deletions with little to no microhomology at deletion junctions, likely reflects the footprint of nonhomologous end-joining activity and/or radiotherapy41.
InD9a, correlated with SBS2 and SBS13 hypermutation, featured 1 bp C deletions at TCT and TCA (mutated base underlined), identical to mutable motifs characteristic of SBS2/SBS13, particularly at short poly-T tracts. It was presumptively induced by APOBEC (Extended Data Fig. 8c), corroborated by experimental evidence from an APOBEC overexpression DT40 model42. We proposed a mutagenesis mechanism wherein following C-to-U deamination at TCT by APOBEC, uracil removal by UNG leaves an uninformative abasic site. Template strand slippage can then occur at this short repetitive T tract, leading to a C deletion (Extended Data Fig. 8d). For reasons currently unclear, we also found similar C-deletion-dominated InD9b/InD9c, which, although resembled InD9a, lacked the predilection for a preceding T, and was possibly caused by an alternative mechanism.
Interestingly, we extracted eight gene-specific MMRd and Pol-dys InDS. MMRd-InD7 contrasts with COSMIC ID7. InD7 is characterized by the expected excess of 1 bp and 2 bp deletions, particularly at longer mononucleotide/dinucleotide repeat tracts. InD7 clustered with experimental signatures of ΔMLH1, ΔMSH2 and ΔMSH6 (Extended Data Fig. 9). We also identified InD19 (due to PMS2 deficiency), InD14 (associated with POLD1 exonuclease mutations), InD15 (associated with POLE exonuclease mutations), InD16a and 16b (resulting from concurrent loss of POLE proofreading and MMR), InD21 (associated with combined POLD1 proofreading defect and MMRd) and InD20, which we found through experimental investigations, was due to MMRd occurring on a POLE dysfunction background.
The remaining 12 signatures were of uncertain etiology. Five were probably artifacts—InD27 and InD28 often co-occurred, incurring thousands of InDels, and were related to SBS57, potentially an amplification or a sequencing artifact7. InD28m was likely a mixed signature of InD28 and InD4, remaining to be resolved with larger cohorts. InD5 and InD10 were ubiquitous and possibly artifacts.
While C insertions dominated both InD26 and InD30 at poly-C tracts followed by a 3′A, InD30 C insertions induced thousands of insertions at homopolymers CCC and CCCC, whereas InD26 C insertions mainly occurred at longer CCCCC and were not associated with hypermutation.
Three InDS (InD31, InD24 and InD12) showed striking correlations with signatures of other classes. InD31 displayed distinct C deletions at short homopolymers (3), and often co-occurred with InD8. InD24 deletions peaked prominently at GTA and GTG and were strongly correlated with DBS8, which shows double substitutions at the same motifs (TGTG > TAGG/TTGG). InD12 exhibited C deletions between dinucleotides AA and AT and was associated with DBS25 featuring a tall peak at TT dinucleotide. Despite clear co-occurrence, the causes for these signatures remain cryptic.
InD4b and InD29 shared features with InD4a and InD8, respectively. Whether they represented tissue-specific variants, were mixed or caused by different mechanisms requires further investigation. InD11 appeared related to InD1 and might be an oversplit signature frequently enriched in high InDel burden samples, such as those with MMRd and Pol-dys. Seen in bladder and colorectal cancers, InD23 showed a striking pattern of longer insertions (≥5 bp) at nonrepeats. These insertions were almost exclusively tandemly duplicated from immediate neighboring sequences. InD33 was most prominent in one CNS tumor treated with temozolomide; however, its etiology remains unknown.
In summary, 5 InDS were of likely exogenous origins (InD3a, InD3b, InD13, InD18 and InD32), 20 were endogenous (InD1, InD2a, InD2b, InD4a, InD4b, InD6, InD7, InD8, InD9a, InD9b, InD9c, InD11, InD14, InD15, InD16a, InD16b, InD19, InD20, InD21 and InD29) and 12 had uncertain sources (InD5, InD10, InD12, InD23, InD24, InD26, InD27, InD28, InD28m, InD30, InD31 and InD33).
A signature-based classifier of PRR dysfunction
PRRd subtypes, typified by MSI, are clinically actionable with potential selective sensitivity to immunotherapies20,21,22. Current methods of detecting PRRd mainly rely on immunohistochemistry (IHC) staining of MMR proteins (but not for polymerase mutants) and/or PCR-based assays to determine MSI at selected genomic loci. These assays are not sensitive or robust enough, especially in nonepithelial tissues16. Using insights from this study, we therefore explored constructing a classifier for tumor PRRd stratification, reporting MMRd, Pol-dys and mixed MMRd/Pol-dys as distinct classes versus PRR proficiency.
We used 571 GEL cancers assigned as MMRd (n = 214), Pol-dys (n = 36), mixed MMRd/Pol-dys (n = 41) or PRR-proficient (controls, n = 280) based on confirmed causal genotypes and allelic status, and/or supporting IHC staining (Fig. 4a and Supplementary Table 12). Samples treated as controls had neither MMRd and/or Pol-dys confirmed through the lack of driver mutations in key MMR genes (that is, MLH1, MSH2, MSH6, and PMS2), POLE, POLD1, and displayed no evidence of MSI associated with these abnormalities43. We trained multiple multinomial elastic net regression models applying 7:3 partitioning iteratively across the dataset. Through exploring all possible features/models (Supplementary Table 13), we identified exposures of SBS and InDS associated with MMRd, Pol-dys and mixed MMRd/Pol-dys, as well as the ratio of total InDels to substitutions as the most predictive features (Fig. 4b and Supplementary Table 14; Methods). The final model, termed PRRDetect (postreplicative repair detect), was retrained on the entire dataset (n = 571). Then, in an independent validation cohort of 504 ICGC breast cancers44,45 and 847 GEL cancers, for which the true labels of PRRd were known, PRRDetect achieved an AUROC (area under the ROC curve) of 1 and an AUPRC (precision–recall curve) of 0.99 at distinguishing PRR-dysfunctional from PRR-proficient samples, performing superiorly to other MSI/MMRd detection tools, including MSIseq43, MMRDetect46 and TMB—an approved biomarker for immunotherapies20,21,47,48,49 (Fig. 4c,d and Supplementary Tables 12, 15 and 16).
Fig. 4: PRRDetect improves the detection of tumors with PRR dysfunction.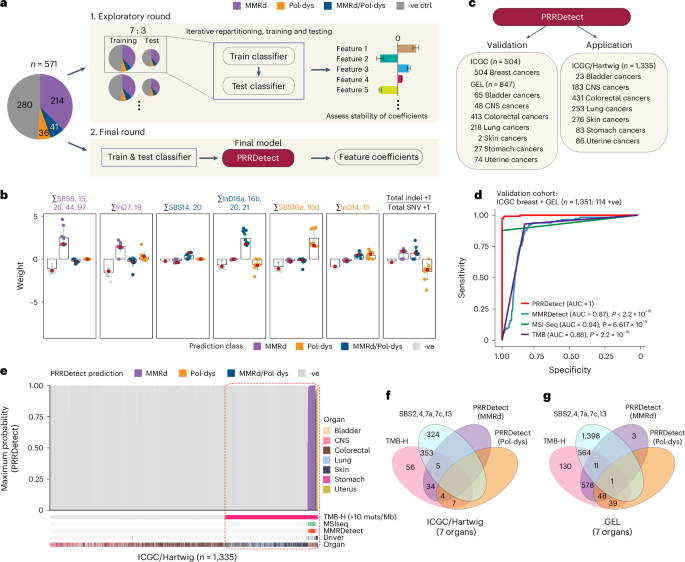
a, Simplified workflow of the development of PRRDetect classifier. (1) Initial exploratory training using 571 ground truth samples. (2) Final retraining to produce the PRRDetect classifier. -ve ctrl, negative control. b, Distribution of coefficients across seven genomic features contributing to the final PRRDetect classifier. Green error bars depict the mean ± s.d. from ten replicates of training in cross-validation. Red dots indicate the final coefficients chosen for each class prediction (Supplementary Table 14). c, Validation and application of PRRDetect on independent cancer cohorts. d, ROC curves demonstrating the superior performances of PRRDetect on independent cancer cohort (n = 1,351) against alternative biomarker strategies. P values were calculated using two-sided nonparametric test based on the bootstrap distribution (10,000) of the difference in AUCs53. MMRDetect, P −16; MSIseq, P = 6.617 × 10⁻¹⁵; TMB, P −16. e, PRRDetect results of n = 1,335 ICGC and Hartwig cancers, ordered from the lowest to the highest prediction probability across the x axis (left to right) for MMRd (purple), combined MMRd/Pol-dys (blue) and Pol-dys samples (orange). Negative samples were ordered by TMB in increasing order from left to right. Results of MSIseq, MMRDetect, cancer gene driver annotation and cancer tissue origin are labeled at the bottom tracks. Dashed rectangle highlights the extent of false positive overcalling if using TMB > 10 mutations per Mb as a cutoff. f, Concordance of calls among TMB-high (>10 mutations per Mb), positive exposure to SBS signatures that impart hypermutation and PRRDetect prediction across n = 1,335 ICGC and Hartwig cancers. g, Concordance of calls among TMB-high (>10 mutations per Mb), positive exposure to SBS signatures that impart hypermutation and PRRDetect prediction across n = 4,775 GEL tumors. muts, mutations.
Next, to survey the prevalence of PRRd across alternative cancer cohorts, we applied PRRDetect on seven cancer types commonly enriched with hypermutator samples from ICGC33 and Hartwig34 (Fig. 4c,e,f, Extended Data Fig. 10a,b and Supplementary Table 17). PRRDetect predicted 3.7% (50/1,335) samples as PRR-dysfunctional, correctly identifying all Pol-dys, MMRd/Pol-dys samples and missing two subclonal MMRd samples (based on available published driver information for PRRd status). MSIseq missed 6 of 43 PRRDetect-predicted MMRd, 2 of 4 mixed MMRd/Pol-dys cases while displaying poor concordance for detecting pure Pol-dys cases (that is, missed all 7 cases). Unsurprisingly, PRRDetect captured all MMRDetect-positive cases. However, MMRDetect failed to identify all PRRd cases as it was not designed to detect Pol-dys/mixed phenotypes and missed seven MMRd samples. Crucially, we noted that many PRRDetect-positive cases did not have an associated driver mutation identified (33/50). This is clinically significant. Of 50 PRRDetect-positive cases, 39 were MMRd (only 8 had an associated driver mutation), 7 were Pol-dys (all had driver mutations in polymerase proofreading domains) and 4 were predicted as mixed MMRd/Pol-dys (2 had POLE exonuclease mutations and none had MMR drivers). If PRRDetect predictions were all true and sequencing approaches focused exclusively on identifying driver events associated with these deficiencies were used, a significant proportion of cases (66%) could be missed.
Given that PRRd cancers often present with high TMB, and TMB is used as a biomarker for immunotherapies, we explored the limits of TMB-based patient stratification. With an FDA-approved TMB cutoff of 10 mutations per Mb49, just over a tenth of 459 cases classified as TMB-high (50/459, 10.9%) had predicted PRR dysfunction (Fig. 4f, Extended Data Fig. 10b and Supplementary Table 17). The majority of other cases (353/459, 76.9%) had high TMB from tobacco, UV and APOBEC exposure; 56 (12.2%) were due to alternative causes. Thus, across independent cancer cohorts where MMRd and Pol-dys are known to occur at higher frequencies, ~89% of the samples classified as TMB-high may not have the intrinsic biological underpinnings associated with response to immunotherapies, with implications for the use of TMB as a selective biomarker for ICI50,51.
We asked whether this trend extended to the larger GEL cohort (n = 4,775). Among the 1,371 TMB-high cases, nearly half (677, 49.4%) were predicted as having MMRd and/or Pol-dys (Fig. 4g), of which, only ~50% of them had an identified driver. The remaining 564 (41.1%) had high TMB due to alternative mutagenic exposures; 130 (9.5%) were due to other undetermined causes. Furthermore, beyond revealing PRR dysfunction in typical tumor types such as colorectal cancers (19%, 400/2,146) and uterine cancers (37%, 255/695), PRRDetect predicted PRRd in a small but notable proportion of stomach (11/181, 6%), bladder (3/347, 1%), CNS (3/392, 1%) and lung cancers (8/958, 1%; Extended Data Fig. 10c and Supplementary Table 12). This reinforces two important clinical points—first, PRRd is not restricted to colorectal and uterine cancers despite being more prevalent in these tumor types; second, WGS can serve as a tumor-agnostic assay uncovering PRRd and any other actionable biological abnormalities in the future.