
Genomic diversity of Leishmania (Viannia) clinical isolates
Sixty-five Leishmania Colombian isolates were sequenced using Illumina whole-genome shotgun sequencing to assess some of the unexplored genetic diversity of Leishmania in Colombia. According to the Lab-based molecular characterization, the selected isolates included 34 L. (V.) braziliensis (1 from the Caribbean region, 9 from the Amazonian region, 9 from the Andean region, 15 from the Orinoquia), 12 L. (V.) guyanensis (3 from the Amazonian region, 3 from the Pacific region, 6 from the Andean region), 18 L. (V.) panamensis (2 from the Pacific region, 3 from the Caribbean region, 13 from the Andean region), and 1 L. (Leishmania) from the Andean region (See Supplementary Fig. S1 and Supplementary Data 1 for details). To compare the Colombian isolates sequenced in the present study with sequenced isolates from Latin America having publicly available data, reads sequenced from 139 isolates belonging to the Leishmania (Viannia) genera were also included in the analysis, as well as 38 Leishmania (Leishmania) isolates (See “Methods” and Supplementary Data 1 for details). Although the complete dataset included samples from different species, reads from each sample were mapped against the reference genome of the L. (V.) braziliensis strain M2904 to have a common reference for variant genotyping and comparison across the complete dataset. As expected, the percentage of mapped reads was larger than 60% for each Leishmania (Viannia) sample and lower than 6% for L. (L.) samples (Supplementary Fig. S2 and Supplementary Data 1). Variant discovery integrating all aligned reads resulted in 3,844,799 SNPs identified across the Leishmania species sampled in this study. A total of 419 aneuploidies were identified from read-depth data for samples with a good percentage of mapped reads and good read coverage, following the procedure suggested by Dumetz et al.30 (Supplementary Data 1). All samples had predicted aneuploidies (mostly tetrasomies) on chromosome 31. The remaining 224 predicted events were mostly trisomies (197) scattered across chromosomes and samples.
After filtering genotype calls by minimum quality of 40, a total of 2,114,255 SNPs with Minimum Allele Frequency (MAF) > 0.01 were included in the global variation database (See statistics per isolate in the Supplementary Data 1). Approximately 48% of those SNPs were located in coding regions, and from these, 58% corresponded to synonymous variants, 41% to missense variants, and less than 0.2% affected start and stop codons. Because this database included species from the Leishmania and the Viannia subgenus, the genotyping missing data was close to 20% due to the low percentages of mapped reads obtained for L. (L.). Reads from L. (L.) samples that could be mapped are not distributed across the genome, but they are concentrated in conserved segments between species. After further filtering, keeping SNPs with at least 97.5% of genotyped individuals, removing missense and nonsense variants, and removing SNPs in chromosome 31, a maximum-likelihood (ML) phylogeny was reconstructed based on 50,543 SNPs (Supplementary Fig. S3). The separation between the Leishmania and the Viannia subgenus was highly supported and consistent with previous analyses8,21; within the L. (L.) subgenus, the separation among L. (L.) amazonensis, L. (L.) mexicana, L. (L.) tropica, L. (L.) aethiopica, L. (L.) major, L. (L.) donovani, and L. (L.) infantum was also supported. Within the L. (V.) subgenus, the L. (V.) braziliensis/L. (V.) peruviana complex and the L. (V.) guyanensis/L. (V.) panamensis complex formed two different clades with high support. However, the relationships within the two groups were difficult to visualize in this tree. From the newly sequenced data, seven samples presented inconsistencies between the clustering and the Lab-based species classification (Supplementary Data 1). The isolate LL0087, classified within the Leishmania subgenus without a species name, and the isolate LL0490, classified as L. (V.) panamensis, clustered within L. (L.) amazonensis (Supplementary Fig. S3). The samples W8252 and LL0725, classified as L. (V.) braziliensis and L. guyanensis/panamensis, respectively, turned out to have admixed DNA (details below). The isolates LL0732 and LL0775, classified as L. (V.) guyanensis, clustered within L. (V.) panamensis. The opposite situation was observed for the isolate W8104.
To investigate the species divergence within the L. (Viannia) subgenus, Maximum likelihood (ML) and Neighbor-joining (NJ) trees were constructed using a subset of the genotypic data, including exclusively L. (Viannia) isolates (Fig. 1, Supplementary Data 2, and Supplementary Figs. S4 and S5). Because this subset only included samples with good mapping percentages and genome coverage, over 13× more SNPs (673,944) could be used in this case after applying the same filters used for the complete dataset. The species L. (V.) naiffi and L. (V.) lainsoni were clearly separated in both trees. As previously observed, L. (V.) panamensis and L. (V.) guyanensis were separated from L. (V.) braziliensis and L. (V.) peruviana. Filtering of SNPs by allele frequency differences between these complexes revealed 108,131 SNPs that perfectly differentiated the two species complexes. Although these species complexes were recovered in two strongly supported groups, species within each group were not reciprocally monophyletic. Within the L. (V.) panamensis/L. (V.) guyanensis complex, the samples classified as L. (V.) guyanensis by Lab-based classical typing did not form a monophyletic group: nine samples were more closely related to the L. (V.) shawi sample, whereas the remaining four samples (UN0043, UN0049, UN0063, and W8134) formed a clade sister to most of L. (V.) panamensis isolates. Likewise, the reference L. (V.) panamensis isolate L13 did not cluster within the two major groups of this species but was more similar to the isolate UN0005, which was classified as L. (V.) guyanensis by classical markers. Regarding the L. (V.) braziliensis/L. (V.) peruviana complex, a group that included the L. (V.) braziliensis isolates from Brazil (except one) was sister to a clade with all other L. (V.) braziliensis isolates and L. (V.) peruviana. Thus, L. (V.) braziliensis was recovered as paraphyletic with L. (V.) peruviana nested within L. (V.) braziliensis.
Fig. 1: Maximum Likelihood phylogenetic reconstruction of Leishmania (Viannia) isolates.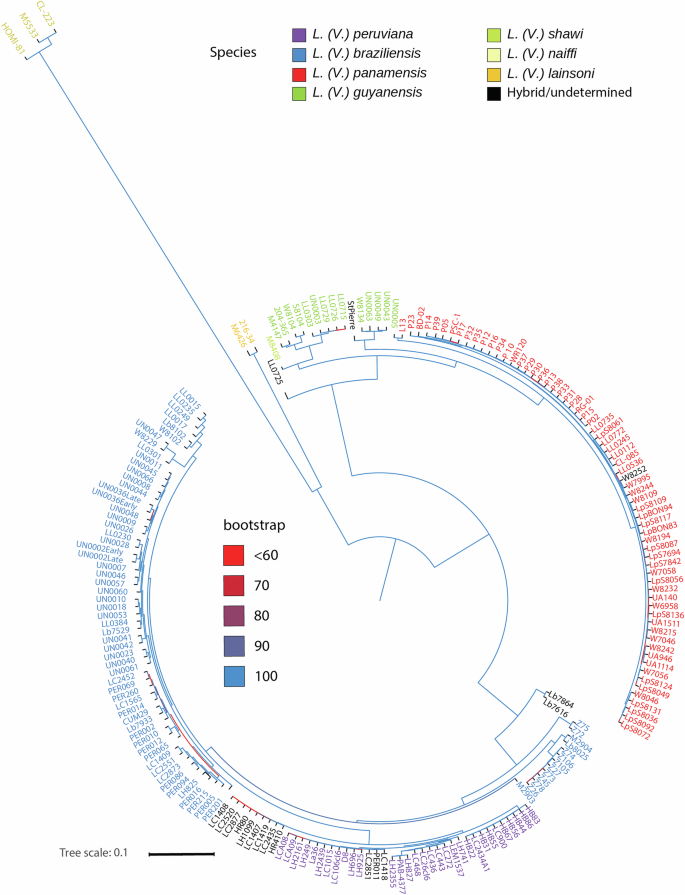
The tree was built from 673,944 SNPs segregating within L. (Viannia) after filtering to keep genotype calls with quality >40, biallelic sites, MAF > 0.01, and 200 genotyped individuals. Chromosome 31, missense, and nonsense variants were removed. The tree was rooted at the midpoint. Branch support was calculated with a 1000 ultrafast bootstrap on IQtree. Isolates are colored according to the species. A detailed visualization of branches for isolates within species can be seen in the visualization of the tree available at the Supplementary Fig. S4.
To further analyze the structure within L. (Viannia) populations, the two main species complexes were analyzed separately, following population genomic approaches. Samples belonging to the two complexes were separately selected from the global genomic variation dataset, and SNPs were further filtered within each group (See “Methods” for details). A model-based admixture analysis and a Neighbor Joining (NJ) tree were carried out for each group. Figure 2A, B show the sample clustering obtained for the L. (V.) braziliensis/L. (V.) peruviana complex (See Supplementary Data 1 and 3 for related data). Cross-validation (CV) analysis of the admixture analysis suggests K = 10 as the first local minimum of the CV error (Supplementary Fig. S6). The isolates of L. (V.) peruviana, the Brazilian isolates of L. (V.) braziliensis (population Lbra1), and the Peruvian isolates of L. (V.) braziliensis (population Lbra4) differentiate from K2, K3, and K4, respectively. Two populations within L. (V.) peruviana can be differentiated from K5 (Lper1 and Lper2), as previously reported15. Further subdivisions differentiate two populations, including the Colombian isolates of L. (V.) braziliensis (Lbra2, Lbra3). This clustering is consistent with the geographical origin of the isolates. While Lbra2 includes isolates from the Andean region, Lbra3 includes isolates from the Orinoco-Amazon region (southeast of the country). Regarding hybrids, the L. (V.) braziliensis/peruviana hybrids are shown as such throughout the entire analysis and appear as a separate group in the NJ tree. The M2903 reference strain and the Colombian Lb8025 appeared as admixed isolates between Lbra1 and Lbra2.
Fig. 2: Genetic diversity of Leishmania (Viannia) species.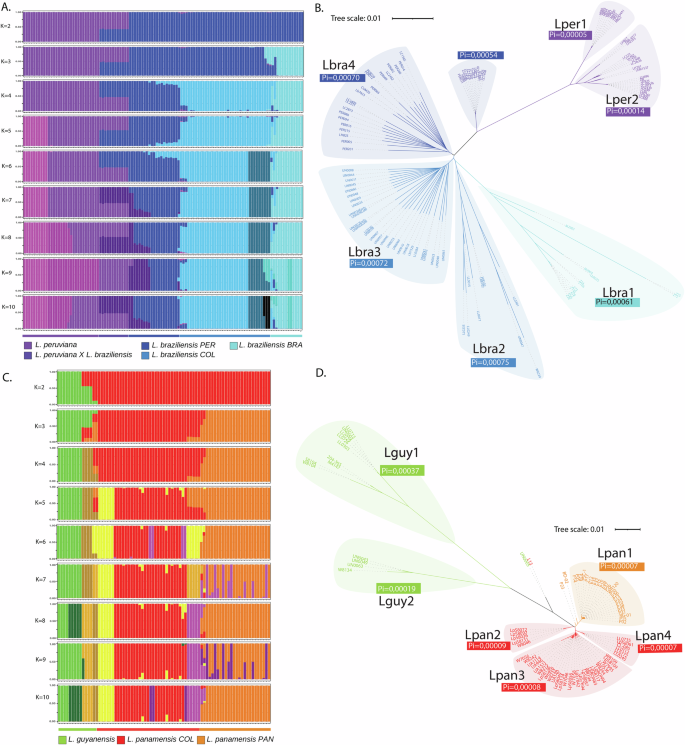
A Admixture analysis for L. (V.) braziliensis and L. (V.) peruviana. B Distance tree based on the L. (V.) braziliensis and L. (V.) peruviana SNPs identified in comparison to the M2904 L. (V.) braziliensis strain. Labels show the Pi diversity statistic. C Admixture analysis for L. (V.) guyanensis and L. (V.) panamensis. D Distance tree based on the L. (V.) guyanensis and L. (V.) panamensis SNPs identified in comparison to the M2904 L. (V.) braziliensis strain. Labels show the Pi diversity statistic. Subpopulation names are assigned for the larger species: L. (V.) braziliensis is composed of Lbra1 (Brazilian samples), Lbra2 (Colombian samples from the Andean region), Lbra3 (Colombian samples from the Orinoco-Amazonian region), Lbra4 (Peruvian samples); L. (V.) guyanensis is composed of Lguy1 (Colombian samples from the Andean region (4 samples), and 4 samples from Venezuela, French Guyana and Brazil) and Lguy2 (Colombian samples from the Pacific region); L. (V.) panamensis is composed of Lpan1 (Panamanian samples), Lpan2 (Colombian samples from the Pacific-Andean region), Lpan3 (Colombian samples from the Andean-Caribbean region), Lpan4 (Colombian samples from the Andean-Amazonian region); L. (V.) peruviana is composed of Lper1 (Peruvian samples from Porculla region) and Lper2 (Peruvian samples from the Surco region).
Regarding diversity, L. (V.) braziliensis was the most diverse species, with a Pi higher than that of L. (V.) panamensis (Supplementary Table S1). Four populations of L. (V.) braziliensis had similar genetic diversity (Pi ~0.0007), despite the lower number of isolates forming Lbra1 and Lbra2, compared to Lbra3 and Lbra4. The pairwise Fst statistic between the Colombian Lbra3 and the Peruvian Lbra4 clusters was lower (Fst 0.105) than the Fst between the Colombian Lbra2 and Lbra3 clusters (Fst 0.178, see Supplementary Table S2). Although the evolution of Leishmania diversity is not expected to follow the Wright-Fisher model, the distribution of minor allele frequency (MAF) follows a decreasing curve similar to the expected distribution of diversity under this model (Supplementary Fig. S7). Differences between expected (He) and observed (Ho) heterozygosity are centered at 0.1, suggesting a small reduction in heterozygosity produced by the population structure within L. (V.) braziliensis.
Figure 2C, D show the sample clustering obtained for the L. (V.) panamensis/L. (V.) guyanensis complex (See Supplementary Data 1 and 4 for related data). CV analysis of the admixture analysis identifies two local minimums of the CV error at K8 and K10 (Supplementary Fig. S6). The group of L. (V.) guyanensis isolates that appear more distant than the other samples in the NJ tree (Lguy1) can be observed as a separate group from K2. A second group of four L. (V.) guyanensis isolates forms a group from K4. Geographical segregation of the isolates was observed within L. (V.) panamensis. Isolates from Panama formed a cluster differentiated from the Colombian isolates from K3. This cluster was previously reported as Lpan113. Furthermore, the Colombian isolates were separated into three clusters, two of them previously reported as Lpan2 and Lpan313, and one new cluster containing isolates mostly from the eastern Andean mountain chain (Lpan4). These clusters are evident from K5 and K6 in the admixture analysis. The cluster Lpan4 contained two new isolates classified as L. (V.) guyanensis and two classified as L. (V.) panamensis samples based on classical markers; it also includes one isolate typed as L. (V.) guyanensis and one typed as L. (V.) panamensis from public databases. The Colombian isolate UN0005, typed as L. (V.) guyanensis, and the Colombian L13 L. (V.) panamensis reference isolate appear as admixes until K6, but from K7, they form a separate cluster. Finally, Lguy1 splits into two subgroups at K8 and K10, one corresponding to Colombian isolates and the other corresponding to non-Colombian isolates, including the M4147 reference strain. Regarding admixes, the P23 and BD-02 isolates appear as admixed between Lpan1 and Lpan2. This is consistent with Llanes et al.13. Between three to five isolates within Lpan3 seem to have some level of admixture with Lpan4.
The global diversity within L. (V.) panamensis (0.000121) was much lower than the diversity within other species, including L. (V.) guyanensis (Supplementary Table S1). This can be evidenced in the MAF distribution, which shows that fewer SNPs are segregating at high frequencies compared to L. (V.) braziliensis (Supplementary Fig. S7). A small peak close to 0.5 can be observed, which can be explained by the differentiation between the population from Panama (Lpan1) and the Colombian populations. The distribution of differences between expected and observed heterozygosity is also centered at 0.1, but it shows two peaks at the extremes of the distribution. Around 3000 SNPs with differences close to 0.5 (Ho close to zero) correspond to SNPs differentiating the two major groups. Nearly 3,000 other SNPs with differences close to −0.5 correspond to SNPs with high observed heterozygosity (~1). Pairwise Fst values between populations of L. (V.) panamensis were higher than 0.5 except for the comparisons involving Lpan3. This can be attributed to the low number of isolates within Lpan2 and Lpan4. The Fst between Lpan1 and Lpan3 (0.27) was high in absolute numbers, but it was comparable to Fst values between populations of L. (V.) braziliensis.
A separate admixture analysis including all isolates was carried out to investigate possible admixed isolates between the two major species complexes (Supplementary Fig. S8). Five isolates were predicted as admixed between the two major groups (StPierre, LL0725, W8252, Lb7864, and Lb7616) in this analysis. The NJ tree (Supplementary Fig. S5) placed these isolates outside the two major groups, whereas the ML tree clustered StPierre within L. (V.) guyanensis and W8252 within L. (V.) panamensis (Fig. 1). The StPierre isolate was previously reported as a triploid hybrid between L. (V.) braziliensis and L. (V.) guyanensis31. Looking at heterozygosity, StPierre, W8252, and LL0725 had larger heterozygosity rates (>10%) in comparison to well-differentiated isolates. In contrast, Lb7616 and Lb7864 had heterozygosity rates lower than 1%. Heterozygosity percentages per sample increased to more than 40% for StPierre, W8252, and LL0725 when the analysis was restricted to species fixed SNPs (Supplementary Data 1). Metagenomic analysis of reads for the samples LL0725 and W8252 confirmed that no contamination of foreign DNA was causing this pattern. More than 99% of the reads corresponded to L. (Viannia) species (Supplementary Fig. S9). The admixture results suggest that W8252 is an admixed isolate between L. (V.) panamensis and L. (V.) braziliensis, and StPierre, LL0725, Lb7616, and Lb7864 are admixes between L. (V.) guyanensis and L. (V.) braziliensis (Supplementary Fig. S8). An introgression analysis looking for population assignment of local haplotypes confirmed that StPierre is an admixed isolate between L. (V.) guyanensis and L. (V.) braziliensis. The StPierre isolate contains introgressed regions summing up to 170 Kbp across the genome (Supplementary Table S3), and 88.44% of the fixed SNPs were heterozygous. A similar behavior was observed for the sample LL0725, for which 46.92% of the species fixed SNPs were heterozygous, and up to 10 Kbp introgressions were observed. In contrast, W8252 did not have introgression traces, as 98.7% of the fixed SNPs were heterozygotes, suggesting a coinfection scenario. Finally, Lb7616 and Lb7864 were assigned to L. (V.) braziliensis by half the regions. The placement of these samples in the phylogenetic trees (Fig. 1 and Supplementary Figs. S3 and S4) suggests that these could be isolates of a different population of L. (V.) braziliensis or even a close species.
Leishmania (Viannia) species genomes are highly conserved but are differentiated by multi-copy gene families
Given the observed diversity and differentiation of Leishmania (Viannia) populations in Colombia, ten Colombian isolates were sequenced using a long reads technology (see “Methods” for details). The sequenced samples correspond to five L. (V.) braziliensis, one L. (V.) guyanensis, two L. (V.) panamensis, and two isolates in between L. (V.) guyanensis and L. (V.) panamensis. Haploid genomes were assembled into 43 to 100 contigs per assembly, with an average N50 of 975 Kbp (Supplementary Data 5). The average genome size was 34 Mbp, which was more than 2 Mbp longer than the size of the current reference genome assemblies of L. (V.) braziliensis M2904 (32 Mbp) and L. (V.) panamensis PSC-1 (30.6 Mbp). The GC content ranged between 57.66% and 57.99%, close to the GC content of the references (~57.7%). The kinetoplast maxicircle was also identified and circularized using the 12s rRNA gene as the starting point of the molecule. On average, kinetoplasts were assembled into 27.5 Kbp molecules, as expected32. Consistent with previous reports33, the alignment of the kinetoplasts showed conservation within the coding region and size variations in the divergent region (Supplementary Fig. S10).
Contigs were assigned to chromosomes according to the M2904 reference, followed by manual curation of the misassemblies between chromosomes. Each contig-level assembly was highly contiguous, having a range of 24 to 31 chromosomes reconstructed in one single contig. The number of gaps per assembly ranged between 3 and 13, according to the chromosome placement. For this reason, no scaffolding was attempted for these genome assemblies. The contigs assigned to chromosomes were consistently longer than the reference chromosomes (Supplementary Fig. S11), with large repetitions at the beginning and end of the contigs that could be related to a better resolution of the subtelomeric repetitive regions. However, due to ONT base calling errors34, it was not possible to reconstruct and quantify repetitive sequences characteristic of the telomeres.
Figure 3 shows the major genomic features of representative genomes of L. (V.) braziliensis (LL0249), L. (V.) guyanensis (UN0003), and L. (V.) panamensis (LL0536), respectively (See the related data in the Supplementary Data 5). Gaps were observed, especially in chromosomes 2, 20, and 34, and they can be related to an increased GC content (Fig. 3A–C, tracks i). The gap at chromosome 2 was consistently present across all assemblies, and it was caused by a repetitive region of 40–80 Kbp in size, which could not be resolved with the nanopore reads (Supplementary Fig. S12). Interestingly, this region is not observed in the reference genomes. The same behavior was observed in chromosome 34, where the assemblies were broken into two to three contigs, and two large repetitive regions were observed (Supplementary Fig. S13). The remaining chromosomes were assembled into 1 to 3 contigs, except for chromosome 20, which was broken into 5 contigs in some cases. Genomes were annotated considering evidence from the L. (V.) braziliensis M2904 and the L. (V.) panamensis L13 genomes (See methods for details). The total number of genes ranged between 9172 and 10,242, representing an increase of around 20% over the number of genes annotated in the current reference genomes (close to 8500 genes). Compared to the references, the increase in the gene number can be attributed to a better resolution of paralogous genes, achieved through the assembly of long reads.
Fig. 3: Genomic structure and main characteristics of Leishmania (Viannia) genomes.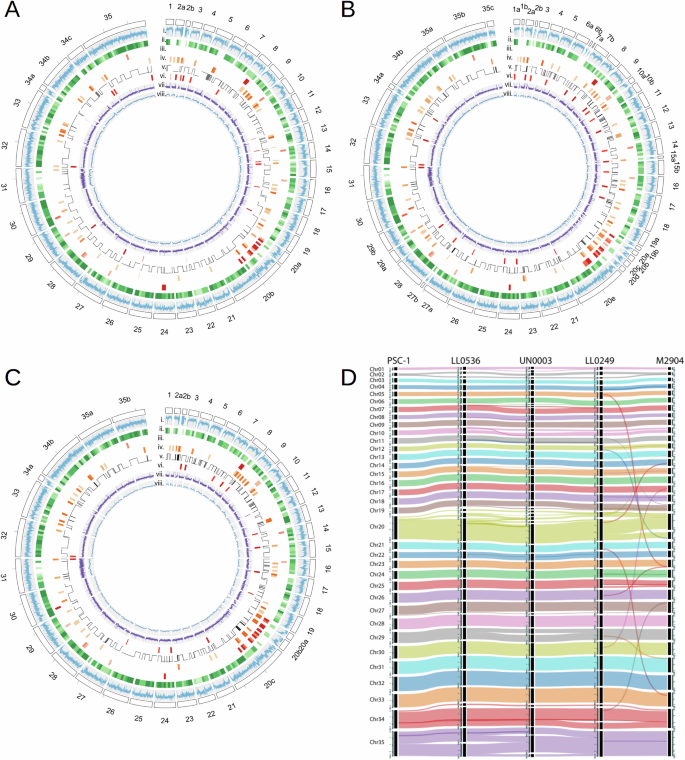
A–C Circos plots with main genomic features for A the LL0249 L. (V.) braziliensis isolate, B the UN0003 L. (V.) guyanensis isolate, and C the LL0536 L. (V.) panamensis isolate. The tracks show (i) GC content, (ii) density of core-genes, (iii) the density of genes coding for amastin surface glycoproteins, (iv) distribution of multi-copy gene families (at least 5 copies), (v) strand switches, (vi) distribution of TATE retroposons, (vii) Illumina sequencing depth (0–300×), (viii) Nanopore sequencing depth (0–100×). D Genome alignment of the M2904 and PSC-1 reference genomes and the assembled genomes of the isolates LL0249, UN0003, and LL0536.
Synteny conservation among isolates and species was assessed by aligning all genomes using the synteny relationships inferred from gene ortholog relationships. Figure 3D shows the alignment among the three representative genomes, compared to the L. (V.) braziliensis M2904 and L. (V.) panamensis PSC-1 references (see all assemblies in Supplementary Fig. S14 and the blocks in the Supplementary Data 5). Each contig could be assigned to one chromosome in the reference M2904; however, two misassemblies in the reference were identified (Supplementary Fig. S15); all the contigs assigned to chromosome 11 consistently contained a region previously reported as part of chromosome 19, and a similar misassembly was observed between chromosome 12 and the end of chromosome 20. These misassemblies were also resolved in the non-referenced M2904 assembly reported in 201922, available at TriTrypDB35. Chromosome 20 of L. (Viannia) species has been reported as a fusion between chromosomes 20 and 34, compared to old-world L. (Leishmania) species36.
Although the chromosome number and general genomic structure are conserved within the species, a gene-based pangenome analysis within Leishmania (Viannia) revealed important presence-absence variation affecting gene content. This pangenome, comprising 8749 orthogroups, also allowed us to identify the core-genome, as well as multicopy genes and species-specific genes. The exact core-genome comprised 6635 orthogroups containing genes present in all assemblies, including the references. Among these orthogroups, 4934 were single-copy genes, 35 were duplicated, and the remaining had three or more copies per genome. The size of this core-genome corresponds to nearly 60% of the genome, supporting the conservation of the gene content across the species in terms of functionality. These core-genes are distributed across the entire genome (Fig. 3A–C, tracks ii). Also, 25 additional orthogroups were identified as single-copy genes in our isolates but were absent in the references.
On the other hand, 122 multicopy orthogroups were identified. Each orthogroup could be mapped to a gene family (determined by functional domains); however, some highly divergent gene families were divided into several orthogroups. Only one gene family had, on average, more than 100 genes per genome, whereas the majority had, on average, between 5 and 37 genes per genome. A larger number of copies were annotated in the new assemblies for all gene families, compared to the references: the amastin surface glycoproteins gene family (190 vs 51) mainly located in chromosomes 8 and 20, the GP63 leishmanolysin gene family (37 vs 18) located in chromosomes 10 and 31, the alpha and beta tubulin families (41 vs 8) located in chromosomes 8, 13 and 33, the Autophagy ATG8 gene family (30 vs 4) located in chromosomes 9 and 19, the Tuzin coding genes (85 vs 13) located in chromosome 20 and associated with amastins, and the EF-1alpha coding genes (16 vs 1) located in chromosome 17. Also, more TATE DNA retroposons were found in our assemblies compared to the reference genomes (74 vs 15). These repetitive elements were mainly found in subtelomeric regions (Fig. 3A–C tracks vi).
A principal component analysis (PCA) of the number of copies in multicopy orthogroups differentiated species within the Leishmania (Viannia) subgenus, except for the previously assembled reference genomes (Supplementary Fig. S16). The first principal component separated the current reference genomes (PSC-1, L13, and M2904) from the isolates sequenced in this study. The second principal component separated the new assemblies of L. (V.) panamensis/L. (V.) guyanensis isolates from the new assemblies of L. (V.) braziliensis. As mentioned above, this result is a consequence of the lower number of copies that could be recovered for multicopy orthogroups in the previous assemblies. Excluding the reference genomes, the counts of 35 orthogroups were statistically different between L. (V.) braziliensis and L. (V.) panamensis/guyanensis complex, based on a non-paired Wilcoxon test (Supplementary Data 5). Besides amastin coding genes (described below), gene families with functional annotations and different copies between the L. (V.) panamensis/guyanensis complex and the L. (V.) braziliensis, were those encoding an ATP-dependent DEAD-box helicase (7 vs 3), a ubiquitin conjugation enzyme (7 vs 3), a kinesin (6 vs 3), an elongation factor (5 vs 1) and a sugar transporter (9 vs 4). On the other hand, genes encoding a peptidase (29 vs 51), the leishmaniolysin (18 vs 49), an epidermal growth factor (10 vs 17), a phosphatidic acid phosphatase (5 vs 11), and a glycerol uptake protein (3 vs 7) presented more copies within the L. (V.) braziliensis genomes.
Investigation of gene nucleotide and amino acid evolution through the rate of synonymous mutations (Ks) and non-synonymous to synonymous mutations (ka/ks) on core genes revealed patterns consistent with the phylogenetic relationships among species (Supplementary Fig. S17). Ks values below 0.05 were observed in all pairwise comparisons between L. (Viannia) genomes, suggesting recent diversification. In contrast, values above 0.5 were observed when comparing L. (Viannia) against L. (Leishmania) species. Regarding protein evolution, the Ka/Ks ratio is lower than 0.5 in all comparisons, suggesting that purifying selection acts on core genes across the species. Outliers are differentiated from the distribution and have Ka/Ks values close to or above 1. Although, theoretically, genes with Ka/Ks values above 1 should be investigated as genes under diversifying selection, we observed that in most of these cases, the overall number of mutations was low, which produced an artificial inflation of ratios. Only three genes had Ks > 0.05 and Ka/Ks > 1 within the L. (Viannia) comparisons, two annotated as hypothetical proteins and one annotated as a zinc finger.
Genomic organization and evolution of amastin genes in Leishmania (Viannia)
Amastin surface glycoproteins are reported as the largest gene-family in Leishmania species37 and are mostly expressed during the parasite infective amastigote stage38. Genes annotated as amastins or amastin-like proteins were found in 31 different orthogroups. These orthogroups are consistent with amastin subfamilies and with the genomic location of each copy. Five of the 31 orthogroups discriminated between the two major species complexes, reflecting the divergence in sequence between species. The total number of genes annotated as amastins varied from 152 to 291 in our assemblies, consistently higher than previous reports and expected counts in previous studies37,39,40. This difference was produced by a large expansion of amastin paralogs located in chromosome 20 (Supplementary Table S4 and Supplementary Fig. S18).
A phylogeny across the gene family, based on amino acid sequences, shows that amastin proteins are grouped by sub-families (Fig. 4A and Supplementary Data 6). Close paralogs also seem to be clustered by genomic location. Copies belonging to the same species complex tend to group but are widely distributed along the phylogeny. Amastins belonging to α, β, and γ sub-families are closely related and differentiated from the genes belonging to the δ sub-family. A tandem pair of structurally distinct α amastins was found in chromosome 28 in all isolates. These amastins were previously described, and within them, a tandem pair in chromosome 14 clustered together. Although these isoforms in chromosome 14 were previously described as δ amastin, the inclusion of copies in ten genomes allowed us to improve their classification as α amastins. Chromosome 24 included a large array of between three and fifteen copies of γ amastins per genome assembly. Also, a tandem gene array comprising multiple copies of two β isoforms of the amastin was identified in chromosome 30. Finally, the δ amastin subfamily was distributed across the genome. The largest clusters comprised gene arrays in chromosomes 8 and 20 (over 100 copies per genome). These arrays varied in the copy number and the size of amastin genes, and some of them in chromosome 20 were intercalated with Tuzin genes. A single copy in chromosome 29 was identified and classified also as δ amastin. Amastin proteins vary in size and structure, even between tandem paralogs; however, most of them contain four predicted transmembrane regions (TM) and the amastin 11-aa signature40 (Fig. 4B, C). Four single-copy genes in chromosomes 8, 16, 27, and 35 were annotated by Companion as amastins. Although these sequences contain similar transmembranal domains and match the PFAM motif PF07344, the amastin signature was not identified in the sequences (Supplementary Fig. S19).
Fig. 4: Amastin surface glycoproteins evolution within Leishmania (Viannia) isolates.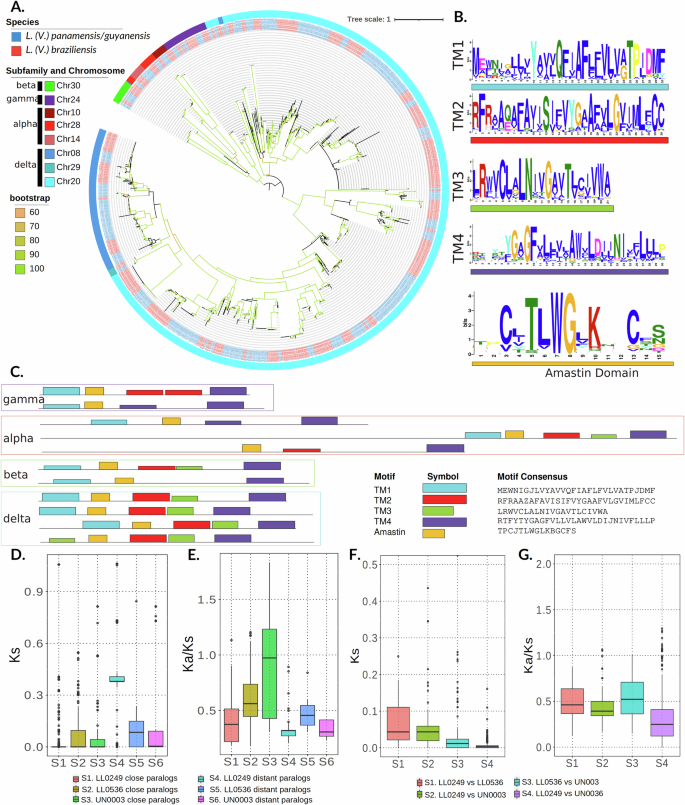
A Amastins maximum-likelihood phylogeny using the entire repertoire of amastins in 10 Leishmania (Viannia) genomes. Branches colors show the bootstrap values. The color of the nodes corresponds to the species complex, and the color of the outer strip corresponds to the chromosome where each sequence was found. Chr30 corresponds to β-amastins, Chr28 and 14 correspond to α-amastins, Chr24 corresponds to γ-amastins. The remaining chromosomes correspond to δ-amastins. B Conserved domains between amastin proteins represented as the MEME logo for each domain. C Pattern of conserved domains in each amastin subfamily. D, E Ks and Ka/Ks respectively among close and distant amastin paralogs of Leishmania (Viannia) isolates: LL0249 and UN0036 (L. (V.) braziliensis), UN0003 (L. (V.) guyanensis), LL0536 (L. (V.) panamensis). See sample sizes and p values in the Supplementary Table S5. F, G Ks and Ka/Ks respectively among amastin orthologs of Leishmania (Viannia) isolates: LL0249 (L. (V.) braziliensis), UN0003 (L. (V.) guyanensis), LL0536 (L. (V.) panamensis). See sample sizes and p values in the Supplementary Table S6. Middle lines are medians and box limits represent first (Q1) and third (Q3) quartiles. Lines are drawn from Q1 minus 1.5 of the interquartile range (IQR) to Q3 + 1.5*IQR.
Similar to the analysis of core genes, we calculated nucleotide and protein evolution statistics for amastin paralogs within species (Fig. 4D, E and Supplementary Data 7) and orthologs between species (Fig. 4F, G and Supplementary Data 7). The Ks values for paralogs that could be aligned were, on average, below 0.06 for close paralogs. In contrast, the average Ks for pairwise comparisons of paralogs between chromosomes was 0.44 for L. (V.) braziliensis, 0.09 for L. (V.) panamensis, and 0.17 for L. (V.) guyanensis. All pairwise differences between groups, including L. (V.) braziliensis genes, were significant (p value L. (V.) panamensis and L. (V.) guyanensis were significantly lower than the Ks values for distant paralogs of L. (V.) panamensis. The distribution of Ka/Ks ratios suggests some level of purifying selection, except for the group of close paralogs within L. (V.) guyanensis. Comparisons of amastin orthologs between species (Fig. 4F, G) resemble those obtained from core orthologs (Supplementary Fig. S17).