Genome-wide meta-analyses identify new loci for infertility
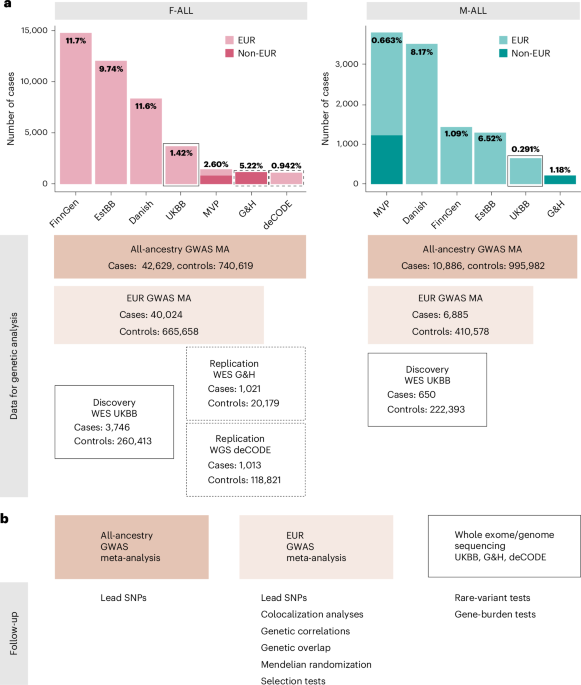
We identified female infertility of all causes (F-ALL), anatomical causes (F-ANAT), anovulation (F-ANOV), unknown causes (that is, idiopathic infertility as defined by exclusion of known causes of infertility (anatomical or anovulatory causes, PCOS, endometriosis or uterine leiomyomas)) (F-EXCL) or idiopathic infertility defined by inclusion of diagnostic codes for idiopathic infertility (F-INCL), as well as male infertility of all causes (M-ALL) in seven cohorts, primarily of European ancestry (EUR) (Fig. 1 and Supplementary Tables 1 and 2). The case–control ratio of all-cause female infertility ranged from 0.9% in the deCODE Genetics dataset to 11.7% in FinnGen, whereas the case–control ratio of male infertility was between 0.3% (UK Biobank (UKBB)) and 8.2% (Danish Biobank) (Fig. 1 and Supplementary Table 2). Anatomical female infertility was the least common cause of infertility in three of six cohorts (prevalence in UKBB of 0.01%, FinnGen of 0.8% and Estonian Biobank (EstBB) of 2.0%). Owing to varying sample ascertainment, the case–control ratio does not necessarily reflect the population prevalence of infertility.
Fig. 1: Overview of study cohorts and analyses for infertility genetic association studies.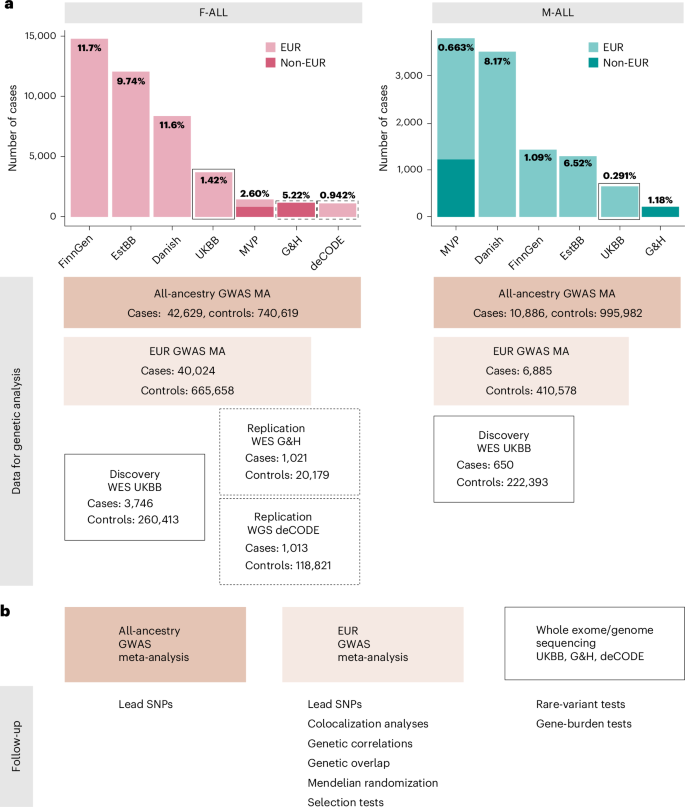
a, The case numbers in each cohort contributing to GWAS meta-analyses (MA) for female (left) and male (right) infertility. The prevalence of all-cause infertility in each cohort (%) is noted on the bar plots. Danish, Danish Blood Donor Study/Copenhagen Hospital Biobank. Total case and control counts for each type of genetic analysis: all-ancestry GWAS meta-analysis, EUR-only GWAS meta-analysis and WES analyses (discovery, UKBB and replication, G&H and deCODE) are displayed. Male infertility in deCODE, with y-axis scales in each subplot. b, Downstream analyses performed for each type of genetic analysis: lead variants were identified via distance-based pruning for all-ancestry and EUR-only GWAS meta-analyses; colocalization, genetic correlations (genome wide and local), genetic overlap and selection analyses were only performed for EUR meta-analyses due to the need for ancestry-matched LD information; rare-variant and gene-burden discovery tests were performed with WES data for the UKBB EUR-ancestry subset and replicated in individuals with WES data in G&H and whole-genome sequencing (WGS) data in deCODE.
Novel genetic loci for infertility
We performed GWAS meta-analyses, testing up to 33 million genetic variants for associations with each of the above categories of infertility, in up to 42,629 cases and 740,619 controls in women, and 10,886 cases and 995,982 controls in men (Fig. 1 and Supplementary Table 2). We identified 22 unique genome-wide significant (P −8) loci associated with at least one category of female infertility and three loci for male infertility (minor allele frequency (MAF) range 0.06–46%) (Fig. 2, Table 1 and Supplementary Fig. 1). Fourteen loci (63.6%) for female infertility reached nominal significance (P −3, Bonferroni correction for 22 independent loci tested) in at least one other infertility category (Supplementary Note and Supplementary Fig. 19). There was no evidence for heterogeneity in lead variant effects across cohorts (Supplementary Note and Supplementary Table 3).
Fig. 2: Miami and Manhattan plots for selected infertility meta-analyses.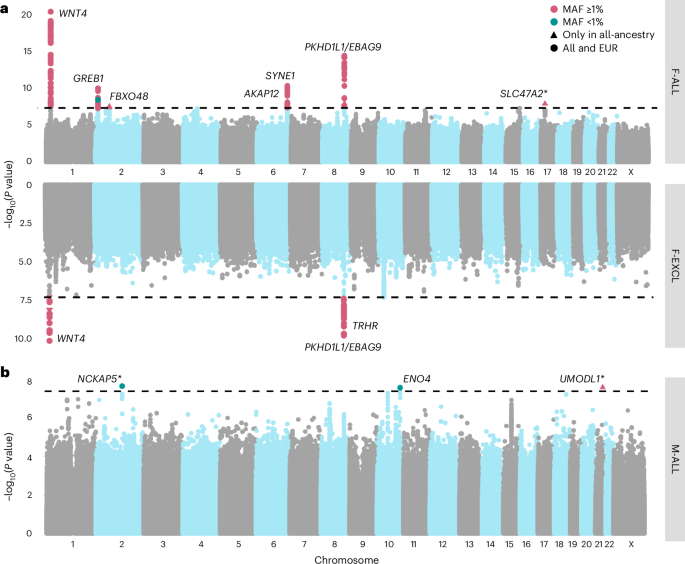
a, Genetic variants associated with F-ALL (top) and idiopathic infertility (unknown causes) defined by exclusion of known causes such as anatomical or anovulatory causes, PCOS, endometriosis and uterine leiomyomas (bottom). b, Genetic variants associated with M-ALL. Each point depicts a single SNP. The triangles represent SNPs that only reach genome-wide significance in all-ancestry GWAS meta-analyses. SNPs are annotated with the mapped gene. *The lead variant is reported in only one cohort. Summary statistics from whole-genome regression analyses were meta-analyzed using fixed-effect inverse-variance weighting in the METAL software to produce the displayed P values. The dashed line represents the multiple testing-corrected P value threshold of P −8, accounting for ~1 million independent variants in the genome.
Table 1 Lead variants associated with infertility on GWAS meta-analyses
Among the variants associated with multiple subtypes of female infertility is rs9643050 (MAF of 6.01%), an intronic variant in PKHD1L1 (F-ALL, odds ratio (OR) (95% confidence interval (CI)) 1.13 (1.09–1.16); F-EXCL, OR 1.13 (1.09–1.17); F-INCL, OR 1.18 (1.11–1.25)). This variant is 76 kb upstream of EBAG9, an estrogen-responsive gene previously reported to have a recessive association with female infertility12,13 and thought to suppress maternal immune response during pregnancy14,15. We also identified an intronic variant in WNT4, rs61768001 (MAF of 16.5%), associated with three categories of female infertility (F-ALL, OR 1.10 (1.08–1.12); F-EXCL, OR 1.08 (1.06–1.11); F-INCL, OR 1.15 (1.11–1.19)). WNT4 is highly pleiotropic for female reproductive traits, as it is reported to associate with gestational length16, uterine fibroids17,18, endometriosis19,20, female genital prolapse21 and bilateral oophorectomy21. Such pleiotropy reflects the role of WNT4 as a key regulator of female reproductive organ development during embryogenesis22.
The nearest gene to the idiopathic infertility-associated variant rs111597692 (MAF of 3.23%; F-EXCL, OR 1.16 (1.10–1.22)) is TRHR, which encodes the thyrotropin-releasing hormone receptor. Mice with Trhr knockout display a phenotype similar to primary ovarian insufficiency23. The F-ANOV-associated variant rs72827480 (MAF of 40.1%, OR 1.10 (1.07–1.14)) colocalizes with a testis expression quantitative trait locus (eQTL) for INHBB in the GTEx Project (posterior probability (PP) of shared causal variant of 91.6%; Supplementary Table 4). INHBB encodes the beta subunit of inhibin B, which regulates hypothalamic, pituitary and gonadal hormone secretion24, and ovarian follicle and oocyte development25. rs111749498 (MAF of 2.73%, associated with F-ALL, OR 2.29 (1.72–3.04)) is near SLC47A2, which encodes a multidrug efflux pump that mediates excretion of the drug metformin, commonly used to manage infertility in women with PCOS26. Variants associated with all-cause female infertility are in genes enriched for expression in ovarian stromal cells (partitioned heritability P = 2.52 × 10⁻³; Supplementary Note).
The male infertility-associated variant rs75957543 (MAF of 1.25%, OR 1.67 (1.39–2.01)) is near UMODL1, which encodes the olfactorin protein, expressed along the migratory route of gonadotropin-releasing hormone neurons. Impairment of gonadotropin-releasing hormone migration is a feature of Kallmann’s syndrome, the most common genetic cause of hypogonadotropic infertility27. While mutations in UMODL1 have been shown to impact ovarian follicle development, granulosa cell apoptosis and female fertility in model organisms28,29, its role in male infertility remains unclear. Finally, an intronic variant in ENO4, which is expressed in the testis and may play a role in sperm motility30, is associated with male infertility (rs139862664, MAF of 0.72%, OR 2.58 (1.84–3.60)). Male mice with Eno4 knockout display infertility, abnormal sperm morphology and physiology and decreased testis weight, among other altered male reproductive tract phenotypes31.
Relationships with other female reproductive conditions
Genome wide, we observed positive genetic correlations (Fig. 3a) between endometriosis and F-ALL (rg (s.e.m.) = 0.585 (0.0785), P = 8.98 × 10⁻¹⁴) and F-INCL (rg = 0.710 (0.115), P = 5.94 × 10⁻¹⁰). We also observed positive correlation between F-ANOV and PCOS, the most common cause of anovulatory infertility (rg = 0.403 (0.131), P = 2.20 × 10⁻³). We tested for local bivariate genetic correlations between infertility and PCOS, endometriosis, heavy menstrual bleeding and uterine fibroids at 2,495 blocks across the genome, chosen to be approximately 1 Mb in length each, while minimizing linkage disequilibrium (LD) between blocks. Consistent with the genome-wide rg, we found positive local rg between female infertility and reproductive disorders at 11 regions (P −5, Bonferroni adjustment for 2,618 local bivariate tests performed at regions with significant heritability of both traits in each pair tested; Fig. 4a and Supplementary Table 22). At 5/11 blocks, infertility was correlated with more than one reproductive condition, none of which had individual effects after conditioning upon the other associated reproductive disorders in the region (all P > 0.05; Supplementary Table 22).
Fig. 3: Genetic correlations between female infertility and other phenotypes.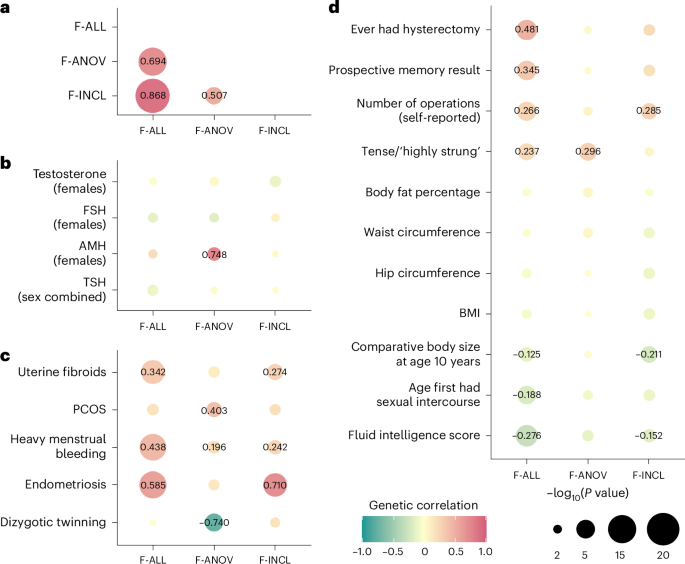
SNP-based genetic correlations (rg) between significantly heritable phenotypes (Z > 4) were estimated using LD-score regression, performed using the LDSC software on a subset of 1 million HapMap3 SNPs. The points are colored by rg estimate, scaled by significance (−log10(P)), and labeled with the associated rg estimate if nominally significant without correction for multiple testing (P a, Genetic correlations among three definitions of female infertility (F-ALL, F-ANOV and F-INCL). b, Genetic correlations between female infertility traits and reproductive hormones testosterone, FSH and AMH (publicly available summary statistics) in female-specific analyses and TSH (publicly available summary statistics) from sex-combined analysis. c, Genetic correlations between female infertility traits and female reproductive conditions, with summary statistics generated from the largest available EUR-ancestry studies for each trait (Methods). d, Genetic correlations between female infertility traits and selected heritable phenotypes (Z > 4) in the UKBB, as generated by the Neale laboratory. Correlations with all heritable phenotypes can be found in Supplementary Table 12.
Fig. 4: Local genetic correlations and polygenic overlap between female infertility and other phenotypes.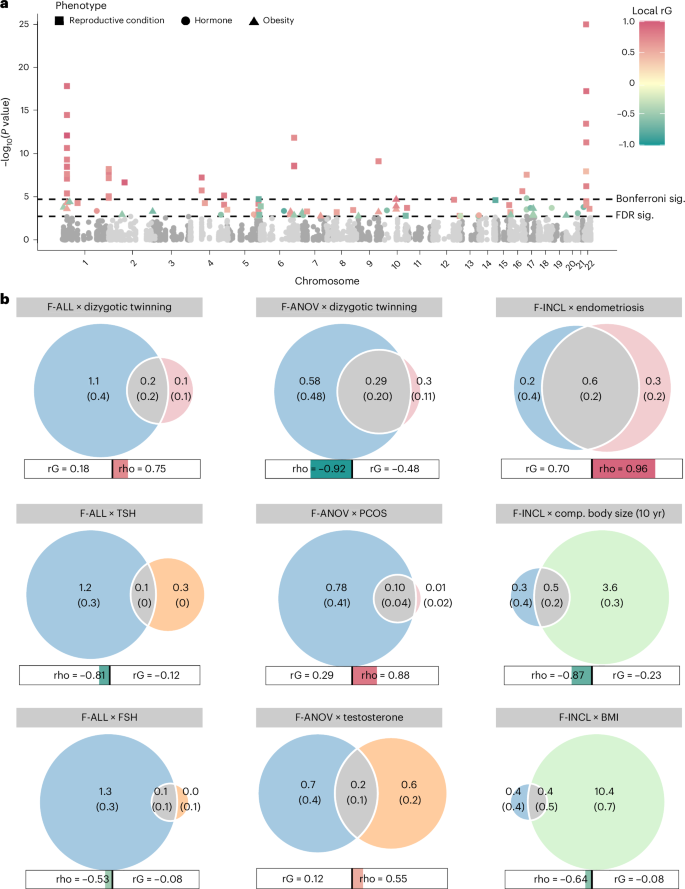
a, Local genetic correlations, estimated using LAVA, at 2,495 blocks across the genome. Each point represents a local bivariate genetic correlation between an infertility trait (F-ALL, F-ANOV or F-INCL) and reproductive hormone, reproductive condition or obesity-related trait. The dashed lines indicate significance (sig.) thresholds. The dashed line represents FDR-adjusted or Bonferroni-adjusted P values of 0.05. b, MiXeR estimates of polygenic overlap. The Venn diagrams indicate the estimated number (s.e.m.) of causal variants (in thousands) that explain 90% SNP heritability per component. The circle size reflects the degree of polygenicity. The bars outline the genome-wide genetic correlation (rG) and correlation in the shared polygenic component (rho). The colored portion of the bar is sized by the proportion of causal variants in the shared polygenic component as compared with all causal variants involved and colored by rho. Comp., comparative.
Furthermore, we used MiXeR32 to assess bivariate polygenic overlap, regardless of genome-wide genetic correlation, between infertility and reproductive conditions. We found that approximately 50% of causal single-nucleotide polymorphisms (SNPs) involved in endometriosis, and about 25% of causal SNPs involved in uterine fibroids were shared with the assessed infertility phenotypes, with varying degrees of genetic correlation in the shared component (Fig. 4b, Supplementary Table 24 and Supplementary Note). We noted that while there was substantial correlation in the shared component of F-ANOV and PCOS (rho (s.e.m.) of 0.878 (0.242)), only 97 (10.9%) of the 888 causal variants involved were shared; the majority (88.2%) of variants were unique to F-ANOV and only 8 variants (4b and Supplementary Table 24).
We observed genome-wide negative correlation between F-ANOV and spontaneous dizygotic twinning, a heritable metric of female fecundity that captures the propensity for multiple ovulation33 (rg = −0.740 (0.182), P = 4.93 × 10⁻⁵). We also found substantial negative correlation in the shared polygenic component of these traits (rho (s.e.m.) = −0.920 (0.129)), with 32% (295) shared SNPs of the 912 total causal SNPs involved (Fig. 4b, Supplementary Table 24 and Supplementary Note).
Two loci associated with both endometriosis and female infertility (WNT4 and ESR1) may share the same putative causal variant (PP >93.6%; Supplementary Table 5). Variants in both these genes have previously been associated with endometriosis-related infertility34,35. GREB1 and SYNE1 also contain overlapping signals for infertility and endometriosis, but there is strong evidence against shared causal variants (PP >75%; Supplementary Table 5). Finally, three of eight loci for anovulatory infertility (INHBB, TTC28 and CHEK2) may share a causal variant with PCOS (PP >89.2%; Supplementary Table 5).
Evolutionary persistence of infertility-associated variants
The genome-wide SNP heritability estimates (on the liability scale, accounting for disease prevalence) for all categories of infertility were 6). This is lower than heritability estimates of two-thirds of all heritable binary phenotypes in the UKBB, with population prevalence similar to that of infertility (64 phenotypes with Z > 4 and prevalence 36. We hypothesized that infertility risk-increasing alleles are subject to negative selection37, so we tested whether there was evidence for (1) variants associated with infertility in loci under historical or recent directional selection38 or (2) recent directional selection (over the past 2,000–3,000 years) measured by singleton density scores (SDSs)39 and balancing selection measured by standardized BetaScan2 scores40 at infertility loci (Supplementary Note).
While we found no genome-wide signature of directional selection against infertility (Supplementary Note), we observed extreme SDSs (in the highest 99.75th percentile of SNPs within 10 kb of a GWAS catalog variant) at the EBAG9 locus associated with female infertility, indicating recent positive selection (Fig. 5 and Supplementary Table 7).
Fig. 5: Directional selection scores at infertility-associated EBAG9 locus.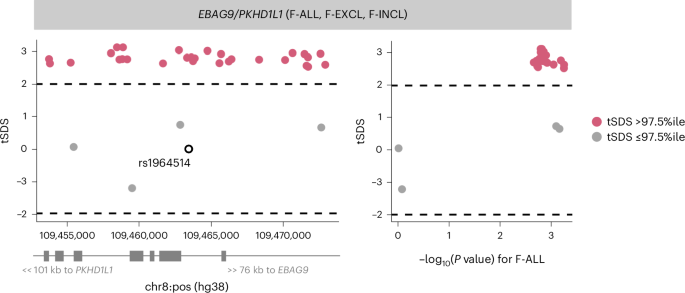
Recent directional selection, as measured by trait-aligned SDSs (tSDSs) at the EBAG9 locus. The window of ±10 kb around the lead variant associated with F-ALL is displayed, along with the location of nearest gene TSSs. The tSDSs are aligned to the infertility risk-increasing allele, wherein a positive tSDS indicates positive selection for infertility risk-increasing allele at the locus. The dashed lines indicate 2.5th percentile (%ile) and 97.5th %ile of SDSs. Left: a locus plot depicting genomic position on the x axis and tSDS on the y axis. The lead variant rs1964514 (open circle) is not present in the tSDS dataset and thus is assigned a score of 0. Right: a scatter plot depicting relationship between −log10 of the GWAS P value for the variant association with F-ALL on the x axis and tSDS on the y axis.
Genetic determinants of reproductive hormone levelsIdentification of novel reproductive hormone loci
As hormone dysregulation is central to many infertility diagnoses5,6, we conducted sex-specific GWAS meta-analyses of five reproductive hormones—follicle-stimulating hormone (FSH) (nfemale = 57,890, nmale = 6,095), luteinizing hormone (LH) (nfemale = 47,986, nmale = 6,769), estradiol (nfemale = 97,887, nmale = 39,165), progesterone (nfemale = 18,368) and total testosterone (nfemale = 246,862, nmale = 243,951)—collected at assessment center visits or identified through electronic health records, in six cohorts and publicly available summary statistics (Supplementary Table 9). We identified genome-wide significant loci associated with FSH (9 novel/2 previously known in females and 0/1 in males), LH (4/2 in females and 1/0 in males), estradiol (1/1 in females and 3/4 in males) and testosterone (39/118 in females and 67/206 in males), but found no genetic variants associated with progesterone (Supplementary Figs. 3, 4 and 20). Several of the reported signals we replicated are near genes encoding the hormone-specific subunits themselves, such as FSHB for FSH and LHB for LH, or enzymes for steroid-hormone metabolism, such as CYP3A7 for estradiol and HSD17B13 for testosterone (Supplementary Note).
Among the novel variants for testosterone in men were those near SPOCK1 (rs1073917: MAF of 30.7%, β (s.e.m.) = 0.0160 (0.0029), P = 4.69 × 10⁻⁸), which is a target for the androgen receptor41, and NR4A3 (rs10988865: MAF of 27.4%, β = 0.0161 (0.0029), P = 4.33 × 10⁻⁸), which coordinates the cellular response to corticotropin hormone- and thyrotropin hormone-releasing stimuli42 (Supplementary Table 10). Novel reproductive hormone variants associated with testosterone in women include those near LAMTOR4 (rs17250196: MAF of 5.13%, β = −0.131 (0.0067), P = 4.02 × 10−86), associated with hyperthyroidism23 and age at menarche and menopause43, and obesity-associated CCDC146 (rs138240474: MAF of 0.63%, β = −0.116 (0.0207), P = 2.03 × 10⁻⁸)44, which is expressed in the fallopian tubes and endometrium45.
Clinical measurements of FSH and LH may be used to diagnose premature menopause46, but our hormone GWASs based on these measurements were robust to this potential ascertainment bias (Supplementary Note). They were also robust to the inclusion of summary statistics from publicly available datasets and there was no evidence for heterogeneity in variant effects across cohorts (Supplementary Note).
Relationships with other heritable phenotypes
We observed no genome-wide genetic correlations between any category of female infertility and (1) any reproductive hormone in this study, (2) thyroid stimulating hormone (TSH) or (3) anti-Mullerian hormone (AMH), the latter two based on publicly available summary statistics47,48 (all P > 0.05, except the correlation between AMH and F-ANOV, rg (s.e.m.) = 0.748 (0.301), P = 0.0131; Fig. 3b). Consistent with the genome-wide results, we also found no evidence for local genetic correlations between any category of infertility and the above hormones (all P > 1.91 × 10⁻⁵; Fig. 4a, Supplementary Table 22 and Supplementary Note). The limited genetic correlation between infertility and reproductive hormones was mirrored in polygenic overlap analyses. The highest proportion of shared SNPs between these traits was 14.5% between F-ANOV and testosterone (209/1,444 variants shared, rho (s.e.m.) of 0.549 (0.252) in the shared polygenic component), followed by 14.0% between F-ANOV and AMH (123/881, rho (s.e.m.) of 0.993 (0.0301); Fig. 4b and Supplementary Table 24).
Mendelian randomization (MR) analyses indicated a genetically causal protective effect of FSH on risk of F-ALL (OR (95% CI) 0.776 (0.678–0.888), P = 2.15 × 10⁻⁴) and F-EXCL (0.716 (0.604–0.850), P = 1.26 × 10⁻⁴) (Supplementary Table 11). We found evidence for shared variants between hormones and infertility at the FSHB locus associated with FSH, LH and testosterone (PP >84.8% for colocalization with F-ANOV), and the ARL14EP locus associated with LH (PP 89.3% for colocalization with F-ANOV) (Supplementary Table 12). There was no evidence for colocalization at any of the >300 other genome-wide significant loci associated with infertility or reproductive hormones in our study (Supplementary Table 12).
Across 702 heritable phenotypes in the UKBB, we found 15 traits to be genetically correlated with female infertility, which we broadly group into: female reproductive conditions (such as having had a hysterectomy, rg (s.e.m.) = 0.481 (0.0963)), general illness (such as number of operations, rg = 0.266 (0.0588)), and cognitive test results (overall prospective memory test rg = 0.345 (0.0736) and overall fluid intelligence rg = −0.276 (0.0502)) (Fig. 3d and Supplementary Table 13). We found that 24 obesity-related traits, including body mass index (BMI), waist-to-hip ratio (WHR) and body fat percentage, were correlated with testosterone and FSH, but not with any category of female infertility (all P > 0.05; Fig. 3d, Supplementary Fig. 7 and Supplementary Table 13).
We found no evidence for local genetic correlations between any category of infertility and five obesity-related traits at 2,495 regions across the genome at a Bonferroni-adjusted significance threshold (all P > 1.91 × 10⁻⁵; Fig. 4a, Supplementary Table 22 and Supplementary Note). Polygenic analyses also revealed only limited overlap between infertility and obesity: fewer than 10% of causal SNPs involved were shared between infertility and any of the five obesity-related traits assessed (Fig. 4b, Supplementary Table 24 and Supplementary Note). The low overlap may reflect the polygenicity of obesity (between 4,050 and 11,000 causal variants), of which the majority (between 73.2% and 93.0%) are not involved in infertility (Supplementary Tables 23 and 24). Despite limited overlap, there was substantial negative correlation in the shared genetic components between F-INCL and comparative body size at age 10 years (451 shared SNPs of 4,385 involved, rho (s.e.m.) of −0.874 (0.143)) and adult BMI (393/11,185, rho (s.e.m.) of −0.640 (0.262)) (Fig. 4b and Supplementary Table 24).
Finally, MR analyses using genetic instruments for BMI, WHR and WHR adjusted for BMI (WHRadjBMI) indicated evidence for bidirectional causal relationships between infertility and abdominal obesity, independent of overall obesity. While genetically predicted WHRadjBMI was a risk factor for F-ALL (OR (95% CI) 1.10 (1.05–1.16), P = 1.71 × 10⁻⁴) and F-ANOV (OR 1.29 (1.16–1.45), P = 4.66 × 10⁻⁶), the latter was itself inferred to be causal for increased WHRadjBMI (β (s.e.m.) = 0.0547 (0.0133), P = 3.74 × 10⁻⁵) (Supplementary Table 11).
Rare-variant contribution to infertility and hormone levels
We analyzed the 450k UKBB exome-sequencing dataset to characterize the association between rare coding variation (MAF 100 cases (F-ALL (3,746 cases, 260,413 controls), F-EXCL (3,012 cases, 261,147 controls) and M-ALL (650 cases, 222,393 controls)), and quantitative traits with >10,000 participants (FSH-F (n = 20,800), LH-F (n = 16,391), estradiol-F (n = 54,609) and testosterone (nfemale = 197,038, nmale = 197,340)) (Fig. 1). Gene-burden analyses implicate the PLEKHG4 gene, which is highly expressed in the testis and ovary, for F-EXCL (burden test OR (95% CI) 1.04 (1.02–1.06) when aggregated across all variant annotations with MAF P = 2.47 × 10⁻⁷) (Supplementary Table 14). This association did not replicate in the deCODE or Genes & Health (G&H) datasets (P > 0.05; Supplementary Tables 14, 20 and 21).
Novel genes implicated by gene-burden analyses
Gene-based analyses identify 18 genes associated with testosterone-F and 20 genes with testosterone-M (Cauchy combination P −6), of which ten have not previously been implicated through GWASs (Supplementary Note). Across 43 gene–trait pairs with Cauchy P −6 in UKBB, 13 (30.2%) replicate at nominal significance (P P −4) in either the deCODE or G&H datasets with consistent directions of effect (Supplementary Tables 14, 20 and 21).
We replicated the testosterone-F lowering associations of rare damaging variation in the hydroxysteroid dehydrogenase enzymes AKR1D1 (UKBB P = 1.76 × 10⁻⁸, deCODE P = 1.08 × 10⁻⁷, G&H P = 0.862) and AKR1C3 (UKBB P = 2.21 × 10⁻⁹, deCODE P = 1.12 × 10⁻⁶, G&H P = 8.75 × 10⁻⁸) in external cohorts (P −4, Bonferroni adjustment for 43 independent gene–trait pairs) (Supplementary Tables 14, 20 and 21). We report the first known association of HSD11B1 with testosterone-F (burden test P = 1.93 × 10⁻⁶ when aggregated across missense variants with MAF P = 0.028); pathogenic variants in this gene are reported to cause hyperandrogenism due to cortisone reductase deficiency49 (Supplementary Fig. 11). We also report the association of testosterone-M with HSD17B2 (burden test P = 1.33 × 10⁻¹¹ when aggregated across predicted loss-of-function (pLoF) variants with MAF 50 (Supplementary Fig. 11 and Supplementary Table 14). The association of rare damaging variation in HSD17B2 with lower testosterone nominally replicated in deCODE (P = 2.22 × 10⁻³) and G&H (P = 0.0481).
Infertility risk linked to rare hormone-associated variants
Two genes associated with testosterone in female UKBB participants were also associated with infertility risk (P −3, Bonferroni adjustment for 50 unique genes): TRIM4 (F-ALL, burden test OR 1.03 (1.01–1.05), P = 4.05 × 10⁻⁴ across all variants with MAF CYP3A43 (F-EXCL, burden test OR 1.02 (1.01–1.03), P = 4.84 × 10⁻⁴ across all variants with MAF
Finally, we identified 29 unique genes carrying rare variants (MAF 15 and Supplementary Note). Nineteen of the 29 genes also contained nearby (±500 kb) common testosterone-associated variants from GWASs (MAF >1%), but at the majority (74%) of these loci, the effect of the rare variant was larger and remained upon conditioning on common variants (P −7 after conditioning; Fig. 6a, Supplementary Table 15 and Supplementary Note).
Fig. 6: Rare variants associated with testosterone and infertility in UKBB WES analyses.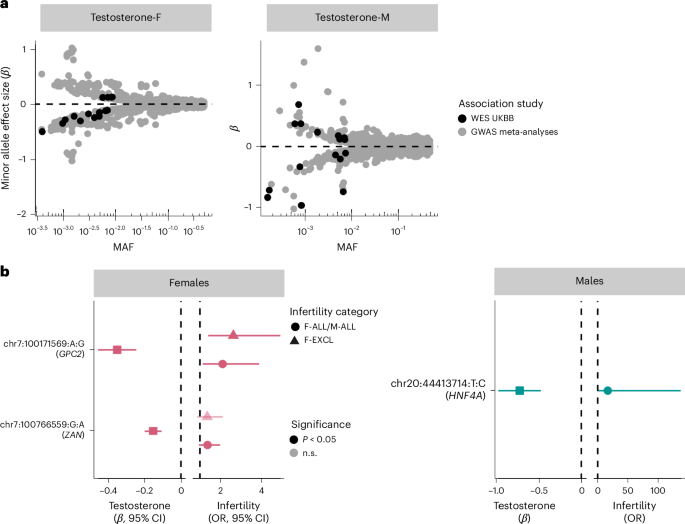
a, The mean effect size versus allele frequency of genetic variants associated with total testosterone estimated using regression analyses. Variants discovered at genome-wide significance (P −8) in GWAS meta-analyses (nfemale = 235,579, nmale = 235,096) and exome-wide significance (P −7) in the UKBB WES analyses (nfemale = 197,038, nmale = 197,340) are plotted. The effect sizes are aligned to the minor allele, plotted against MAF on the log x axis. b, The effects of testosterone-associated rare variants (chr:pos:minor allele:major allele) on infertility in females (left: n cases/controls for F-ALL = 3,746/260,413; n cases/controls for F-EXCL = 3,012/261,147) and males (right: n cases/controls for M-ALL = 650/222,393) estimated using regression analyses. The effect sizes are aligned to the minor allele. Per gene, the variant with the lowest P value of all variants that reach exome-wide significance in UKBB WES analyses for testosterone is displayed, for all variants with nominally significant effects on infertility. Effect sizes (β and 95% CIs) for the variant effect on testosterone are to the left of each plot and effect sizes (ORs and 95% CIs) for the variant effect on infertility are to the right of each plot.
The 11 novel testosterone associations included a female testosterone-lowering missense variant in STAG3 (chr7:100204708:C:T, β = −0.284, P = 2.31 × 10⁻⁸). STAG3 is also associated with primary ovarian insufficiency in women51, and lack of Stag3 results in female infertility through the absence of oocytes in knockout mouse models23. We did not find a significant association between the STAG3 variant and female infertility in UKBB (P > 0.05). However, we observed increased risk of idiopathic infertility in women carrying a novel testosterone-lowering variant in GPC2 (chr7:100171569:G:A, F-EXCL OR 2.63 (1.40–4.92), P = 1.25 × 10⁻³) (Fig. 6b). GPC2 is highly expressed in the testis, and Gpc2-knockout mouse models display reduced adrenal gland size23. The gene has not previously been reported to be associated with testosterone or infertility. Taken together, our results indicate a potential role for infertility driven by rare hormone-disrupting variants.