Phylogenetic analysis of DENV-1 3’ UTR
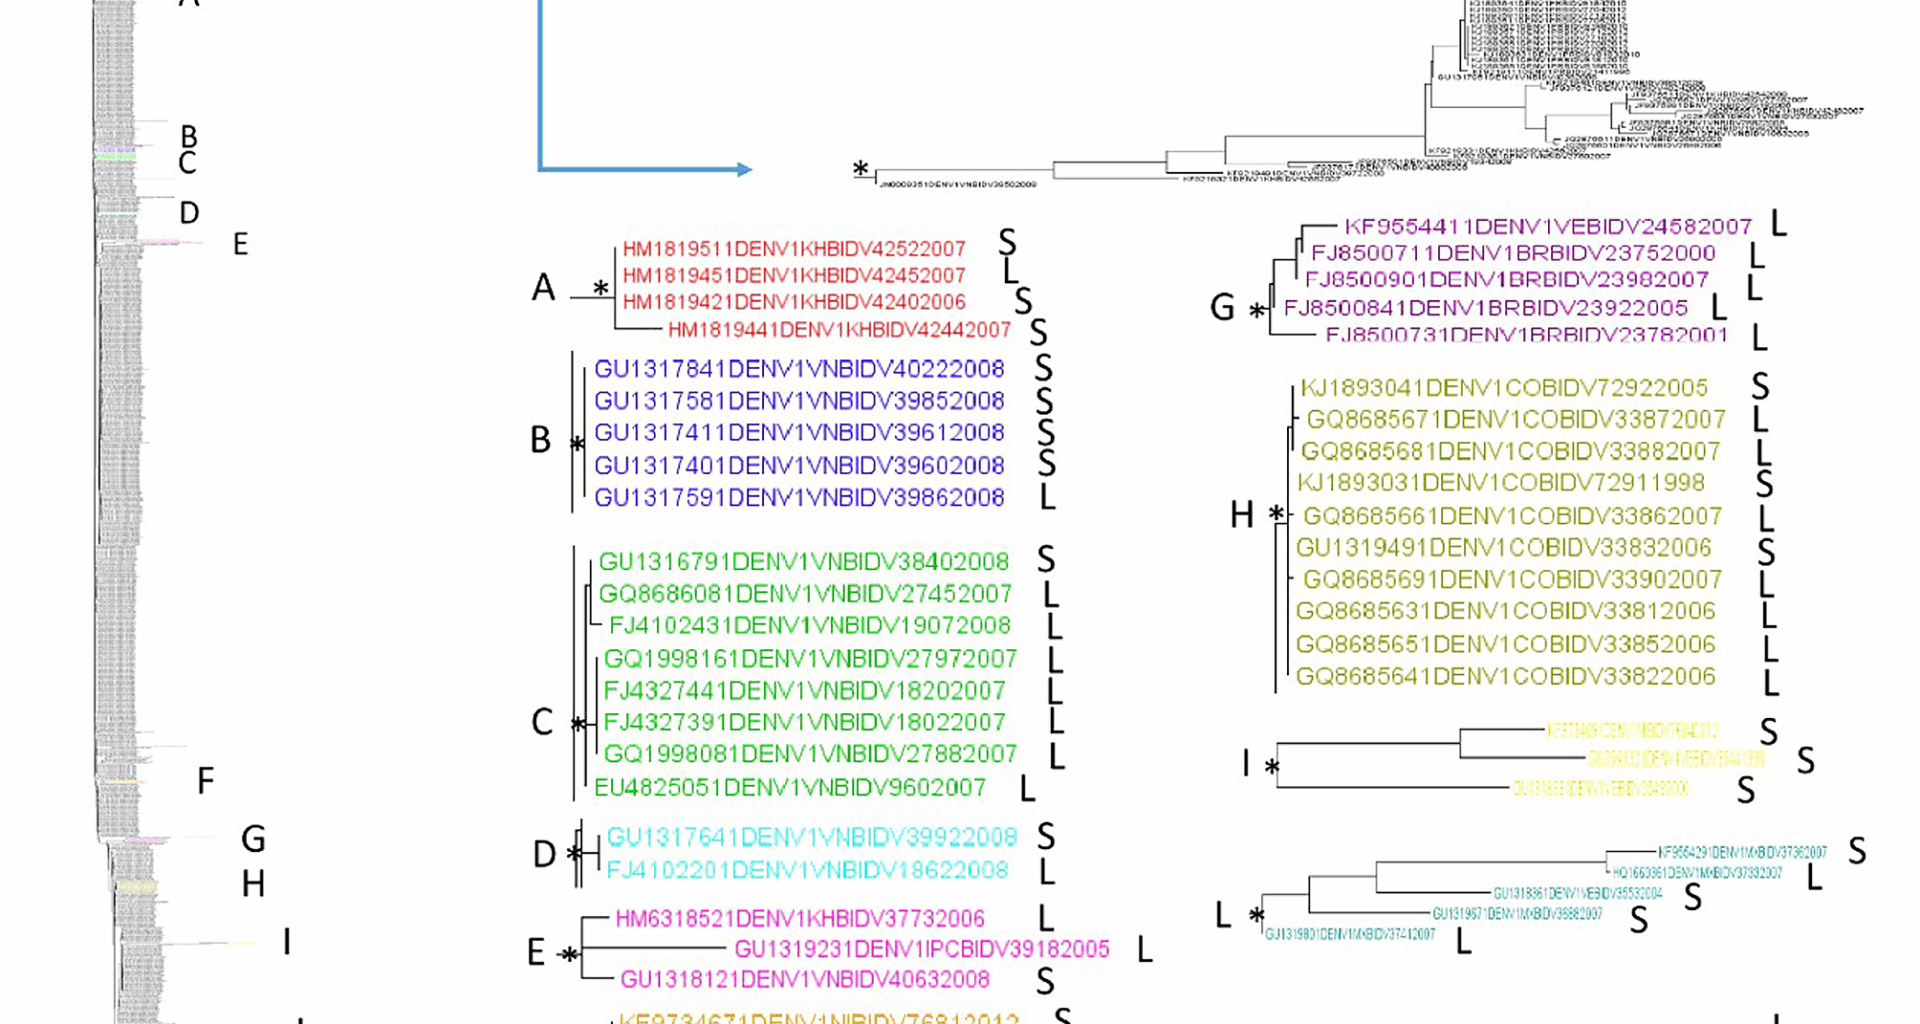
The maximum likelihood phylogenetic tree of the first dataset (n = 1,251, DENV-1 3′ UTR sequences) showed two statistically significant clades (Fig. 1). The first clade, located in the upper part of the tree, included several DENV-1 3′ UTR sequences from different locations and years of collection mixed.
Fig. 1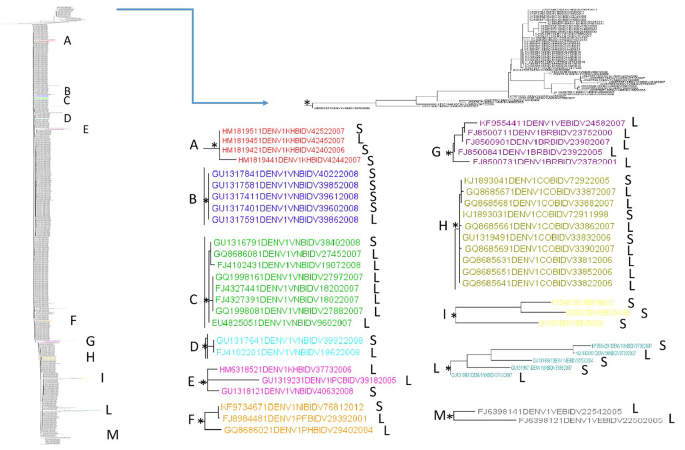
Maximum likelihood phylogenetic analysis of DENV-1 3′ UTR (first dataset). Branch lengths were estimated with the best fitting nucleotide substitution model. The scale bar at the bottom of the tree shows the number of nucleotide substitutions per site. An asterisk along a branch represents significant statistical support for the clade/cluster subtending that branch (SH-aLRT > 95%). The main clades and clusters are highlighted in different colours. The letters next to the taxon names indicate: ‘S’ indicates shorter sequences with a length ≤ the average length, and ‘L’ indicates longer sequences with a length > the average length
Within the lower clade, 11 supported clusters can be described (A-M reported in Fig. 1; Table 1). The 54.5% of them (6/11) were composed by sequences from the same location (A, B, C, D, H, and M), while 45.5% of the clusters (E, F, G, I, L) were from mixed locations. The 3′ UTRs collected in different years resulted intermixed. Regarding the composition of the clusters according to the average length of the 3′ UTR, most of them (6/11, 54.5% clusters C, E, F, G, H, and M) were composed of a higher prevalence of longer 3′ UTR sequences. Two supported large (defined as ≥ 8 sequences) internal clusters were highlighted in the DENV-1 3′ UTR dataset. The overall mean distance estimate for the first dataset (3′ UTR – DENV-1) was 5%. The mean genetic distances when sequences were grouped by location (within-group mean distances) ranged from 0 to 6% (Table 2 panel a). Thailand (0%), Vietnam (2%), Colombia (2%), Mexico (2%) had the lowest divergence, whereas Brazil (6%), Cambodia (5%), Puerto Rico (5%), followed by Nicaragua (4%), had the highest distance (Table 2 panel a).
Table 1 Statistically supported clusters detected in the lower clade of DENV-1 3’UTR phylogenetic tree and their compositionTable 2 Panel a Estimates of the average evolutionary divergence between sequence pairs within groups according to location, first dataset. Analyses were conducted using the Kimura 2-parameter modelTable 2 Panel b Estimates of evolutionary divergence over sequence pairs between groups, first dataset. Analyses were conducted using the Kimura 2-parameter model. The lowest divergences were highlighted in yellow. The highest distances were highlighted in dark Pink
The mean genetic distances performed between DENV-1 3′ UTR sequences grouped according to their location showed high heterogeneity (Table 2 panel b).
In particular, the lowest divergences (1.6 − 3.8%) were highlighted between (Table 2b in yellow): Thailand and Vietnam; Colombia and Mexico; Venezuela and Colombia; Mexico and Nicaragua; Venezuela and Mexico; Cambodia and Vietnam; and Thailand and Cambodia.
The highest distances (10.2–11.9%) were observed between Vietnam and Nicaragua, Cambodia and Mexico, Venezuela and Cambodia, Cambodia and Nicaragua, French Polynesia and Nicaragua, Cambodia and Puerto Rico, French Polynesia and Puerto Rico (Table 2, panel b). The table also shows the mean genetic distances between all the other countries examined. Mean within-group genetic distances, performed by grouping the sequences by year of collection (Table S2), showed the lowest variability in 1987, 1994, 1999, followed by 1992, 1993, 1995, 2003 and 2010. Meanwhile, the highest intra-group distances were in 1996 (17.5%) and 2000 (12.6%).
The lowest divergences between groups according to the year of collection are highlighted in yellow (Table S2 panel b).
The highest mean distances between groups, according to the years of collection, are highlighted in dark pink (Table S2 panel b).
The average length of the DENV-1 3′ UTR in the first dataset was 377 nt 28.1% of the sequences were classified as the S group because they were shorter than average length. Meanwhile, 71.9% were ≥ 377 nt in length.
When analyzing the average length for each year of collection, a reduction in the average length was noted in 1997 (308 nt). However, shorter DENV-1 3′ UTRs were also detected from 2008 to 2012 (157.5–288.7 nt). Notably, the shortest average length (157.5 nt) was observed in 2011.
Phylogenetic of DENV-2 3’ UTR
The maximum likelihood phylogenetic tree of the second dataset (n = 713, DENV-2 3′ UTR sequences) consisted of a supported cluster and a statistically supported main clade (Fig. S1). This cluster included five sequences, three from Nicaragua (years 2005 and 2008), one from Mexico (collection date 2005) and one from Venezuela (2001). The main clade showed general intermixing between sequences from different locations and years of collection. It also contained several statistically supported internal clusters. In most of these clusters, DENV-2 3′ UTR sequences resulted aggregated together according to their location. DENV-2 3′ UTR sequences classified as shorter (S group) appeared intermixed with those classified as longer (L group) in the tree. Some sequences were characterized by greater variability, as shown by their longer branches in the tree (Fig S1). Nine supported large (defined as ≥ 8 sequences) internal clusters were highlighted in the DENV-2 3’ UTR dataset.
The overall mean distance estimate for the second dataset was 3%. The mean genetic distances when sequences were grouped by location (within-group mean distances) ranged from 0 to 4% (Table 3 , panel a), with Papua New Guinea (0%), Massachusetts (Harvard), USA (0%), California (1%), Puerto Rico (1%), Thailand (1%), Nicaragua (1%) showing the lowest divergence, whereas Mexico, Cambodia (4%) followed by Venezuela (3%) showed the highest within group distance.
The mean genetic distances between DENV-2 3′ UTR sequences grouped by location (inter-group mean distances) showed a high degree of heterogeneity (Table 3, panel b).
Table 3 Panel a Estimates of average evolutionary divergence over sequence pairs within groups according to the locations, second dataset. Analyses were conducted using the Kimura 2-parameter modelTable 3 Panel b Estimates of evolutionary divergence over sequence pairs between groups according to the locations, second dataset. Analyses were conducted using the Kimura 2-parameter model. The lowest divergences were highlighted in yellow. The highest distances were highlighted in dark Pink
In particular, the lowest divergences were highlighted in yellow (Table 3 panel b) and those with values less than 1% were Massachusetts (Harvard) and Papa New Guinea; Massachusetts (Harvard) and California; Dominican Republic and Jamaica; Taiwan and Papa New Guinea; Taiwan and California; Massachusetts (Harvard) and Taiwan; Saint Kitts and Nevis and Belize.
Meanwhile, the highest distances, highlighted in dark pink (values between 8% and 14%, Table 3 panel b) were between: Honduras and California; Honduras and Taiwan; Guam and Mexico; Sri Lanka and Mexico; Honduras and Cambodia; Honduras and Nicaragua; Guam and California; Jamaica and Guam. Mean within-group genetic distances, as determined by grouping the sequences according to year of collection (Table S3, panel a), exhibited the least variability in 1944, 1983, 1989, and 1993. Conversely, the highest intragroup distances were found in 1988 and 1992.
The lowest divergences between groups are highlighted in yellow (Table S3, panel b).
The highest mean distances between groups are shown in dark pink (Table S3, panel b).
The average length of the DENV-2 3′ UTR (second dataset) was 412,4 nt. 13.7% of the sequences were classified as the S group, because they were shorter than the average length. Meanwhile, 86.3% had a length ≥ to the average length (L group). Analysis of the average length for each year of collection revealed a reduction in 1944, 1969, 1986, 1988, 2002, 2007, 2008, 2009 and 2011, with the lowest values recorded in 2008 (359 nt) and 2011 (213 nt).
Phylogenetic analysis of DENV-3 3’ UTR
The maximum likelihood phylogenetic tree of the third dataset (n = 659, DENV-3 3′ UTR sequences) showed a statistically supported cluster and a supported main clade (Fig. 2). This cluster included five sequences from Venezuela (collection years: 2000, 2001 and 2004) intermixed with one from Colombia (2007), all characterized by a longer length. In the main clade, there was a general intermixing between sequences from different locations and years of collection. Five statistically supported internal clusters (A-E, Fig. 2; Table 4), and one supported subclade can be described (Fig. 2).
Fig. 2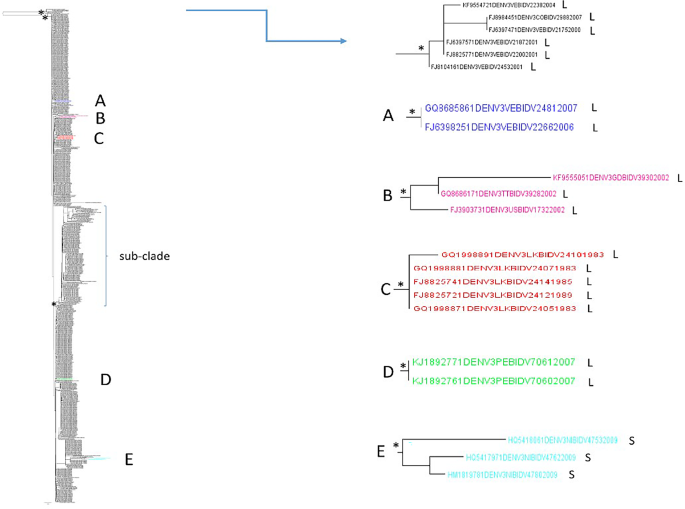
Maximum likelihood phylogenetic analysis of DENV-3 3′ UTR (third dataset). Branch lengths were estimated with the best fitting nucleotide substitution model. The scale bar at the bottom of the tree shows the number of nucleotide substitutions per site. An asterisk along a branch represents significant statistical support for the clade/cluster subtending that branch (SH-aLRT > 95%). The main clades and clusters are highlighted in different colours. The letters next to the taxon names indicate: ‘S’ indicates shorter sequences with a length ≤ the average length, and ‘L’ indicates longer sequences with a length > the average length
Table 4 Statistically supported clusters detected in the lower clade of DENV-3–3’UTR phylogenetic tree and their composition
The 80% of the internal clusters (4/5) were composed of sequences from the same location. The 3′ UTRs collected in different years resulted intermixed. Regarding the composition of the clusters in terms of average length, most of them (80%) were composed of a higher prevalence of longer sequences (Table 4 and Fig. 2). No large internal clusters (≥ 8 sequences) were detected in the DENV-3 3’ UTR dataset.
The subclade included several sequences from different locations and collection dates intermixed such as for example Thailand, Cambodia, India, Sri Lanka, Samoa, Cook Islands, and Vietnam. Within this subclade, the 3′ UTR of the S and L groups were intermixed (Fig. 2). The DENV-3 3′ UTR classified as shorter sequences (S group) generally appeared intermixed with those belonging to the L group also throughout the tree, even in some cases it is possible to highlight areas of specific aggregation of shorter 3′ UTR sequences (Fig. 2).
The overall mean distance estimate for the third data set (DENV-3–3′ UTR) was 2%. The mean genetic distances obtained when the DENV-3–3′ UTR sequences were grouped by location (within-group mean distances) ranged from 0 to 4.2% (Table 5, panel a). The group including sequences from Peru, Puerto Rico and Mexico, followed by Nicaragua, Cambodia, Vietnam, Brazil and Thailand (1%) showed the lowest intra-group divergence, while India (4.2%), followed by St Lucia (3%), had the highest intra-group distance (Table 5, panel a). The mean genetic distances performed between DENV-3 3′ UTR sequences grouped according to their location are shown in Table 5 panel b. The values were characterized by variability.
Table 5 Panel a Estimates of average evolutionary divergence over sequence pairs within groups according to the locations, third dataset. Analyses were conducted using the Kimura 2-parameter modelTable 5 Panel b Estimates of evolutionary divergence over sequence pairs between groups according to the locations, third dataset. Analyses were conducted using the Kimura 2-parameter model. The lowest divergences were highlighted in yellow. The highest distances were highlighted in dark Pink
In particular, the lowest divergences are highlighted in yellow and the highest in dark pink.
Mean intra-group genetic distances, performed by grouping the DENV-3 3′ UTR sequences according to the years of collection, showed the lowest intra-group variability in 1998, 2010, 2011, 2012, followed by 1985, 1989, 1999, 2009 (Table S4 panel a, values from 0.1 to 0.8%).
The highest within-group mean distances were found in 1983, 2001, 2006 and 2007 with values of distances between 2.6% and 2.9%.
Regarding the estimates of the evolutionary divergence performed between groups according to the years of collection the lowest divergences were identified and highlighted in yellow in Table S4 panel b, with values between 0 and 0.9%.
Meanwhile, the estimates of the highest evolutionary divergence over sequence pairs between groups, according to the years of collection, are highlighted in dark pink (Table S4).
The average length of the DENV-3 3′ UTR (third dataset) was 383.8 nt. The 24.4% of the sequences were classified as S group. Meanwhile, the 75.6% had a length ≥ to the average length and resulted in the L group. The analysis of the average length over time showed a decrease in the average length of the third dataset in 1983, 1984, 2006, 2007, 2009, 2011 and 2012, with the lowest average being 279 nt in 1984 and the highest being 373 nt in 2007.
Phylogenetic analysis of DENV-4 3’ UTR
The maximum likelihood phylogenetic tree of the fourth dataset (n = 100, DENV-4 3′ UTR sequences) showed a statistically supported cluster and a major supported clade (Fig. 3). The cluster included three sequences from Cambodia, all of them characterized by shorter length (S group), two collected in 2008 and one in 2007. The main clade included three outermost sequences, one from Pakistan (collection date: 2009), one from India (collection date: 1961), one from the Philippines collected in 1956 and a subclade with three statistically supported clusters (A, B, C). Cluster A consisted of nine sequences from Venezuela, all of which were collected in 2007 and showed a longer length (all of them belonging to the L group). Cluster B included only two sequences from the USA: Puerto Rico (collection date: 1998) belonging to the L group. Cluster C included sixteen sequences from Brazil collected in 2012, all of them belonging to the L group. Two supported large (≥ 8 sequences) internal clusters were highlighted in the DENV-4 3’ UTR dataset.
Fig. 3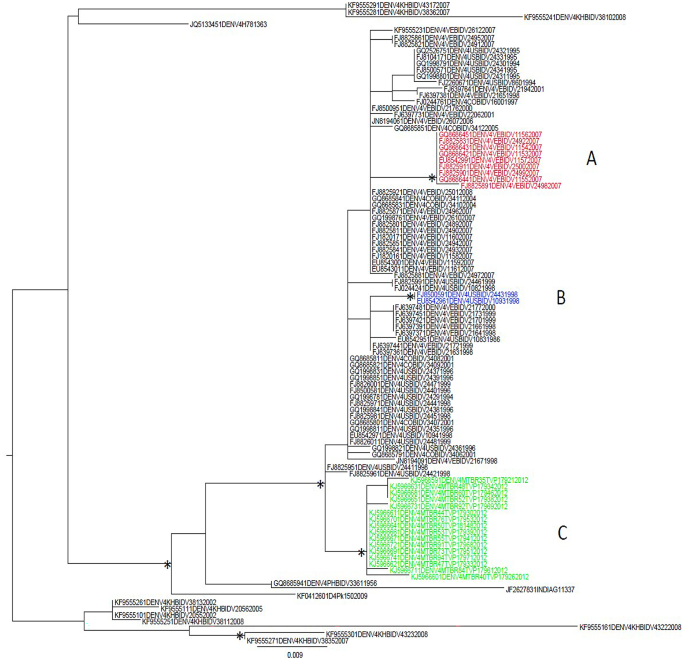
Maximum likelihood phylogenetic tree of DENV- 4 3′ UTR sequences (fourth dataset). Branch lengths were estimated with the best fitting nucleotide substitution model. The scale bar at the bottom of the tree shows the number of nucleotide substitutions per site. An asterisk along a branch represents significant statistical support for the clade/cluster subtending that branch (SH-aLRT > 95%). The main clades and clusters are highlighted in different colours. The letters next to the taxon names indicate: ‘S’ indicates shorter sequences with a length ≤ the average length, and ‘L’ indicates longer sequences with a length > the average length
The overall mean distance estimate for the fourth data set was 2%. The mean genetic within-group distances (performed by grouping the sequences by location) ranged from 0 to 4% (Table 6, panel a). The DENV-4 3′ UTR sequences from Colombia showed the lowest within-group distance (0.5%), followed by Venezuela (0.7%), Puerto Rico (0.7%) and Brazil (0.8%). The group including the sequences from Cambodia had the highest distance (4%). The mean genetic distances performed between different location groups of DENV-4 3′ UTR sequences (Table 6, panel b) showed that the lowest values (highlighted in yellow) were between: Puerto Rico and Colombia; Colombia and Venezuela; Puerto Rico and Venezuela; Brazil and Venezuela; Brazil and Colombia (1.1%); Brazil and Puerto Rico (1.3%). The highest evolutionary divergences (highlighted in dark pink, Table 6, panel b) were between India and Cambodia; Venezuela and Cambodia; Puerto Rico and Cambodia; Colombia and Cambodia; Philippines and Cambodia; Pakistan and Cambodia; India and Pakistan; Brazil and Cambodia.
Table 6 Panel a Estimates of average evolutionary divergence over sequence pairs within groups according to location, fourth dataset. Analyses were conducted using the Kimura 2-parameter modelTable 6 Panel b Estimates of evolutionary divergence over sequence pairs between groups according to location, fourth dataset. Analyses were conducted using the Kimura 2-parameter model. The lowest divergences were highlighted in yellow. The highest distances were highlighted in dark Pink
Mean within-group genetic distances performed on the DENV-4 3′ UTR for the years of collection showed that the lowest within-group variability occurred in 1995, 1996, 1999, 2000, 2001, 2002, 2004 and 2012 (Table S5, panel a). The highest divergence (5–6%) occurred in 2005 and 2008 (Table S5, panel a).
Estimates with the lowest evolutionary divergence between collection years were identified and highlighted in yellow (Table S5, panel b), and those with the highest values were highlighted in dark pink (Table S5, panel b).
The average length of the DENV- 4, 3′ UTR (fourth dataset) was 351 nt.
The 21% of the sequences were classified in the S-group (length shorter than the average length). Meanwhile 79% had a length ≥ to the average length and resulted in the L group. When analyzing the average length over time according to the years of collection, a decrease in the average length was highlighted in 1986, 2000, 2002, 2004, 2006, 2007 and 2008 with length values ranging from 126 to 344nt.