Single-cell longitudinal profiling reveals microenvironmental shifts
We profiled neuroblastoma samples from 22 patients with high-risk neuroblastoma obtained through an initial diagnostic biopsy followed by a surgical resection after three to four cycles of induction chemotherapy using snRNA-seq (22 pairs), snATAC-seq (13 pairs and seven unpaired) and WGS (22 pairs) (Fig. 1a). Patients were aged 6 months to 13 years at the time of diagnosis, 14 of whom were female and eight of whom were male. MYCN amplification and ALK and TP53 mutations were observed at diagnosis in 11, four and one patient(s), respectively (Fig. 1a and Supplementary Tables 1 and 2). Patient response to induction chemotherapy was evaluated by 123I-metaiodobenzylguanidine imaging plus anatomic imaging using computed tomography or magnetic resonance imaging, bone marrow aspirate and biopsy24 (Supplementary Tables 1 and 2). After quality control, we obtained 372,619 and 144,366 high-quality cells from snRNA-seq and snATAC-seq, respectively (Extended Data Fig. 1a,b).
Fig. 1: Longitudinal single-cell RNA and ATAC atlas of high-risk neuroblastoma.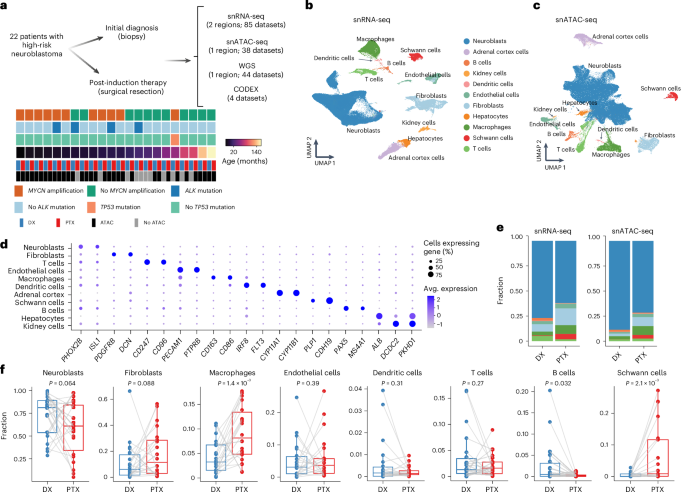
a, Overview of the multiomics studies on patient-matched longitudinal neuroblastoma specimens. b,c, UMAPs of the snRNA-seq data (b; n = 372,619 cells) and snATAC-seq data (c; n = 144,366 cells) annotated by major cell type category. d, Dotplot showing the mean expression of marker genes and the percentage of cells expressing them for each annotated cell type. e, Stacked barplots of cell type proportions across the snRNA-seq (left) and snATAC-seq (right) datasets. The cell types are colored as in b. f, Shifts in cell type proportions for each patient between initial diagnosis and post-therapy time points in the snRNA-seq data. Central lines indicate median values, the box edges mark the 25th and 75th percentiles and the whiskers extend 1.5 times the interquartile range. Samples from the same patient between time points are connected by a gray line (n = 22 pairs). Statistical significance was assessed using a one-sided Wilcoxon signed-rank test. Avg., average; DX, diagnosis; PTX, post-induction chemotherapy.
We identified eight major cell populations, including neuroblasts, fibroblasts, Schwann cells, endothelial cells, macrophages, dendritic cells, T cells and B cells (Fig. 1b–d, Extended Data Fig. 1c and Supplementary Table 3), consistent with the results from recent single-cell studies of patients with neuroblastoma7,8. We also detected three tissue-specific cell populations (that is, hepatocytes, adrenal cortex cells and kidney cells) in a few patients (Extended Data Fig. 1d)—probably from adjacent normal tissue—and excluded them from subsequent analysis. The cell type compositions were largely concordant between snRNA-seq and snATAC-seq data (Fig. 1e and Extended Data Fig. 1e). Interestingly, we found several notable changes in the tumor microenvironment due to chemotherapy. The proportion of macrophages was significantly and consistently expanded after therapy in both snRNA-seq and snATAC-seq data. Schwann cells—and fibroblasts to a lesser extent—also expanded after therapy, with large shifts noted in a subset of patients (Fig. 1f and Extended Data Fig. 1f). Taken together, these results demonstrate that neuroblastoma therapy results in large-scale alteration in the composition of the tumor-immune microenvironment.
Chemotherapy alters neoplastic cell state composition
We sought to dissect the intratumoral heterogeneity by first characterizing neoplastic cell states. We identified neoplastic cells by combining the copy number variation (CNV) profiles derived from WGS data with inferred CNVs from the snRNA-seq data (Extended Data Fig. 2a–e and Supplementary Methods). We restricted our neoplastic cell call to cells derived from the neural crest lineage including neuroblasts, fibroblasts and Schwann cells, as these populations have been suggested to include neoplastic cells16,21,25. Of note, the fibroblast population is heterogeneous and may include neural crest-derived endoneurial fibroblasts, which could harbor the same mutations as neoplastic neuroblasts due to their shared precursors during differentiation26,27,28. Overall, we identified 205,253 neoplastic cells and the proportion of these cells was correlated with a pathologist’s manual estimates based on histology (r = 0.6; P = 8.5 × 10⁻⁶; Extended Data Fig. 2e). We further validated our neoplastic cell call by confirming the presence of known neuroblastoma CNVs, such as 17q, 7q, 17 and 7 gains and 1p and 11q losses29 through analysis with inferCNV30 (Extended Data Fig. 2f).
Most putative neoplastic cells had a neuroblastic phenotype (Extended Data Fig. 3a). By reintegrating and clustering the neoplastic cells from all samples, we found six distinct neoplastic cell states (Fig. 2a and Supplementary Table 3). We annotated these populations by their ADRN and MES signature scores, differential gene expression and enriched transcriptional pathways. We identified one MES-high cluster, four ADRN-high clusters and one intermediate cluster with moderate ADRN and MES signatures (Fig. 2b,c). Furthermore, we examined the enrichment of Kyoto Encyclopedia of Genes and Genomes pathways and Gene Ontology biological process terms of the differentially upregulated genes. ADRN-like cells exhibited four states, three of which were enriched in neurodevelopmental pathways (ADRN-calcium (calcium/synaptic signaling), ADRN-dopaminergic (dopamine metabolism) and ADRN-baseline (few differentially expressed genes)) and one of which was enriched for proliferating cells (ADRN-proliferating) (Fig. 2d, Extended Data Fig. 3b and Supplementary Table 4). The intermediate state highly expressed many ribosomal genes and was uniquely enriched in the oxidative phosphorylation pathway (Fig. 2a). It was therefore annotated as Interm-OXPHOS. The MES state differentially expressed extracellular matrix-related pathways (Fig. 2b–d and Extended Data Fig. 3b,c).
Fig. 2: Therapy-induced neoplastic cell state shifts.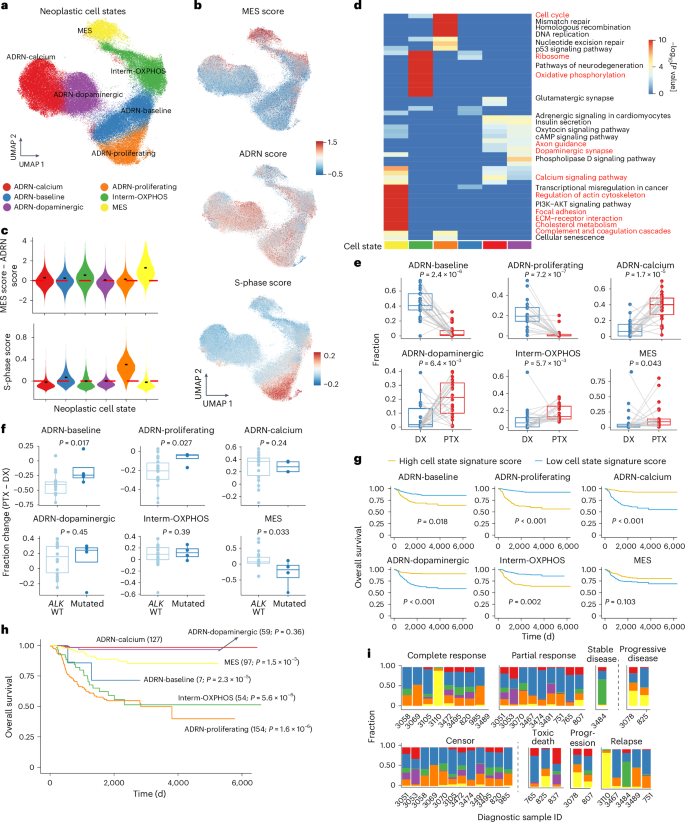
a, UMAP of inferred neoplastic cells from snRNA-seq data after integration and annotation of cell states. b, UMAPs showing the MES, ADRN and cell cycle S-phase signature scores of neoplastic cells. c, Violin plots of MES − ADRN signature score difference (top) and cell cycle S-phase score (bottom) across different cell states. The short black bars represent the median value in each group and the red dashed lines indicate y = 0. d, Heatmap of the top 15 enriched Kyoto Encyclopedia of Genes and Genomes pathways for each neoplastic cell state. The enrichment was conducted based on Fisher’s exact test using enrichR without multiple comparison adjustment. We highlighted in red some labels that are closely related to the naming of each cell state. e, Shifts in cell state proportion between diagnosis and post-therapy samples. A one-sided Wilcoxon signed-rank test was used to calculate statistical significance. Samples from the same patient between time points are connected by a gray line (n = 22 pairs). f, Differences in cell state frequencies between paired post-therapy and diagnostic samples stratified by ALK mutation status. A one-sided Wilcoxon rank-sum test was used to calculate significance (n = 18 ALK wild type (WT) and 4 ALK mutated). In e and f, central lines indicate median values, the box edges mark the 25th and 75th percentiles and the whiskers extend 1.5 times the interquartile range. g, Kaplan–Meier curves of overall survival based on neoplastic cell state using the Sequencing Quality Control project dataset. Patients were stratified into high and low groups based on the median value of the cell state signature score. P values were calculated based on the Cox proportional hazards model and adjusted by age, sex and MYCN amplification status. h, Kaplan–Meier curves of overall survival, with patients grouped into different neoplastic cell states based on maximum cell state signature scores. The numbers of samples per group are indicated. P values were calculated based on the Cox proportional hazards model and adjusted by age, sex and MYCN amplification status. The ADRN-calcium state was chosen as the baseline state. i, Proportions of neoplastic cell states in the initial diagnostic samples. Patients are grouped according to their responses to induction chemotherapy (top) and clinical events (bottom). A one-sided t-test was performed to compare the MES state proportion between two patient groups, as indicated by the vertical dashed line (P = 0.02 (top) and 0.05 (bottom)). cAMP, cyclic AMP; ECM, extracellular matrix.
Next, we sought to determine how these newly defined populations shifted during therapy and found significant changes (Fig. 2e and Extended Data Fig. 3d). As expected, the abundance of ADRN-baseline and ADRN-proliferating populations decreased after therapy. Conversely, the ADRN-calcium, ADRN-dopaminergic and Interm-OXPHOS populations exhibited significant increases after therapy (Fig. 2e). MES cells made up 2e and Extended Data Fig. 3e). Patients with mutated ALK demonstrated a significantly smaller decrease in the ADRN-baseline and ADRN-proliferating populations and a notable decrease in the MES state after therapy (Fig. 2f), in contrast with the overall trend (Fig. 2e). MYCN amplification did not affect neoplastic state shifts (Extended Data Fig. 3f).
To better understand these cell states, we projected all inferred neoplastic cells onto a single-cell transcriptomic atlas of normal adrenal medullary development7. Consistent with previous studies7,8, neoplastic cells mostly recapitulated neuroblasts and late neuroblasts, indicating a developmentally arrested state. Interestingly, we found a significant increase in additional developmentally arrested phenotypes in post-therapy samples, including late Schwann cell precursors, a bridge cell population, chromaffin cells, late chromaffin cells and cycling neuroblasts (Extended Data Fig. 4a–c). Moreover, the cell states we identified were associated with different developmental states (Extended Data Fig. 4c–f). The MES state was enriched in non-neuroblastic phenotypes. In contrast, the ADRN-calcium, ADRN-baseline and ADRN-proliferating states were almost entirely enriched in the neuroblast lineage, resembling late neuroblasts, neuroblasts and cycling neuroblasts, respectively. The ADRN-dopaminergic state projected mostly onto neuroblasts and late neuroblasts, but partially resembled determined chromaffin cells, supporting its enrichment of dopaminergic pathways.
Finally, we assessed the clinical implication of these cell states. We examined the gene signature of each state in 498 diagnostic neuroblastoma bulk transcriptomes (the Sequencing Quality Control project cohort)31. Interestingly, the samples with a higher gene signature for the ADRN-proliferating, ADRN-baseline or Interm-OXPHOS state showed lower overall survival and event-free survival independent of age, sex and MYCN amplification status (Fig. 2g and Extended Data Fig. 5a). In contrast, higher scores of the two states resembling more differentiated stages of the neuroblast and chromaffin lineage (ADRN-calcium and ADRN-dopaminergic) were associated with better prognoses (Fig. 2g and Extended Data Fig. 5b). The MES signature was not significantly associated with prognosis in the diagnostic samples. Orthogonally, we utilized these signatures to stratify patients based on their highest neoplastic cell state signature score. Consistently, patients assigned to the ADRN-proliferating and Interm-OXPHOS groups had the lowest survival, whereas those assigned to the ADRN-calcium and ADRN-dopaminergic groups had the highest survival. Although the MES state was only associated with an intermediate prognosis, a high percentage of the MES state in diagnostic samples correlated with a worse response to chemotherapy and adverse clinical events (toxic death, progression or relapse) (Fig. 2h,i and Extended Data Fig. 5b). We validated these two orthogonal analyses in an additional cohort of 419 bulk transcriptomes32, largely replicating these findings (Extended Data Fig. 5c–f). Additionally, deconvolution of the bulk expression data revealed that ADRN-proliferating and ADRN-baseline states were more common in patients with MYCN amplification and advanced-stage disease. The MES state is enriched in patients with MYCN amplification. Conversely, prognostically favorable states (ADRN-calcium and ADRN-dopaminergic) are less prevalent in patients with MYCN amplification and advanced-stage disease (Extended Data Fig. 5g–j). These results suggest that the presence of proliferative, metabolically active and developmentally arrested neoplastic cells at diagnosis portends a less favorable clinical outcome, whereas a more differentiated state with neuronal expression patterns predicts a more favorable outcome. Taken together, neuroblastoma neoplastic cells exhibit multiple distinct transcriptomic states that recapitulate developmental processes and can predict clinical outcomes.
Cooperative epigenetic regulation governs neoplastic cell states
After defining and characterizing neoplastic cell states, we sought to determine how these cell states are transcriptionally regulated. We identified 11 distinct epigenetic clusters in putative neoplastic cells in the snATAC-seq data (Extended Data Fig. 6a,b). The cells were then computationally mapped onto the transcriptional states to generate high-confidence epigenetic profiles for each neoplastic state. We confirmed that canonical MES and ADRN marker genes, including YAP1 and PHOX2B, were more accessible in their respective states and that the MYCN gene was more accessible in the clinically unfavorable states (Extended Data Fig. 6c–g). Consistent with the snRNA-seq data, the ADRN-calcium and ADRN-dopaminergic states expanded after therapy, whereas the ADRN-proliferating and ADRN-baseline states retracted (Fig. 3a and Extended Data Fig. 7a).
Fig. 3: Transcriptional regulation of neoplastic cell states.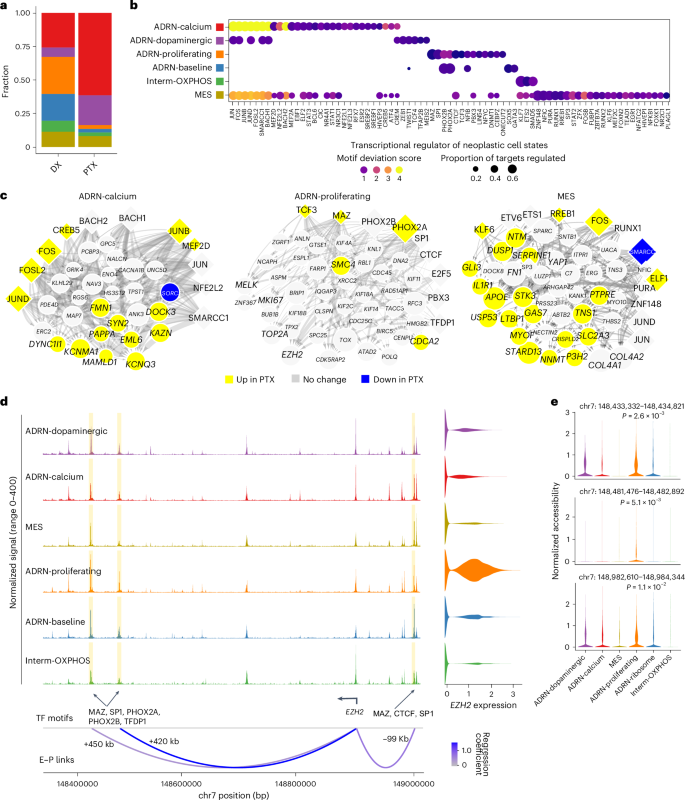
a, Stacked barplots of neoplastic cell state proportions in the snATAC-seq data at the diagnosis and post-therapy time points. The colors are as in b. b, Dotplot showing the top 15 transcription factors of the transcriptional regulatory network for each neoplastic cell state. The size of each dot represents the fraction of gene targets in the transcriptional regulatory network regulated by each transcription factor. The color represents the chromVAR deviation z score. c, Transcriptional regulatory networks for the ADRN-calcium, ADRN-proliferating and MES cell states. Diamonds represent transcription factors and circles represent target genes. The size of a transcription factor node is proportional to the average difference in the motif chromatin accessibility z score between a given cell state and the rest of the cell states. The size of a target gene node is proportional to the average fold-change of gene expression between a given cell state and the rest of the cell states. The node color indicates the direction of gene expression change between diagnosis and post-therapy samples in each cell state. The edge weight is proportional to the linear regression coefficient for the predicted enhancer–promoter interaction and the fraction of cells that are accessible at the enhancer peak. d, Coverage plot showing normalized chromatin accessibility for neoplastic cell states at the EZH2 locus. The E–P link track represents the predicted enhancer–promoter links colored by the regression coefficient. The transcription factor (TF) motifs present at the enhancer peaks are indicated. Differentially accessible peaks for the ADRN-proliferating state are highlighted. e, Normalized chromatin accessibility of putative EZH2 enhancers across neoplastic cell states. P values were calculated using edgeR on pseudo-bulk data without multiple comparison adjustment (Supplementary Methods). kb, kilobases.
We examined the differentially accessible transcription factor motifs for each state using chromVAR33 (Extended Data Fig. 7b and Methods). We found that activator protein-1 (AP-1) motifs (for example, FOS, BACH2 and JUN) and CREB motifs (for example, CREM and CREB5) were differentially accessible in the ADRN-calcium, ADRN-dopaminergic and MES states. Canonical adrenergic transcription factor motifs15,16 (PHOX2A, PHOX2B and GATA3) were differentially accessible specifically in the ADRN-proliferating and ADRN-baseline states. Likewise, known MES state transcription factor motifs15,16 (ETS2, ETV6, ELF1, KLF7 and RUNX1) were most accessible in the MES state and modestly accessible in the Interm-OXPHOS state. Transcription factor motifs associated with epithelial-to-mesenchymal transition34 (TWIST1, ZEB1 and SNAI1) were enriched in the ADRN-dopaminergic state.
Next, we constructed a transcriptional regulatory network for each state by integrating snRNA-seq and snATAC-seq data (Supplementary Tables 5–8). We confirmed the significance of AP-1 transcription factors in the MES, ADRN-calcium and ADRN-dopaminergic states (Fig. 3b), as previously reported15,16,17. Interestingly, both AP-1 transcription factor-encoding genes and many of their targets were upregulated after therapy, suggesting a strengthened MES phenotype in response to therapy (Fig. 3c and Extended Data Fig. 7c). Our analysis also nominated new transcription factors involved in regulating each state. For example, ZNF148 and MAZ were predicted regulators of the MES and ADRN-proliferating states, respectively (Fig. 3b,c). Strikingly, despite a significant retraction in the ADRN-proliferating population after therapy, the expression of many state-specific genes (for example, EZH2, TOP2A and MKI67) was unchanged or increased (Fig. 3c, Extended Data Fig. 7d and Supplementary Table 6). These results indicate that this clinically unfavorable population retains its phenotype during therapy, raising the possibility that these proliferating adrenergic cells are persistent and implicated in treatment resistance.
Beyond global transcription factors, we also identified cis-regulatory enhancer–promoter interactions associated with key state-specific genes (Fig. 3d,e and Extended Data Figs. 6g and 7e). Focusing on the ADRN-proliferating state, we identified three EZH2 enhancers correlated with the EZH2 expression (Fig. 3d). EZH2, the catalytic subunit of Polycomb repressive complex 2 (PRC2), is a promising target in high-risk neuroblastoma19,35,36. It was highly expressed in this state, with the three enhancer peaks showing elevated accessibility and MAZ, CTCF and PHOX2A motifs, indicating state-specific EZH2 activation. We also identified ADRN-proliferating-specific SMC4 enhancers with MAZ and CTCF motifs (Extended Data Fig. 6g). SMC4 is a core condensin subunit involved in genome organization and tumorigenesis37,38. These findings suggest that regulation of chromatin structure may help to maintain the proliferative state. Lastly, we found that NECTIN2, recently implicated in T cell dysfunction in high-risk neuroblastoma11, was upregulated in the MES state and associated with multiple enhancers (Extended Data Fig. 7e). Overall, this analysis uncovered extensive transcription factor cooperativity driving state-specific gene expression and enhancer-driven mechanisms supporting high-risk neoplastic subsets.
Pro-tumorigenic macrophages are enriched after therapy
Macrophages were the largest immune component in the neuroblastoma microenvironment and expanded significantly after therapy (Fig. 1b,f). TAMs have been shown to contribute to tumor proliferation and therapy resistance in high-risk neuroblastoma39,40. Therefore, we sought to delineate the effect of therapy on TAM subtypes. After reintegration and clustering, we identified eight macrophage subsets and annotated them by the top differentially expressed genes (Fig. 4a, Extended Data Fig. 8a,b and Supplementary Table 9). Namely, we identified a proliferating state (MKI67 and TOP2A), a pro-inflammatory state (IL18), two pro-angiogenic states (CCL4 and VCAN), an immunosuppressive state (C1QC and SPP1), a tissue-resident state with the highest expression of a phagocytosis gene (F13A1), a lipid-associated state (HS3ST2) and an undefined state expressing THY1 (Fig. 4b,c, Extended Data Fig. 8c and Supplementary Table 10). Notably, although they were previously described as distinct phenotype markers across multiple solid tumors41, C1QC and SPP1 had the highest co-expression in one population. In summary, this analysis confirmed that neuroblastoma TAMs can adopt similar phenotypes to those found in other solid tumors.
Fig. 4: TAMs in the neuroblastoma microenvironment.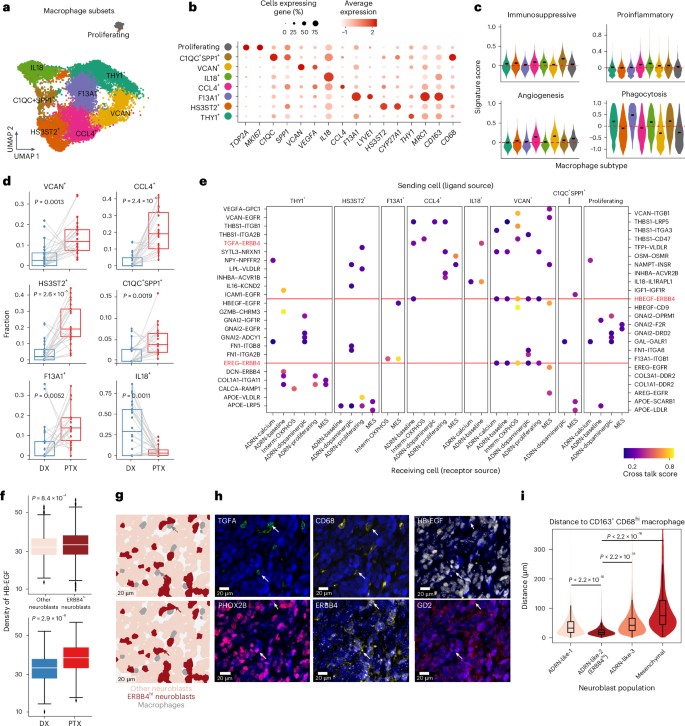
a, UMAP of macrophage subsets (14,866 cells) from snRNA-seq data after integration and annotation. The colors are as in b. b, Dotplot of the average expression of marker genes and the percentage of cells expressing them for each annotated macrophage subset. c, Violin plots of signature scores for immunosuppressive, pro-inflammatory, angiogenesis and phagocytosis macrophages in our macrophage subsets. The short black bars represent the median value in each group and the red dashed lines indicate y = 0. d, Shifts in macrophage subset proportions between diagnosis and post-therapy samples. A one-sided Wilcoxon signed-rank test was used to calculate significance. Samples from the same patient between time points are connected by a gray line (n = 22 pairs). e, Dotplot showing predicted ligand–receptor interactions between neoplastic cells and macrophage subsets. The ligands are from macrophage subsets (top labels) and are listed first in each pair. The receptors are from neoplastic populations (bottom labels) and are listed second in each pair. Both y axes have been used for labeling due to space constraints. Important interactions involving ERBB4 are highlighted in red; the red dashed line indicates recurrent interactions. f, Comparison of the density of HB-EGF protein quantified by CODEX between neighbors of ADRN-like-2 (ERBB4hi) neuroblasts and neighbors of other neuroblasts (top), as well as between diagnosis and post-therapy samples (bottom). The density was defined as the mean expression of HB-EGF on cells within a 40-µm window, excluding the marker within the center cell. Significance was assessed using a two-sided Wilcoxon rank-sum test. The numbers of cells are: n = 655,573 (other neuroblasts), 17,532 (ERBB4hi neuroblasts), 221,677 (DX) and 451,428 (PTX). g,h, Representative cell type mask (g) and CODEX images (h). Arrows indicate macrophages (top) and neuroblasts (bottom). i, Distance from each neuroblast cell to the nearest CD163+CDCD68hi macrophage across samples, stratified by neuroblast population. Numbers of cells in each group (from left to right): n = 396,277, 17,532, 241,995 and 17,301. Significance was assessed using a two-sided Wilcoxon rank-sum test. Outliers were truncated for visualization purposes. In d, f and i, central lines indicate median values, the box edges mark the 25th and 75th percentiles and the whiskers extend 1.5 times the interquartile range.
Importantly, we observed significant shifts in macrophage states between the paired diagnostic and post-therapy samples. The IL18+ population was the only state that was reduced after therapy, whereas all other states except the proliferating and THY1+ state were expanded (Fig. 4d and Extended Data Fig. 8d,e). A predominance of IL18+ macrophages was linked to better treatment responses and fewer adverse clinical events (Extended Data Fig. 8f,g). Deconvolution of bulk gene expression data showed that F13A1+, CCL4+ and proliferating macrophages were more abundant in patients with MYCN amplification, whereas THY1+ and IL18+ macrophages were fewer (Extended Data Fig. 9a). Additionally, proliferating macrophages were enriched in patients with advanced-stage disease (Extended Data Fig. 9b). Collectively, diverse macrophage subsets coexist and correlate with genetic and clinical features. Longitudinally, pro-tumorigenic states with immunosuppressive, angiogenic or metabolic potential were expanded, whereas pro-inflammatory populations were concomitantly reduced.
Macrophages differentially interact with neoplastic cell states
Next, we explored how these macrophage subtypes interact with neoplastic cells by performing a cell–cell interaction analysis using CytoTalk42. We identified numerous bidirectional ligand–receptor interactions (Fig. 4e and Extended Data Fig. 9c). Many of these interactions involved proteins that facilitate cell adhesion, cell migration and angiogenesis, including the ligands VCAN (with the receptors ITGB1 and EGFR), THBS1 (with the receptors ITGB1, LRP5, ITGA3, CD47 and ITG2B), VEGFA (with the receptor GPC) and SEMA3A (with the receptor NRP1). We found that interactions between epidermal growth factor family (ErbB) receptors (ERBB4 and EGFR) and multiple ligands (HB-EGF, TGFA, EREG, AREG and ICAM1) constituted the most frequently enriched signaling pathway. Notably, these interactions were preferentially predicted between VCAN+ macrophages and all neoplastic populations (Fig. 4e and Extended Data Fig. 9d,e). The THY1+ macrophages were involved in interactions related to collagen and integrin signaling, whereas the HS3ST2+ macrophages expressed ligands related to lipid metabolism (for example, APOE, LRP5 and LPL), interacting with multiple neoplastic cell states (Fig. 4e and Extended Data Fig. 9c).
To validate the intercellular interactions predicted via snRNA-seq, we performed co-detection by indexing (CODEX) spatial proteomics using a 38-antibody panel on whole-slide formalin-fixed, paraffin-embedded (FFPE) samples from two diagnostic–post-therapy pairs included in the single-cell transcriptomic atlas (Supplementary Table 11 and Extended Data Fig. 10a). After single-cell segmentation and clustering, we resolved the major cell lineages, including neuroblasts, macrophages and T cells, and discerned multiple distinct neuroblasts and macrophage subsets (Extended Data Fig. 10b–f). We found three subsets of adrenergic neuroblasts: an ISL1-high population (ADRN-like-1), a PPP2R2C-high population (ADRN-like-2) and a population with minimal PHOX2B expression (ADRN-like-3). We also identified a mesenchymal neuroblastic population expressing vimentin (Extended Data Fig. 10d,e). Notably, the immunotherapy target GD2 was exclusively expressed on ADRN-like-2 neuroblasts. Finally, we found that all macrophages expressed CD163, but two populations were discriminated by the additional high expression of either CD206 or CD68 (Extended Data Fig. 10d), resembling F13A1+ and C1QC+SPP1+ macrophages in our transcriptomic data (Fig. 4b).
Focusing on the epidermal growth factor-related pathways, we first observed that the ERBB4 receptor was most highly expressed on ADRN-like-2 neuroblasts (Extended Data Fig. 10d). We then examined the ligand signal density on cells within a 40-µm radius surrounding each neuroblastic cell. The densities of the secreted ERBB4 ligands HB-EGF and TGFA were greater in the vicinity of ADRN-like-2 (ERBB4hi) cells compared with the other neuroblasts and both ligands were broadly enriched after therapy (Fig. 4f–h and Extended Data Fig. 10g). We also found that the ADRN-like-2 (ERBB4hi) population was proximal to both macrophage subsets and significantly closer to CD163+CD68hi macrophages than the other neuroblasts (Fig. 4i and Extended Data Fig. 10h). These results demonstrate the ability to spatially resolve neoplastic and immune cells and support macrophage-induced ErbB signaling as a potential pro-tumorigenic mechanism driving adrenergic neoplastic cells.
Murine model recapitulates tumor–macrophage interactions
To further investigate the predicted interactions between macrophages and neuroblasts in vivo, we utilized Xenium spatial transcriptomics to study tumors from the well-validated immunocompetent TH-MYCN mouse model43, genetically engineered to overexpress MYCN in the murine neural crest, resulting in spontaneous tumors. We profiled treatment-naive and cyclophosphamide-treated mice with a panel of 5,000 genes and captured all of the major cell types identified in our multiomic cohort, including cells resembling all neoplastic and macrophage phenotypes (Fig. 5a–g). We then applied a spatial ligand–receptor analysis (Supplementary Methods), which validated a broad range of the interactions predicted by snRNA-seq. This included the HB-EGF–ERBB4 interaction, which occurred predominantly between VCAN+ macrophages and Interm-OXPHOS neoplastic cells in the mouse model, consistent with the predicted interactions (Fig. 4e and Fig. 5h). We also observed that Erbb4+ neuroblasts are spatially closer to Hbegf+ macrophages than other neuroblasts in the cyclophosphamide-treated, but not treatment-naive, mice (Fig. 5i,j). Overall, these results demonstrate that the key microenvironmental phenotypes and cellular interactions in human neuroblastoma are also present in a well-validated mouse model, providing a basis for the preclinical testing of therapeutic strategies that module the tumor-immune microenvironment.
Fig. 5: Spatial transcriptomic analysis of murine neuroblastoma.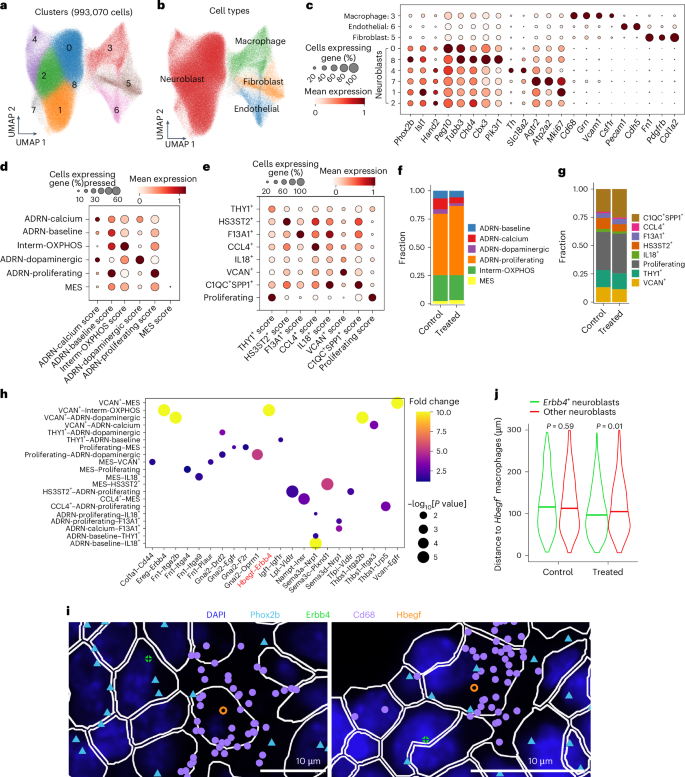
a,b, UMAP projection of Xenium transcriptomic data (993,070 cells) annotated by cell cluster (a) and major cell type (b). c, Dotplot showing the normalized expression levels of marker genes and the percentages of cells expressing them for each annotated cell type. Each row represents a cell cluster, with the average gene expression for each cluster normalized to a range between 0 and 1 across clusters. d,e, Dotplots showing the normalized signature scores for each neoplastic cell state (d) and macrophage subset (e). Each row represents a predicted cell subpopulation, with the average signature score for each cell state normalized to a range between 0 and 1 across cell types. f,g, Barplots displaying the proportions of projected neoplastic cell states (f) and macrophage subsets (g) for treated mice and controls. h, Spatial co-localization analysis of ligand–receptor interactions predicted between neoplastic cells and macrophage subsets based on snRNA-seq data. The Hbegf–Erbb4 interaction is highlighted in red. i, Representative image illustrating the spatial co-localization of Erbb4+ neuroblasts and Hbegf+ macrophages. The dots represent individual transcripts. j, Comparison of spatial distances between Hbegf+ macrophages and Erbb4+ neuroblasts versus other neuroblasts. Significance was assessed by two-sided (left) and one-sided (right) Wilcoxon rank-sum test.
Macrophage-secreted HB-EGF promotes tumor survival
Given these ligand–receptor interactions, we hypothesized that pro-tumorigenic macrophages contribute to therapeutic resistance via activation of ErbB receptor tyrosine kinases in adrenergic neoplastic states. We nominated several ligands of the ERBB4 growth factor receptor, including HB-EGF, EREG and TGFA. Moreover, HB-EGF and EREG consistently interacted with ERBB4 in all neoplastic states except the MES state (Fig. 4e). We found that HBEGF, but not EREG or TGFA, was expressed more after therapy across the snRNA-seq dataset within multiple macrophage subsets (Extended Data Fig. 9e). Therefore, we aimed to examine the coordinated roles of HB-EGF and the ErbB pathway in vitro by co-culturing five neuroblastoma cell lines with macrophages differentiated from the THP-1 monocyte cell line (THP-1 macrophages). First, we found that the surface expression of HB-EGF on THP-1 macrophages was increased when co-cultured with neuroblastoma cells in all five cell lines (Fig. 6a,b). Furthermore, an enzyme-linked immunosorbent assay (ELISA) performed with cell culture supernatant confirmed the exclusive secretion of HB-EGF ligand by THP-1 macrophages in the co-culture and the absence of EREG and TGFA expressions (Fig. 6c), further nominating HB-EGF as the active ligand. In parallel, we noticed significant phosphorylation increase of the ERBB4 receptor on neuroblastoma cells when co-cultured with macrophages, compared with monoculture, in three of the five cell lines examined (Fig. 6d). Taken together, these findings implicate that HB-EGF/ERBB4 signaling mediates the neuroblast and macrophage interaction.
Fig. 6: Macrophage-secreted HB-EGF activates ERK signaling and promotes proliferation.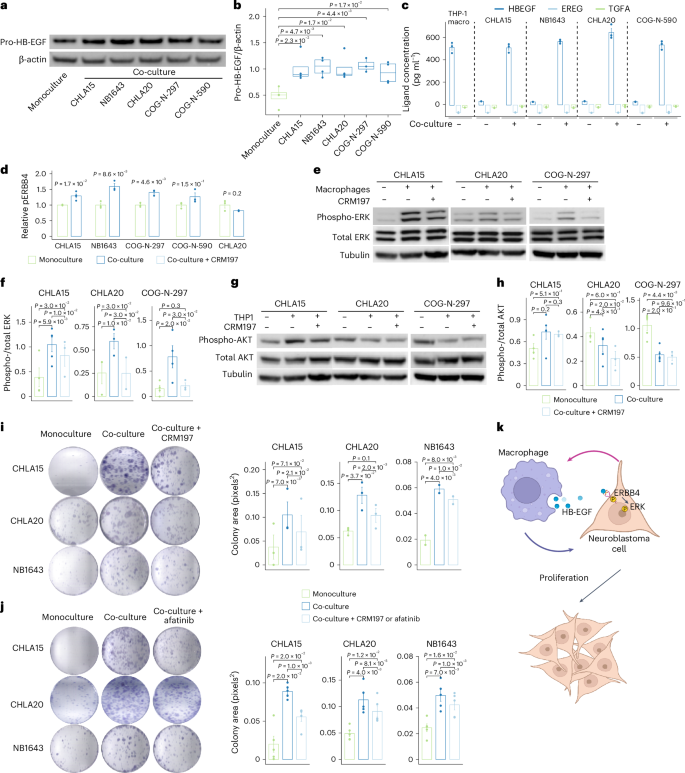
a, Representative western blot of cell-surface HB-EGF (pro-HB-EGF) from THP-1 macrophages in monoculture and co-culture with neuroblastoma cell lines. b, Quantification of the results from a across all replicates, normalized to β-actin (n = 3 for COG-N-297 and n = 4 for the others). Central lines indicate median values, the box edges mark the 25th and 75th percentiles and the whiskers extend 1.5 times the interquartile range. c, Ligand concentrations in the media of THP-1 macrophage monoculture and co-culture with neuroblastoma cell lines, measured by ELISA (n = 3). d, Phosphorylated ERBB4 (pERBB4) levels in neuroblastoma cells after co-culture with THP-1 macrophages, measured by ELISA (n = 4 for CHLA15 and n = 3 for the others). Significance in b and d was calculated using a Welch’s two-sided t-test. e, Representative western blots showing ERK activation in neuroblastoma cells with and without macrophage co-culture and the HB-EGF inhibitor CRM197. f, Quantification of the results from e across all replicates, normalized to total ERK (n = 5, 3 and 4, from left to right). g, Representative western blots showing AKT phosphorylation in neuroblastoma cells with and without macrophage co-culture and the HB-EGF inhibitor CRM197. h, Quantification of the results from g across replicates, normalized to total AKT (n = 3 for the treatment group and n = 5 for the others). i, Representative images (left) and quantification (right) of the area of colony formation for neuroblastoma cells co-cultured with THP-1 macrophages with or without treatment with CRM197 (from left to right: n = 3, 3 and 2 per condition). j, Representative images (left) and quantification (right) of the area of colony formation for neuroblastoma cells co-cultured with THP-1 macrophages with or without treatment with the pan-ERBB inhibitor afatinib (n = 4). The experiments in i and j were repeated two to four times with two to four samples per condition and the averaged values across samples are shown. Significance was calculated using a one-sided paired t-test (f, i and j) or two-sided paired t-test (h). The error bars in a–c, f and h–j represent means ± s.d. k, Neuroblastoma cells stimulate HB-EGF secretion from THP-1-derived macrophages, which reciprocally induce the phosphorylation of ERBB4 on neuroblastoma cells. Activation of ERBB4 stimulates proliferation via the ERK pathway. Panel k was created with BioRender.com.
ErbB signaling has been demonstrated to regulate cell proliferation, differentiation and apoptosis through the PI3K–AKT and RAS–RAF–MEK–ERK pathways44. Therefore, we aimed to determine which downstream signaling pathways are induced by ErbB activation. We performed western blots of total and phosphorylated AKT and ERK proteins after co-culture and monoculture using three neuroblastoma cell lines. We found that ERK phosphorylation was increased whereas AKT phosphorylation was unchanged or decreased in all three cell lines. Moreover, in the presence of the HB-EGF inhibitor CRM197, ERK phosphorylation was significantly reduced whereas AKT phosphorylation remained unchanged, suggesting that ERK activation is indeed induced by HB-EGF secreted from co-cultured macrophages (Fig. 6e–h).
We hypothesized that the activated ErbB pathway contributes to tumor cell survival. To test this, we treated three neuroblastoma cell lines co-cultured with THP-1 macrophages either with CRM197 or the ERBB tyrosine kinase inhibitor afatinib. We quantified the resulting growth effect using a colony formation assay before and after pharmacological inhibition. We first confirmed that neuroblastoma cell growth was increased with macrophage co-culture compared with monoculture in all three cell lines tested. Next, we found that neuroblastoma cell growth was consistently reduced by either CRM197 or afatinib treatment (Fig. 6i,j). In summary, we conclude that neuroblastoma cells induce HB-EGF in TAMs, which in turn activates the ERBB4 receptor in tumor cells, stimulates downstream ERK signaling and promotes tumor cell proliferation (Fig. 6k).
To assess the broad impact of tumor–macrophage interactions on neoplastic cell phenotypes, we performed scRNA-seq on the neuroblastoma cell lines CHLA15 (diagnostic) and CHLA20 (after therapy) co-cultured with THP-1 macrophages. Co-culture induced notable changes in neuroblast cell states. In both cell lines, the ADRN-calcium, Interm-OXPHOS and MES states expanded upon co-culture, whereas the ADRN-calcium state retracted (Fig. 7a,b), mirroring the cell state shifts that occur after standard therapy (Fig. 2e). Subsequently, treatment with afatinib consistently led to a decrease in the Interm-OXPHOS state. A pathway analysis of the tumor cells revealed that co-culture upregulated multiple pathways, including epithelial-to-mesenchymal transition, tumor necrosis factor alpha signaling and inflammatory response, and downregulated cell cycle pathways (Fig. 7c,d and Supplementary Table 12). Treatment with afatinib or CRM197 reversed many of these pathways compared with the untreated co-culture condition. For example, epithelial-to-mesenchymal transition was suppressed by CRM197 in both cell lines after its initial upregulation upon co-culture (Fig. 7c,d). This experiment suggests that macrophage interaction induces similar neoplastic state shifts that occur during standard therapy and implicates macrophage-driven ErbB signaling in modulating various neoplastic cellular processes.
Fig. 7: Transcriptomic analysis of mono- and co-cultured macrophages and neuroblasts.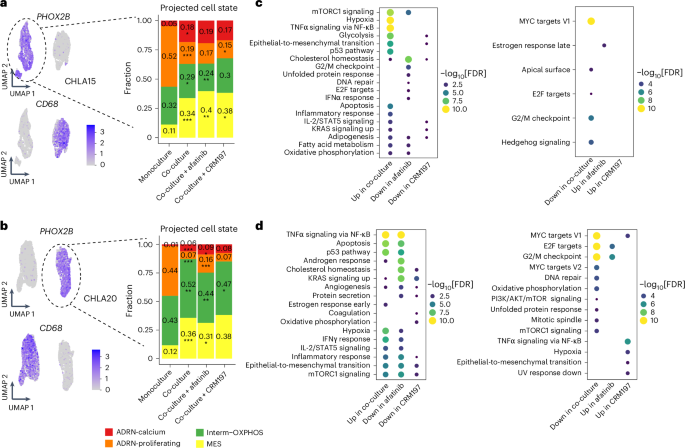
a, Left, UMAP plots showing cells from monoculture and co-culture with THP-1 macrophages, colored by the normalized expression levels of PHOX2B and CD68 for the CHLA15 cell line. Right, barplots depicting the proportions of projected neoplastic cell states across experimental conditions. b, UMAP and neoplastic cell state inference of co-culture experiments with the CHLA20 cell line as in a. The P values in a and b were calculated using a two-sided proportion test, comparing either co-culture versus monoculture or co-culture with treatment versus co-culture without treatment. No multiple comparison adjustment was made. c, Differential pathway analysis of CHLA15 cells using the hallmark pathways from the Molecular Signatures Database. Pathways in the co-culture condition were compared versus the monoculture condition and pathways in the co-culture with treatment condition were compared versus the co-culture without treatment condition. d, Pathway analysis of co-cultured CHLA20 cells as in c. The P values in c and d were calculated based on Fisher’s exact test using enrichR and corrected using the Benjamini–Hochberg procedure. *P P P