CIN signatures as biomarkers of chemotherapy resistance
The presence of CIN in a tumor has long been recognized to contribute to chemotherapy sensitivity15. The opposite also holds true, where tumors with stabilizing genomes tend to be resistant16. In a recent proof-of-principle study, we showed that CIN signatures can further refine treatment response prediction, identifying patients resistant to platinum-based chemotherapies13. Here, we aimed to reformulate and extend these biomarkers as predictors of chemotherapy resistance across multiple tumor types.
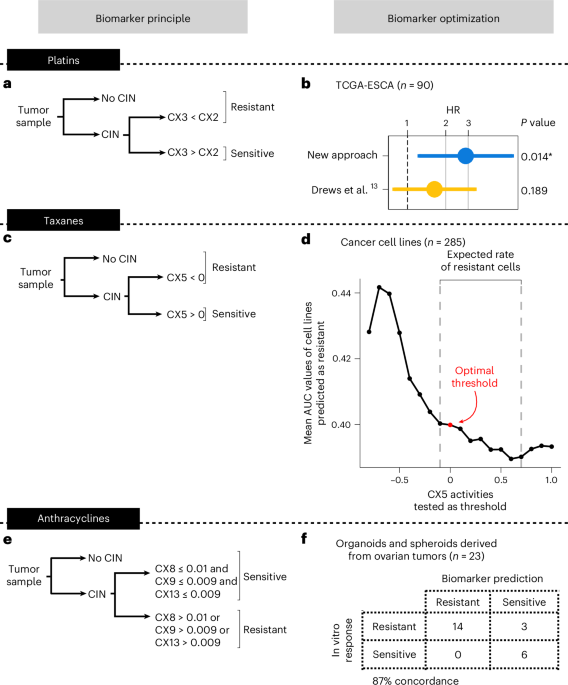
First, we constructed a biomarker of resistance to platinum treatment. Initially, we apply our CIN signature framework to determine tumors with and without detectable CIN. Those tumors without CIN are classified as resistant. For tumors with CIN, similar to our original study13, we use a ratio of two signatures of impaired homologous recombination (IHR), where CX2 > CX3 indicates resistance (Fig. 1a). This is based on observations that CX2 represents a type of IHR that does not confer sensitivity to platinum-based chemotherapies, whereas CX3 does13. This sensitivity is based on a principle of synthetic lethality, where cells with CX3-based IHR cannot tolerate the damage introduced by platinum treatment. A critical step to enable application of this classifier to multiple tumor types is the computation of a robust scaling model for the signatures. Here, we compute a multitumor-type scaling using all BRCA1 and BRCA2 mutant cases present in the The Cancer Genome Atlas (TCGA) cohort (Extended Data Fig. 1a). This scaling shows improved overall survival prediction for patients treated with platinum-based chemotherapies when applied to an esophageal cohort from the original study13 (Fig. 1b).
Fig. 1: Optimization of biomarkers to predict chemotherapy resistance pan-cancer.
a, The workflow for using CIN signatures as biomarkers for predicting resistance to platinum-based chemotherapies. b, Cox proportional-hazards regression models showing overall survival in TCGA esophageal adenocarcinoma (TCGA-ESCA) patients (n = 90) classified as predicted or sensitive to platinum-based chemotherapy after applying the classifier from a. The dots and error bars represent the HR and its 95% CI, respectively. The Cox proportional-hazards models correct for stage and age at diagnosis. The asterisk denotes a significant result at a level of 0.05. c, The workflow for using CIN signatures as biomarkers for predicting resistance to taxanes. d, A dot plot showing the mean AUC of cell lines predicted as resistant (y axis) using a range of signature activities for thresholding (x axis). A total of 285 cell lines having high-quality paclitaxel response data were included in the analysis. The red dot denotes the activity value selected as the optimal threshold. The dashed lines show the lower and upper CX5 activity thresholds that match the expected rate of cells as resistant (30% to 60%). e, The workflow for using CIN signatures as biomarkers for predicting resistance to anthracyclines. f, A contingency table showing the agreement between the observed and the predicted response of patient-derived models to doxorubicin in vitro. Samples with at least one of the three amplification-related signatures (CX8/CX9/CX13) showing an activity higher than the optimal threshold were predicted as resistant.
Next, we built a biomarker of taxane resistance using IHR signature CX5, which was previously shown to be correlated with paclitaxel response in vitro13, again under the principle of synthetic lethality (Supplementary Table 1). As with the platinum biomarker, samples without CIN are considered resistant. For samples with CIN, we sought an optimal threshold on CX5 signature activity to classify a sample as resistant (Fig. 1c). To do this, we used 287 cell lines treated with paclitaxel and explored a range of signature values to find the optimal activity threshold to separate cells based on the area under the dose response curve (AUC) density (Fig. 1d and Supplementary Fig. 1). To ensure multitumor-type applicability, we scaled signature activities across the whole TCGA, resulting in an optimal threshold of z score-scaled signature activity of CX5 1d and Extended Data Fig. 1b).
Finally, as anthracyclines are widely used across multiple tumor types, we sought a biomarker of resistance to anthracycline treatment. Like many other genotoxic chemotherapies, anthracyclines can cause DNA damage resulting in extrachromosomal DNA encapsulated in micronuclei17. When micronuclei rupture and release their contents into the cytoplasm, this can trigger the activation of cGAS–STING signaling, resulting in proinflammatory signaling through type I interferon18. It has also been established that such immune system activation is crucial for the success of anthracycline treatments19. However, how tumors resist anthracycline treatment is less well known. Tumors exposed to chronic cGAS–STING activation have been shown to undergo a switch to noncanonical NF-κB signaling, ultimately promoting metastasis and immune evasion20. Therefore, it is possible that tumors resistant to anthracyclines may tolerate the ongoing formation of micronuclei via this switching mechanism. This switching mechanism is seen as an important bottleneck during tumor evolution18 and may represent a vital distinction between anthracycline sensitive and resistant tumors. As the amplified DNA commonly found in micronuclei can be incorporated back into the genome as homogeneously staining regions21, it may be possible to identify tumors that have survived this evolutionary bottleneck from their genomes. CIN signatures CX8, CX9 and CX13 represent focal amplifications linked to extrachromosomal DNA13,14. We therefore hypothesized they could be used to identify micronuclei-tolerant, and thus anthracycline-resistant, tumors. Indeed, we found the presence of these signatures in ovarian cell lines to be associated with reduced micronuclei formation capacity, suggesting the presence of tolerance mechanisms (Supplementary Note 1).
Therefore, we sought to construct a predictor where the presence of any of these three signatures would indicate resistance to anthracycline treatment (Fig. 1e). To estimate optimal thresholds for these signatures, we used a cohort of 8 patient-derived ovarian cancer organoids and 15 primary tumor spheroids isolated from ascites and treated with the anthracycline doxorubicin in vitro (Fig. 1f, Extended Data Fig. 1c and Supplementary Table 2). Signature activity was computed from sWGS of the organoids and spheroids before treatment and treatment response was estimated using the half-maximum inhibitory concentration (IC50). Samples were ranked by IC50 and labeled as sensitive or resistant based on the expected number of sensitive samples given the observed sensitivity to first-line platinum treatment in the donor patients (platinum-resistant patients are expected to have an 18% response rate to doxorubicin monotherapy22,23,24,25,26,27,28, whereas sensitive patients have a 28% response rate29). A threshold of 0.01 for CX8, and 0.009 for CX9 and CX13 showed optimal classification of the patient-derived models (Fig. 1f and Supplementary Note 1).
Pilot study in ovarian cancer
To test the performance of these resistance biomarkers in a clinic-like setting, we wanted to see whether we could use real-world data. To determine the feasibility of this strategy, we assembled a cohort of patients with high-grade serous ovarian cancer (HGSOC). HGSOC is an ideal test bed as all three chemotherapies (platinum based, taxanes and anthracyclines) are routinely used to treat patients. Here, we aimed to emulate three different phase 2 single-arm biomarker trials using 50 patients from the OV04 study where we could assess biomarker performance after first-line platinum treatment, post-first-line anthracycline treatment and post-first-line taxane treatment (Extended Data Figs. 2–4, Supplementary Figs. 2–4 and Supplementary Table 3).
For each patient, we sequenced tumor material collected at diagnosis using sWGS, derived copy number profiles and applied our three classifiers. Then, if eligible, patients were included in the emulation of a phase 2 biomarker trial, with a single-arm study design where all patients received the chemotherapy of interest (Extended Data Fig. 5a). Patients were considered eligible if they were 18 years or older, confirmed HGSOC, had progression free survival (PFS) intervals measurable by CA125 using the Gynecologic Cancer InterGroup criteria30,31 and recorded tumor stage. The primary objective of the trial emulation was to test the biomarker’s ability to predict resistance with an endpoint of CA125-based PFS.
For each of the three emulations, we considered patients who received treatment lines containing first-line platinum-based chemotherapies, post-first-line taxanes and post-first-line anthracyclines. Treatment lines were accepted that were either monotherapy or given in combination with other treatments. Predicted resistant and sensitive arms were compared using Cox proportional-hazards models, correcting for tumor stage, age at diagnosis, treatment line (for taxane), general aneuploidy (via the weighted genome instability index (wGII)) and whether the patient received maintenance therapy (during first-line treatment or before treatment with taxane or anthracycline). We defined maintenance therapies as either niraparib, olaparib, bevacizumab or letrozole. For taxane and anthracycline treatments, eligibility criteria and survival analysis design was given careful consideration to control for the effects of first-line platinum-free interval on treatment response at second line32 (see Supplementary Note 2 for details).
The 22 (out of 45) patients predicted as platinum resistant showed significantly increased risk of progression after treatment with platinum (hazard ratio (HR) of 2.340, 95% confidence interval (CI) 1.155–4.742, P = 0.0183; Fig. 2a). The 17 (out of 29) patients predicted as taxane resistant also showed significantly increased risk of progression after treatment post-first-line with taxane (HR of 6.567, 95% CI 1.489–28.957, P = 0.013; Fig. 2b). Finally, the 13 (out of 30) patients predicted as anthracycline resistant showed increased risk of progression after treatment with anthracycline post-first-line (HR of 20.020, 95% CI 1.059–378.635, P = 0.010; Fig. 2c). For all analyses, the significance level for detecting an effect was 0.05.
Fig. 2: Performance assessment of platinum, taxane and anthracycline resistance prediction in the clinical OV04 study.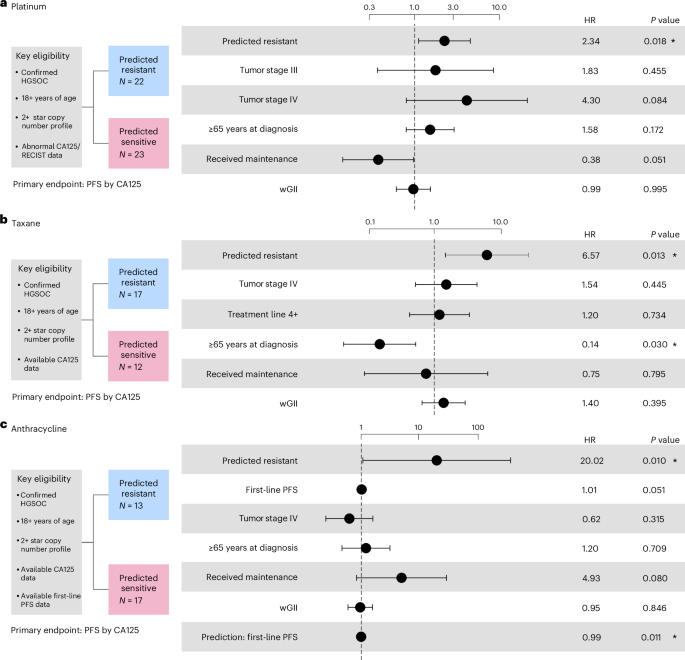
a, Cox proportional-hazards model results for predicting resistance to platinum-based chemotherapy. b, Cox proportional-hazards model results for predicting resistance to taxane. c, Cox proportional-hazards model results for predicting resistance to anthracycline. PFS was used as the endpoint. All analyses were evaluated at a significance level of 0.05. An asterisk denotes significant results. Dots and error bars represent the HR and its 95% CI, respectively. Multiple testing correction was not applied as each combination of biomarker and cohort is unique.
Emulating biomarker trials to assess performance
Since the pilot study confirmed that retrospective real-world data can be used to test performance, we sought orthogonal validation using additional real-world data to emulate either phase 3 RCTs (Extended Data Fig. 5b), phase 3 RCT enrichment trials (Extended Data Fig. 5c) or phase 2 single-arm trials (Extended Data Fig. 5a).
To achieve this, we assembled a series of pan-cancer real-world retrospective cohorts33,34 consisting of patients with primary or metastatic disease who were treated with one of the chemotherapies of interest or with an alternate standard of care (SoC), had clinical response data enabling time to treatment failure (TTF) calculation and had sufficient quality genomic data to compute CIN signatures. To identify which cohorts were powered for phase 3 or phase 2 analysis, we used the HRs determined from the pilot study, alongside censoring and prediction ratio data from the cohorts, to carry out calculations for a one-tailed power analysis with a power of 0.8 and a significance level of 0.05 (Supplementary Table 4). Cohorts that had sufficient sample sizes to meet the power requirements were then taken forward for analysis (summarized in Extended Data Tables 1 and 2). We were sufficiently powered to perform phase 3 emulation assessments for patients with relapsed ovarian, metastatic breast and metastatic prostate cancer treated with taxanes, and patients with relapsed ovarian and metastatic breast treated with anthracyclines. We were sufficiently powered to perform phase 2 emulation assessments (but not phase 3) for patients with primary ovarian cancer treated with platinum and sarcoma treated with anthracyclines.
In the phase 3 RCT emulations, patients were classified as resistant or sensitive to the chemotherapy of interest based on our biomarkers. Within these sensitive or resistant groups, patients were then retrospectively assigned to the experimental arm (treated with the chemotherapy of interest) or to the control arm (treated with an appropriate SoC therapy). Inverse probability weighting was applied to account for potential treatment selection biases across patients due to year of treatment/biopsy. The experimental and control arms were then compared using Cox proportional-hazards models for both the predicted resistant and predicted sensitive populations, with TTF as the primary endpoint.
In the phase 2 single-arm emulations, patients that were treated with the chemotherapy of interest were classified as resistant or sensitive based on our biomarkers, then these groups were compared using a Cox proportional-hazards model with TTF as the primary endpoint.
Platinum resistance in primary ovarian cancer (single arm)
Prediction of resistance to platinum-based treatment in primary HGSOC was assessed using a cohort of 352 patients (Supplementary Table 5). Patients were considered eligible if they were 18 years of age or over, had grade 3 and stage III/IV cancer, with no requirement for measurable disease (according to the Response Evaluation Criteria In Solid Tumors (RECIST) 1.0). Statistical analysis of the cohort was performed using a stratified Cox proportional-hazards model by age at diagnosis (P = 0.0049; Fig. 3a and Supplementary Fig. 5).
Fig. 3: Performance assessment of platinum, taxane and anthracycline resistance prediction across real-world cohorts of primary tumors.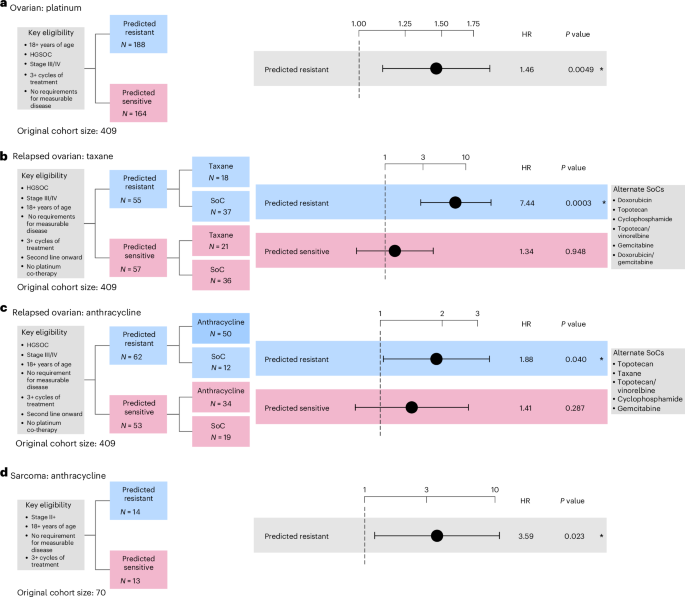
a, Cox proportional-hazards regression models showing TTF in patients with primary ovarian cancer predicted as resistant to first-line platinum-based treatment stratified by age at diagnosis (b, Cox proportional-hazards regression models showing TTF in patients with relapsed ovarian cancer predicted as resistant to taxane stratified by age at diagnosis (2). c, Cox proportional-hazards regression models showing TTF in patients with relapsed ovarian cancer predicted as resistant to anthracycline stratified by age at diagnosis (6 months first-line TTF). d, Cox proportional-hazards regression models showing TTF in patients with primary sarcoma predicted as resistant to anthracycline controlled for ifosfamide as a co-therapy. The limited sample size precluded us from correcting the model by other clinical covariates. All analyses were evaluated at a significance level of 0.05. An asterisk denotes significant results. The dots and error bars represent the HR and its 95% CI, respectively. Multiple testing correction was not applied as each combination of biomarker and cohort is unique. Inverse probability weighting was applied in all analyses to account for treatment selection biases across patients due to year of treatment/biopsy.
Taxane resistance in relapsed ovarian cancer (RCT)
Prediction of resistance to taxane-based treatment in relapsed HGSOC was assessed across a cohort of 112 patients (Supplementary Table 5). Eligibility criteria, trial design and survival analysis were given careful consideration to control for the effects of first-line platinum-free interval on treatment response at second line32 (Supplementary Note 2). Patients were considered eligible if they were 18 years of age or over, had grade 3 and stage III/IV cancer, with no requirement for measurable disease. Patients were assigned to the experimental arm if they received at least three cycles of taxane treatment post-first line. Patients were assigned to the control arm if they received treatment containing any of the five most common non-taxane- and non-platinum-based therapies, being doxorubicin, gemcitabine, cyclophosphamide, topotecan and vinorelbine. Statistical analysis of the cohort was performed using stratified Cox proportional-hazards models by age at diagnosis (2 for details).
In patients predicted to be resistant, the use of taxane-based treatment resulted in significantly higher risk of treatment failure compared with the SoC treatment (HR of 7.435, 95% CI 3.967–20.458, P = 0.0003; Fig. 3b, Extended Data Fig. 6a and Supplementary Fig. 6), suggesting predicted resistant patients do not derive benefit from taxane treatment. By contrast, the predicted sensitive patients showed no significant difference in TTF between the experimental and control arms (Fig. 3b, Extended Data Fig. 6b and Supplementary Fig. 7). This is in agreement with previous studies reporting comparable response among different chemotherapies after first-line treatment35. We found similar results when restricting the analysis to patients receiving single-agent taxane treatments, indicating that the differences in TTF between the experimental and control arms were not caused by the co-therapy administered (Supplementary Figs. 8 and 9).
Anthracycline resistance in relapsed ovarian cancer (RCT)
The prediction of resistance to anthracycline-based treatment in HGSOC was conducted in a cohort of 115 patients (Supplementary Table 5). Patients were considered eligible if they were 18 years of age or over and had grade 3 and stage III/IV cancer. There was no requirement for measurable disease. Patients were assigned to the experimental arm if they received at least three cycles of anthracycline and patients were assigned to the control arm if they received treatment containing any of the five most common non-anthracycline- and non-platinum-based therapies, being gemcitabine, vinorelbine, cyclophosphamide, taxane and topotecan. Statistical analysis of the cohort was performed using stratified Cox proportional-hazards models by age at diagnosis (6 months first-line TTF).
In patients predicted to be resistant, the use of anthracycline-based treatment resulted in significantly increased risk of treatment failure compared with the SoC treatment (HR of 1.881, 95% CI 1.029–3.439, P = 0.040; Fig. 3c, Extended Data Fig. 7a and Supplementary Fig. 10). By contrast the predicted sensitive analyses showed no significant difference in TTF between the experimental and control arms (Fig. 3c, Extended Data Fig. 7b and Supplementary Fig. 11). Similar results were found restricting to single-agent anthracycline treatment (Extended Data Fig. 7c and Supplementary Figs. 12 and 13).
Anthracycline resistance in sarcoma (single arm)
Prediction of resistance to anthracycline-based treatment in sarcoma was assessed across 27 patients (Supplementary Table 5). Patients were considered eligible if they were 18 years or over with no requirement for measurable disease. Statistical analysis of the cohort was performed using a Cox proportional-hazards model controlling for the presence of isophosphamide as a co-therapy36. Tumor stage annotation was not available for this cohort and so was not included in the analysis. Patients predicted to be resistant demonstrated a significantly increased risk of treatment failure when they received anthracycline-based treatment compared with those predicted as sensitive (HR of 3.591, 95% CI 1.193–10.811, P = 0.023; Fig. 3d and Supplementary Fig. 14).
Taxane resistance in metastatic prostate cancer (RCT)
Prediction of resistance to taxane-based treatment was conducted in a cohort of 238 patients with metastatic prostate cancer (Supplementary Table 5). Patients were considered eligible if they were 18 years or over and had presented with metastatic tumors. Treatment lines were only considered if they occurred immediately after a biopsy event. Patients were assigned to the experimental arm if they received at least three cycles of taxane or to the control arm if they had received any of the five most common non-taxane therapies given within the cohort: abiraterone, enzalutamide, olaparib, pembrolizumab or radium-223. Statistical analysis of the cohort was performed using Cox proportional-hazards models controlling for age at diagnosis (46–85 years). Tumor stage annotation was not available for this cohort.
Patients predicted to be resistant demonstrated a significantly increased risk of treatment failure compared with SoC (HR of 5.462, 95% CI 2.189–13.628, P = 0.0003; Fig. 4a, Extended Data Fig. 6c and Supplementary Fig. 15), while no significant differences were detected between treatment arms for patients predicted to be sensitive (Fig. 4a, Extended Data Fig. 6d and Supplementary Fig. 16). Similar results were observed when limiting the analyses to single-agent taxane treatment (Supplementary Figs. 17 and 18).
Fig. 4: Performance assessment of taxane and anthracycline resistance prediction across real-world cohorts of metastatic tumors.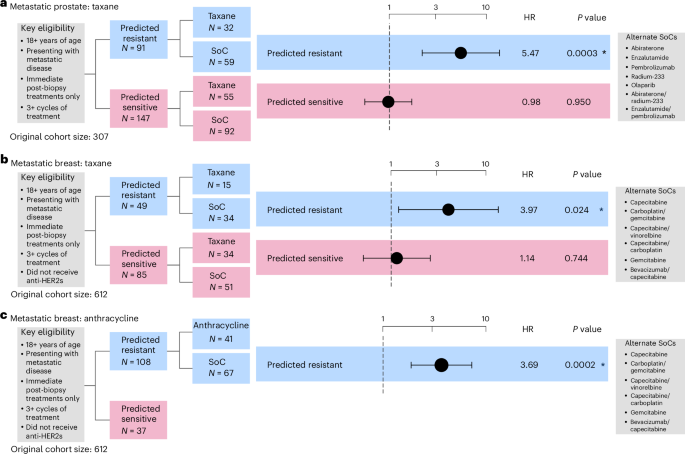
a, Cox proportional-hazards regression models showing TTF in patients with metastatic prostate cancer predicted as resistant to taxane controlled for age at diagnosis. Gleason grade was not available for correction. b,c, Cox proportional-hazards regression models showing TTF in metastatic breast patients predicted as resistant to taxane (b) and anthracycline (c). Regression models were controlled for age at diagnosis. The limited sample size in the anthracycline-sensitive arm precluded us from performing a survival analysis. All analyses were evaluated at a significance level of 0.05. An asterisk denotes significant results. The dots and error bars represent the HR and its 95% CI, respectively. Multiple testing correction was not applied as each combination of biomarker and cohort is unique. Inverse probability weighting was applied in all analyses to account for treatment selection biases across patients due to year of treatment/biopsy.
Taxane resistance in metastatic breast cancer (RCT)
Prediction of resistance to taxane-based treatment was conducted across 134 patients with metastatic breast cancer (Supplementary Table 5). Patients were considered eligible if they were 18 years or over and had presented with metastatic tumors. Patients were assigned to the experimental arm if they received at least three cycles of taxane and to the control arm if they received gemcitabine or capecitabine, in some cases in combination with bevacizumab, vinorelbine, gemcitabine or carboplatin. Patients were not included if they received hormone therapies. Statistical analysis of the cohort was performed using a Cox proportional-hazards model controlling for age at diagnosis (33–80 years).
Patients predicted to be resistant demonstrated a significantly increased risk of treatment failure compared with SoC (HR of 3.976, 95% CI 1.196–13.219, P = 0.024; Fig. 4b, Extended Data Fig. 6e and Supplementary Fig. 19), while no significant differences were detected in survival time between the treatment arms for patients predicted to be sensitive (Fig. 4b, Extended Data Fig. 6f and Supplementary Fig. 20).
Anthracycline resistance in metastatic breast cancer (enrich)
The prediction of resistance to anthracycline-based treatment in breast cancer was conducted in a cohort of 108 patients (Supplementary Table 5). Patients were considered eligible if they were 18 years of age or over and had stage III/IV cancer with no requirement for measurable disease. Patients were assigned to the experimental arm if they received at least three cycles of anthracycline-based treatment and assigned to the control arm if they received treatment containing any of the five most common non-anthracycline therapies, being bevacizumab, vinorelbine, gemcitabine or carboplatin. Statistical analysis of the cohort was performed using Cox proportional-hazards models controlling for age at diagnosis.
Patients predicted to be resistant showed significantly increased risk of treatment failure compared with SoC (HR of 3.685, 95% CI 1.866–7.277, P = 0.0002; Fig. 4c and Supplementary Fig. 21). We were not powered to determine performance in the predicted sensitive group, thus this emulation is considered to have an enrichment design (Extended Data Fig. 5c).
Assessing routes to clinical implementation
In the analyses presented here, our CIN signature biomarkers were determined using copy number profiles derived from either deep whole-genome sequencing (WGS) or sWGS, or Affymetrix SNP6 arrays. However, these assays are not yet routine in clinical practise. Comprehensive capture gene panels currently dominate the diagnostic DNA testing landscape in oncology. Therefore, we wanted to assess the feasibility of using the Illumina TruSight Oncology 500 (TSO500) assay to apply our resistance classifications. In addition, we also assessed the feasibility of using sWGS from liquid biopsies collected at the time of diagnosis. For eight tumors in the Cambridge Translational Cancer Research Ovarian Study 04 (OV04) pilot study with greater than 40% tumor purity, we performed profiling of the same DNA aliquot as the sWGS using the TSO500 assay; and for 29 patients, plasma samples were used to extract cell-free DNA, which underwent sWGS (Extended Data Table 3).
For samples profiled with the TSO500 assay, the copy number profiles derived showed a median percentage of genome-wide copy number difference of 16% (Supplementary Fig. 22). CIN signatures computed across these samples showed a median cosine similarity with the matched sWGS of 0.92 (Fig. 5a). Applying our classifiers showed 93% concordance, with only one sample given a prediction that did not match the sWGS-based prediction (Fig. 5b).
Fig. 5: Comparison of response prediction between paired samples.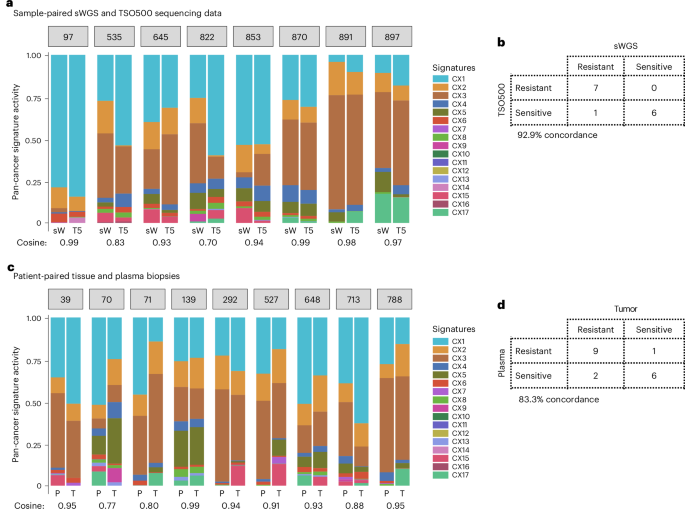
a, A bar plot showing the activities of the 17 CIN signatures (CX) in tumor biopsies sequenced by using both sWGS (sW) and TSO500 (T5). Only tissue biopsies from patients with high-quality sWGS-derived copy number profiles that met the inclusion criteria were also sequenced with TSO500. A cosine similarity close to 1 indicates similar activities between sample-matched data. b, A contingency table showing the number of patients predicted as sensitive or resistant using our signature-based clinical classifiers in tumor samples sequenced by sWGS and TSO500. c, A bar plot showing signature activities in matched tumor tissue (T) and plasma (P) samples from the same patient. Only high-quality plasma samples were used for deriving copy number profiles and signature quantification. A cosine similarity close to 1 indicates similar activities between patient-matched biopsies. d, A contingency table showing the number of patients predicted as sensitive or resistant using our signature-based clinical classifiers in tumor tissue and plasma biopsies. The numbers in gray boxes represent the patient IDs.
For cell-free DNA samples, DNA copy number profiles were generated and samples were categorized based on their circulating tumor DNA fraction as either low or high. Of the 29 patients who had plasma samples available, 9 samples (31%) were considered to have high circulating tumor DNA fraction and were subjected to CIN signature analysis. The remaining plasma samples had insufficient overall tumor DNA to assess CIN using the currently available CIN signature methods. Between plasma and tumor tissue pairs, the median percentage of genome-wide copy number difference was 20.8% (Supplementary Fig. 23), and activity levels of CIN signatures had a median cosine similarity of 0.90 (Fig. 5c). Resistance classification for relevant therapies across the patients showed 83.3% concordance (Fig. 5d), with two patients showing alternate predictions for platinum and one patient for taxane. These results suggest that for approximately 31% of patients with ovarian cancer, our predictors may be applied using a simple blood test, without the need for a tumor biopsy or a surgical specimen, although testing over larger cohorts is necessary.