
Genome sequencing of chemotherapy-exposed blood
To conduct a primary survey of chemotherapy effects on normal blood cell genomes, we analyzed 23 individuals with hematological or solid malignancies who had collectively been exposed to multiple chemotherapy classes and multiple members of each class, with variable time intervals since exposure. These individuals were aged 3–80 years and had been treated with commonly used chemotherapy regimens for hematological malignancies (Hodgkin lymphoma, n = 2; follicular lymphoma, n = 5; diffuse large B cell lymphoma, n = 2; lymphoplasmacytic lymphoma, n = 1; marginal zone lymphoma, n = 1; multiple myeloma, n = 1; acute myeloid leukemia (AML), n = 1) and solid cancers (colorectal carcinoma, n = 9; neuroblastoma, n = 1; lung cancer, n = 1). One individual had been treated with chemotherapy for both multiple myeloma and colorectal carcinoma. The individual with AML had also been treated with chemotherapy for Behcet disease, a noncancer condition (Fig. 1a and Supplementary Table 1). Most had received a combination of agents and, collectively, had been exposed to 21 drugs from all of the main chemotherapy classes, including alkylating agents (cyclophosphamide, n = 8; chlorambucil, n = 2; bendamustine, n = 5; procarbazine, n = 2; melphalan, n = 1), platinum agents (oxaliplatin, n = 7; carboplatin, n = 2; cisplatin, n = 1), antimetabolites (capecitabine, n = 7; 5-fluorouracil, n = 6; gemcitabine, n = 1; cytarabine, n = 1), topoisomerase I inhibitors (irinotecan, n = 5), topoisomerase II inhibitors (etoposide, n = 4; doxorubicin, n = 4; daunorubicin, n = 1; mitoxantrone, n = 1), vinca alkaloids (vincristine, n = 7; vinblastine, n = 1; vinorelbine, n = 1) and cytotoxic antibiotics (bleomycin, n = 1). The time intervals from chemotherapy exposure to tissue sampling ranged from less than 1 month to 6 years for most cases. However, one individual sampled at age 48 years had been treated for Hodgkin lymphoma at ages 10 and 47 years. Additionally, the individual sampled at age 43 years following induction chemotherapy for AML had also received long-term chlorambucil for Behcet disease diagnosed at age 13 years. Seven patients had also received localized radiotherapy (Supplementary Table 1). We endeavored to exclude a chemotherapy agent being administered in the context of only a single cancer type to avoid any confounding effects, but this was not always possible (Fig. 1a). Results were compared to those from nine healthy, non-chemotherapy-exposed individuals (Fig. 1a and Supplementary Table 1).
Fig. 1: Donor information and experimental approach.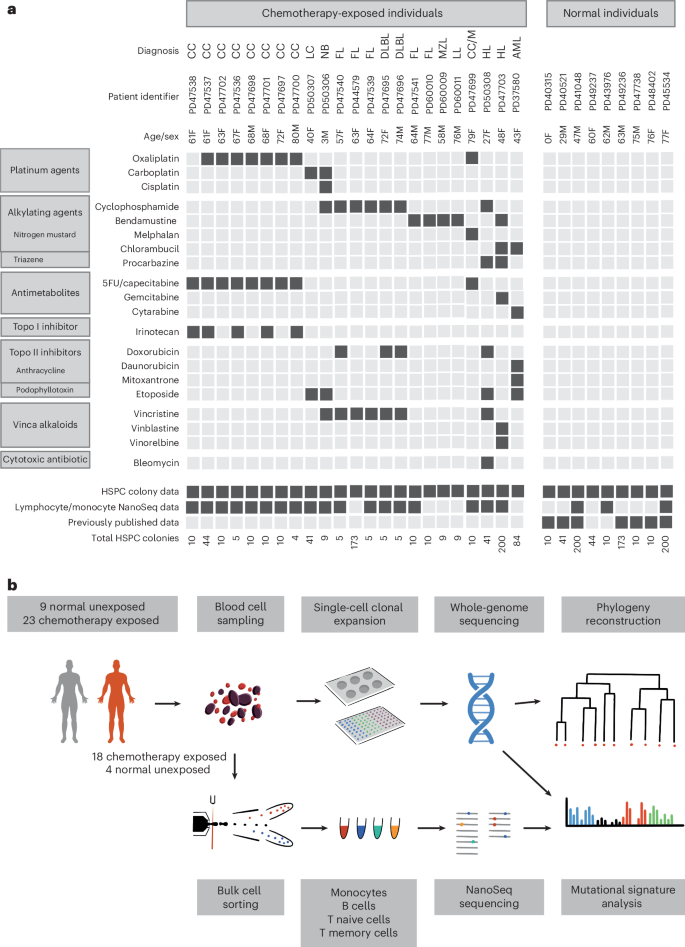
a, Donor demographic details, chemotherapy exposure and sample information. CC, colorectal carcinoma; LC, lung cancer; NB, neuroblastoma; FL, follicular lymphoma; DLBL, diffuse large B cell lymphoma; MZL, marginal zone lymphoma; LL, lymphoplasmacytic lymphoma; M, multiple myeloma; HL, Hodgkin lymphoma; 5FU, 5-fluorouracil; Topo, topoisomerase. b, Experimental approach.
Three experimental designs for detecting and analyzing somatic mutations were used. First, 189 single-cell-derived hematopoietic stem and progenitor cell (HSPC) colonies from the 23 chemotherapy-exposed individuals and 90 colonies from the 9 controls were expanded and individually subjected to WGS at 23-fold average coverage to compare mutation burdens and mutational signatures (Extended Data Fig. 1a,b). Second, from six individuals exposed to a range of chemotherapeutic agents, a further 589 single-cell colonies underwent WGS (41–259 colonies per individual; mean sequencing depth 15-fold). These phylogenies were compared to similar-sized phylogenies (608 colonies) from five normal individuals across a similar age range to survey the effect of chemotherapy on the clonal structure of the HSPC population. Third, flow-sorted subpopulations of B cells, T memory cells, T naive cells and monocytes from whole-blood samples from 18 chemotherapy-exposed individuals and 3 unexposed normal individuals (Fig. 1b) underwent WGS using duplex sequencing, which allows reliable identification of somatic mutations in polyclonal cell populations25.
Chemotherapy-induced somatic mutations in the blood
Somatic single-base substitution (SBS) mutations in HSPCs from normal adults accrue constantly at a rate of ~18 per year, leading to a burden of ~1,500 SBSs in 80-year-old individuals24. HSPCs from 17 of the 23 chemotherapy-exposed individuals showed elevated mutation burdens compared to those expected for their ages (P −16, mixed-effects model) (Fig. 2). Four showed large increases of >1,000 SBSs (Fig. 2a), thirteen showed more modest increases of 200–600 SBSs (Fig. 2b), and six showed no increases (Extended Data Fig. 1c–f). The burdens of small indels in HSPCs were also increased in the four individuals with the greatest elevations in SBS burdens (Extended Data Fig. 2a,b). Increases in structural variant and copy number changes were not observed, including in those individuals exposed to topoisomerase II inhibitors, which have been implicated in the development of secondary malignancies driven by specific oncogenic rearrangements26 (Extended Data Fig. 2c,d). However, the small number of individuals may have limited the statistical power to identify minor differences.
Fig. 2: Mutation burden and mutational signatures in normal and chemotherapy-exposed blood cells.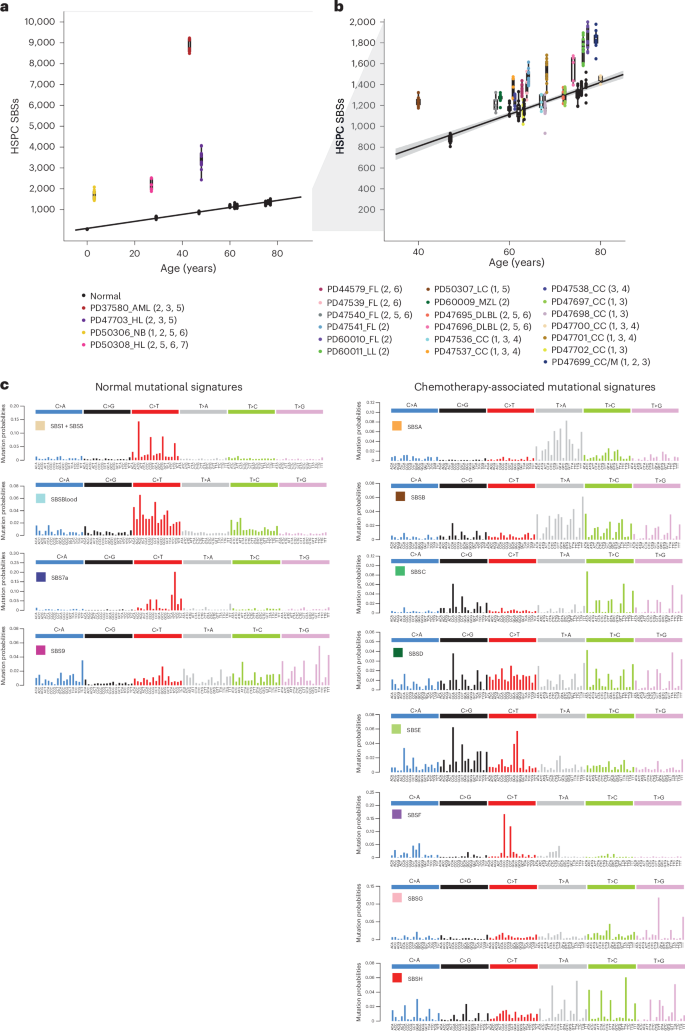
a, Burden of SBS across normal individuals and the four chemotherapy-exposed individuals with the highest SBS burdens. The points represent individual HSPC colonies. The boxes indicate the median and interquartile range; the whiskers denote the minimum and maximum values. The black line represents a regression of age on mutation burden across the unexposed individuals, with the 95% confidence interval shaded. Annotations indicate the corresponding individuals from Fig. 1, providing details on the type of malignancy (as previously defined) and chemotherapy treatment (1, platinum agents; 2, alkylating agents; 3, antimetabolites; 4, topoisomerase I inhibitors; 5, topoisomerase II inhibitors; 6, vinca alkaloids; 7, cytotoxic antibiotics). b, Depiction of data as in a, but the y axis is cut off at 2,000 SBSs for better visualization of the majority of the chemotherapy-exposed cohort data. The points represent individual HSPC colonies. The boxes indicate the median and interquartile range; the whiskers denote the minimum and maximum values. The gray shading in b represents the 95% CI of the regression of age on mutation burden across the unexposed individuals. The black line represents a regression of age on mutation burden, with the 95% confidence interval shaded. c, Mutational signatures extracted using the hierarchical Dirichlet process (HDP) from the full dataset of normal and chemotherapy-exposed HSPC colonies and duplex sequencing of bulk mature blood cell subsets.
Nineteen of the twenty-three chemotherapy-treated individuals received multiple agents. Therefore, in many cases, it was uncertain which agents were responsible for the elevated mutation loads. To address this, we extracted mutational signatures from the SBS and indel mutation catalogs of chemotherapy-exposed individuals and controls and estimated the contribution of each signature to the somatic mutations in the blood cells of each individual (Fig. 2c and Extended Data Fig. 3). We used prior knowledge of previously described mutational signatures attributed to normal endogenous mutational processes and to some mutagenic exposures27, as well as the specific chemotherapy regimens received by each individual, to associate each signature with its putative causative agent.
Twelve SBS mutational signatures were extracted (Fig. 2c and Supplementary Table 2). Four were composed of known signatures of normal HSPCs and mature lymphocytes (Supplementary Table 3). The first was predominantly constituted by SBS1, characterized by C>T mutations at CG dinucleotides, together with a contribution from SBS5, which is relatively flat and featureless. SBS1 and SBS5 are found in most normal cell types thus far studied. The second was SBSBlood, a blood-specific signature predominant in HSPCs28,29. The third was SBS7a, an ultraviolet light-caused signature found in memory T cells that have presumably resided in the skin during life30. The fourth was SBS9, a signature of somatic hypermutation found in B cells (Fig. 2c). Three indel mutational signatures were extracted (Supplementary Table 4). Two were similar to known indel signatures and were present in both normal and chemotherapy-exposed individuals: the first comprised ID1, and the second was a composite of ID3, ID5 and ID9 (ID3/5/9; Extended Data Fig. 3).
Eight SBS mutational signatures were interpreted as being present exclusively in chemotherapy-treated individuals (Fig. 2c), based on the observation that they accounted for 4). Four of these have not been reported previously and are not represented in the COSMIC SBS mutational signature database. SBSA is likely due to the triazene alkylating agent procarbazine. There were three similar but distinct signatures relating predominantly to specific nitrogen mustard alkylating agents: SBSC to chlorambucil, SBSD to bendamustine and SBSE to melphalan. SBSF is associated with the platinum agents cisplatin and carboplatin, and SBSG is associated with the antimetabolite 5-fluorouracil or its prodrug capecitabine. The etiologies of SBSB and SBSH are less clear-cut and are discussed further below. Excess SBSs and specific SBS mutational signatures were not obviously associated with topoisomerase inhibitors (which cause DNA strand breaks), vinca alkaloids (which inhibit microtubule formation during cell division) and the cytotoxic antibiotic bleomycin (which is thought to bind and cleave DNA). Only one high-confidence indel mutational signature was found exclusively in chemotherapy-treated individuals: IDA, associated with procarbazine exposure.
SBSA contributed substantial additional mutation loads to blood cells from two individuals treated for Hodgkin lymphoma (PD50308 and PD47703) (Fig. 3). The only chemotherapy common to their treatment regimens was the alkylating agent procarbazine; no other individuals had been treated with procarbazine, and HSPC phylogenies indicated that SBSA mutations occurred early during PD47703’s life, consistent with procarbazine treatment at age 10 years (Extended Data Fig. 5a). The observed mutational signatures were compared to those previously reported, using a combination of visual inspection, data review and the cosine similarity between trinucleotide mutation profiles. Cosine similarities >0.90 between two mutational signatures are highly unlikely to occur by chance, and a cosine similarity of >0.95 generally suggests the same underlying process. SBSA exhibits similarity to COSMIC signature SBS25 (cosine similarity 0.84), which has previously been associated with procarbazine19,31. An indel signature (IDA) was also identified as being most likely attributable to procarbazine, being found only in the two individuals treated with procarbazine (Extended Data Fig. 3). Alkylating agents cause alkyl DNA adducts, resulting in base mispairing and DNA breaks. Procarbazine is a triazene/hydrazine monofunctional alkylating agent.
Fig. 3: Phylogenetic trees and mutational signatures across a range of normal and chemotherapy-exposed individuals.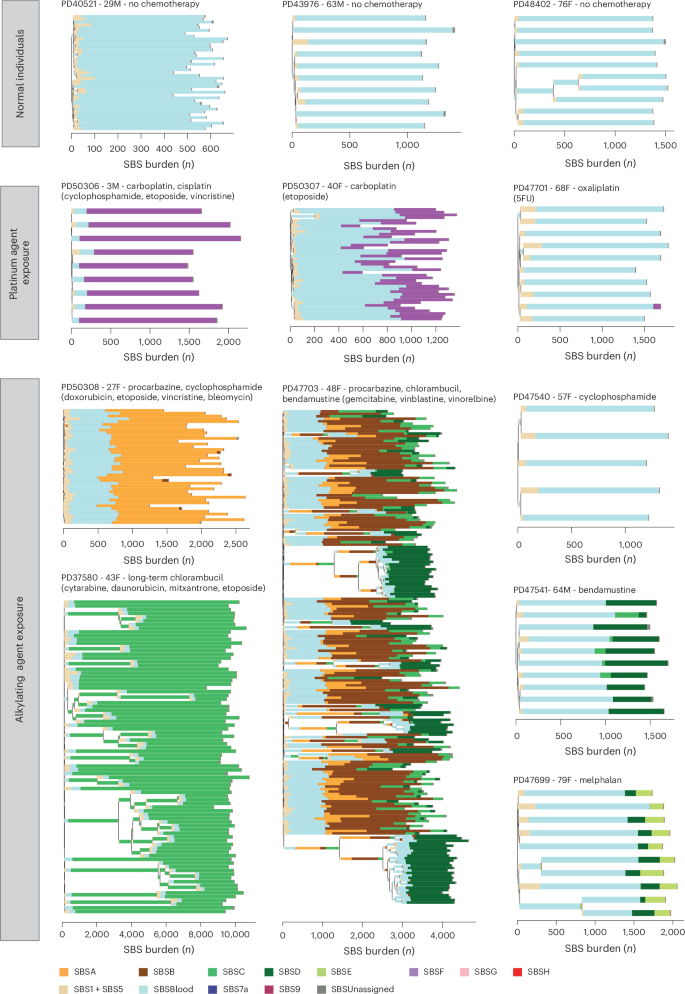
Phylogenies were constructed using shared mutation data and the algorithm MPBoot (Methods). Branch lengths correspond to SBS burdens (x axes). A stacked bar plot represents the signatures contributing to each branch, with the color code below the trees. SBSUnassigned indicates mutations that could not confidently be assigned to any reported signature. Drugs in parentheses are those received by the individual at the same time but not believed to be the mutagenic agents.
SBSB was found predominantly in the individual exposed to chlorambucil, procarbazine and bendamustine (PD47703). SBSB, like SBSA (procarbazine), is predominantly composed of T>A substitutions, with a cosine similarity to SBSA of 0.82 and cosine similarities to SBSD (bendamustine; 0.82) and SBSC (chlorambucil; 0.74) suggesting that it is unlikely to be due to any of these in isolation. It is also present at low levels in the T memory cells of the other procarbazine-exposed individual who was also exposed to cyclophosphamide (PD50308). It seems plausible that SBSB may result from an interaction between two classes of alkylating agents.
Of the nitrogen mustard-associated signatures, SBSC contributed all mutations to the individual who received chlorambucil from childhood (PD37580); SBSD contributed all excess mutations to one of the individuals exposed to only bendamustine (PD60010) and was also present at a much lower burden in a subset of cyclophosphamide-exposed individuals; SBSE was found only in the single individual exposed to low-dose melphalan (PD47699). Nitrogen mustard alkylating agents have two reactive sites and are, in consequence, bifunctional, forming intrastrand and interstrand DNA cross-links in addition to simple adducts. The SBSC and SBSD signatures identified here are similar to a recently published mutational signature found in the germlines of two individuals whose fathers had been treated with two different nitrogen mustard agents (chlorambucil and ifosfamide)20,32, and SBSE is similar (cosine similarity 0.84) to the previously described signature in multiple myeloma genomes with prior melphalan exposure33,34,35.
SBSF was found in individuals treated with carboplatin or cisplatin and in a subset of oxaliplatin-treated individuals in whom it was present at much lower burdens. It is highly similar to COSMIC SBS31 (cosine similarity 0.95), which has previously been associated with prior platinum exposure in cancer genomes32,36 (Fig. 3). Platinum compounds act by binding DNA and forming intrastrand and interstrand DNA cross-links, in a similar manner to bifunctional alkylating agents. However, SBSF/SBS31 is different from the bifunctional nitrogen mustard signatures, indicating that the patterns of DNA damage and/or DNA repair induced by platinum agents and nitrogen mustards differ.
SBSG is highly similar to COSMIC SBS17 (cosine similarity 0.93), which has previously been found in the genomes of cancers exposed to 5-fluorouracil37 and in the normal intestine of one 5-fluorouracil-exposed individual19. It was undetectable in HSPCs and found at the highest burdens in lymphoid cells from individuals treated with 5-fluorouracil or its prodrug capecitabine (Fig. 4). 5-Fluorouracil is a pyrimidine analog misincorporated into DNA in place of thymine, consistent with causing a mutational signature characterized predominantly by thymine mutations.
Fig. 4: Mutation burden and SBS mutational signatures across different blood cell types.
Stacked bar plots represent the absolute contributions of each SBS mutational signature to the SBS mutation burden across cell types (left), compared to the proportionate contribution of each signature (right). HSPC data were generated by pooling HSPC WGS colony data from each individual. Mature blood cell data were generated using duplex sequencing of ~40,000 cells of each type. For the normal unexposed individuals, the T cell subset data are from CD4+ T cells; for the chemotherapy-exposed individuals, the T cell subsets contain both CD4+ and CD8+ T cells. SBSUnassigned indicates mutations that could not confidently be assigned to any reported signature. SBSNA indicates that duplex sequencing data are unavailable for this subset. In seven individuals, granulocyte mutation profiles were available, which were not discernibly different from the mutational spectra observed in HSPCs and monocytes from those individuals. Due to the lack of availability of this cell type for most patients, the data are not shown.
SBSH was detectable only in the T cells of a single individual who was also the only person to have received gemcitabine, a cytosine analog. However, the origin of SBSH remains uncertain.
The isolation of multiple HSPC colonies from each individual allowed for assessing the variation in mutagenic exposures across each of their HSPC populations. Although there was some variability in the mutation burdens attributable to cisplatin/carboplatin, procarbazine, chlorambucil and bendamustine (the most highly mutagenic agents) across HSPCs from each individual (Fig. 3), the evidence suggests that there were no HSPCs completely protected from DNA damage. The multiple HSPCs from each individual also allowed the formation of phylogenetic trees, permitting the timing of mutagenic impacts. The phylogenetic timings were in keeping with the known periods of exposure: PD47703 with both early-life exposure to procarbazine and chlorambucil and later-life exposure to bendamustine, PD37580 with both early- and late-life exposure to chlorambucil, and PD47699 with late-life exposure to melphalan (Fig. 3).
Although limited numbers of individuals, different drug combinations and different dose regimens preclude definitive evaluation, the inclusion of individuals treated with different members of the same chemotherapy class enabled a preliminary comparison of their effects. Among the nitrogen mustard alkylating agents, chlorambucil, bendamustine and melphalan caused substantially greater alkylating agent-associated mutation burdens in normal blood cells than cyclophosphamide, which engendered only minimal (3, Extended Data Fig. 5b and Supplementary Tables 5 and 6). Similarly, carboplatin and cisplatin caused much higher SBSF mutation burdens than oxaliplatin, which conferred SBSF mutation burdens of 3, Extended Data Fig. 6 and Supplementary Tables 5 and 6). Therefore, chemotherapeutic agents of the same class, some used interchangeably in cancer treatment, may confer substantially different mutation burdens in normal blood cells.
Flow sorting of monocytes, B cells, T memory cells and T naive cells enabled us to investigate the responses of different cell types to identical chemotherapy exposures. Overall, the patterns of SBS signature burdens in monocytes were similar to those in HSPCs, whereas the patterns in B and T lymphocytes showed differences for some agents (Supplementary Table 7). For example, SBSG, caused by 5-fluorouracil/capecitabine, contributed additional mutation burdens in B lymphocytes (P = 0.0), T naive cells (P = 0.0097) and T memory lymphocytes (P = 0.0014), but was undetectable in HSPCs and monocytes (Fig. 4). In contrast, SBSF, caused by the platinum agents, contributed larger mutation burdens in HSPCs, monocytes and B cells than in T naive and T memory cells, although we only have T cell data for one carboplatin-exposed individual (Fig. 4). The mutation loads contributed by SBSA, caused by procarbazine, were similar across cell types. Therefore, some chemotherapeutic agents engender different mutation burdens in different cell types.
Hematopoietic clonal architecture after chemotherapy
To investigate the effect of chemotherapies on the architecture of cell populations, we generated extensive phylogenies of HSPCs from six chemotherapy-exposed individuals and compared them to the HSPC phylogenies of nonexposed individuals of similar ages. An exemplar HSPC phylogeny of a normal, non-chemotherapy-exposed 48-year-old individual showed only one barely detectable clonal expansion and no ‘driver’ mutations in cancer genes (Fig. 5a). Such trees are typical of healthy middle-aged adults24.
Fig. 5: HSPC phylogenies for two normal unexposed and two chemotherapy-exposed adult individuals.
a,b, Phylogenies for two normal unexposed donors: one young adult (a) and one older adult (b). c,d, Phylogenies for two young adult chemotherapy-treated individuals, both with more than one chemotherapy exposure. Phylogenies were constructed using shared mutation data and the algorithm MPBoot (Methods). Branch lengths reflect the number of mutations assigned to the branch, with the terminal branches adjusted for sequence coverage; the overall root-to-tip branch lengths have been normalized to the same total length (because all colonies were collected from a single time point). The y axis represents the number of SBSs accumulating over time. Each tip on a phylogeny represents a single colony, with the respective numbers of colonies of each cell and tissue type recorded at the top. Onto these trees, we have layered clone- and colony-specific phenotypic information. We have highlighted branches on which we have identified known oncogenic drivers in 1 of 18 clonal hematopoiesis genes (Supplementary Table 2) color-coded by gene. A heat map at the bottom of each phylogeny highlights colonies from known driver clades colored by gene and the expanded clades (defined as those with a clonal fraction of >1%) in blue. In the individual in d, the AML was derived from the biallelic TP53-mutated clade carrying TP53 p.I195F and TP53 p.C176Y. Drugs not highlighted in bold text are those received by the individual at the same time but not believed to be the mutagenic agents.
Given that changes in the clonal composition of the HSPC population due to chemotherapy-induced bottlenecks and positive selection may take many years to become apparent, we focused on two individuals sampled 30 and 39 years after their earliest exposure to chemotherapy (PD37580 and PD47703; Fig. 5c,d). In contrast to normal middle-aged individuals, a 48-year-old woman (PD47703) treated for Hodgkin lymphoma with chlorambucil and procarbazine at age 10 years and bendamustine at age 47 years showed multiple independent clonal expansions carrying ‘driver’ mutations in the DNA damage response gene PPM1D (Fig. 5c). A similar pattern, with expanded PPM1D and TP53 mutant clones, was observed in a 43-year-old woman (PD37580) after long-term chlorambucil treatment (Fig. 5d). This pattern of multiple, large clonal expansions is characteristic of normal individuals aged >70 years24. However, in healthy older adults, clonal expansions exhibit predominantly DNMT3A and TET2 driver mutations or no apparent driver (Fig. 5b). While TP53 and PPM1D mutations can also be observed in the context of normal aging, the pattern of dozens of parallel clonal expansions harboring these mutations is likely to reflect the unique selective landscape induced by some chemotherapies.
Chemotherapy could induce this prematurely aged HSPC cell population profile by increasing mutation loads and/or by altering microenvironmental selection. Chemotherapy favors the survival of clonal hematopoiesis of indeterminate potential (CHIP) clones with driver mutations in PPM1D, TP53 and CHEK2 (ref. 21), which usually predate the chemotherapy. Similarly, the HSPC phylogenetic tree of PD37580 indicates that at least two PPM1D driver mutations arose before the chemotherapy given during childhood (Extended Data Fig. 7a). Furthermore, in PD47703, a comparison of two samples taken 1 year apart, during which additional chemotherapy (cyclophosphamide, doxorubicin and vincristine) had been administered, revealed an approximately 50% increase in the size of preexisting PPM1D mutated clones and no new mutant clones (Extended Data Fig. 7b). Thus, chemotherapy-induced changes in selection appear more influential than chemotherapy-induced creation of new driver mutations in generating the prematurely aged HSPC profile.
The prematurely aged architecture of the HSPC population was not observed in two young adults (PD50308 aged 29 years and PD50307 aged 40 years) who received chemotherapy that caused substantial increases in mutation loads and was administered 2 years or less before sampling (Extended Data Fig. 8). It was also not observed in two further individuals who were treated with cyclophosphamide and oxaliplatin (PD44579 aged 63 years and PD47537 aged 61 years) and exhibited minimally increased mutation loads (Extended Data Fig. 9). Therefore, it is conceivable that multiple and/or prolonged chemotherapeutic exposures are required to generate the prematurely aged architecture. However, it is also possible that chemotherapy-engendered clonal expansions require decades to become detectable, as already demonstrated for clones under positive selection during normal aging24,38.
Changes in clonal architecture resulting from chemotherapy exposure are relevant for two reasons: first, PPM1D mutant clones may themselves reduce the regenerative ability of the bone marrow21,39, or the presence of PPM1D clones may simply be a marker of a more general state of reduced hematopoietic stem cell (HSC) function after chemotherapy. One may speculate that the presence of many such clones had a role in the development of cytopenias and infections in PD47703 following autograft treatment. Second, the selection of TP53 mutant clones confers a high risk of developing secondary myeloid malignancies, including AML as seen in PD37580, whose disease was treatment-refractory and carried biallelic TP53 mutations and a complex karyotype.